Ethereum Price Outlook: Will ETH Challenge $2,150 After Maintaining Critical Support?
An analysis of Ethereum's current price trends and market resistance levels.


Ethereum is striving to establish a solid foundation; however, the overall market situation has yet to exhibit sufficient changes to suggest a genuine trend reversal. The cryptocurrency remains above its February support level, which is significant, yet it continues to trade below critical resistance points, indicating that the market is still in a recovery phase rather than confirming a bullish trend.
Daily Chart Analysis
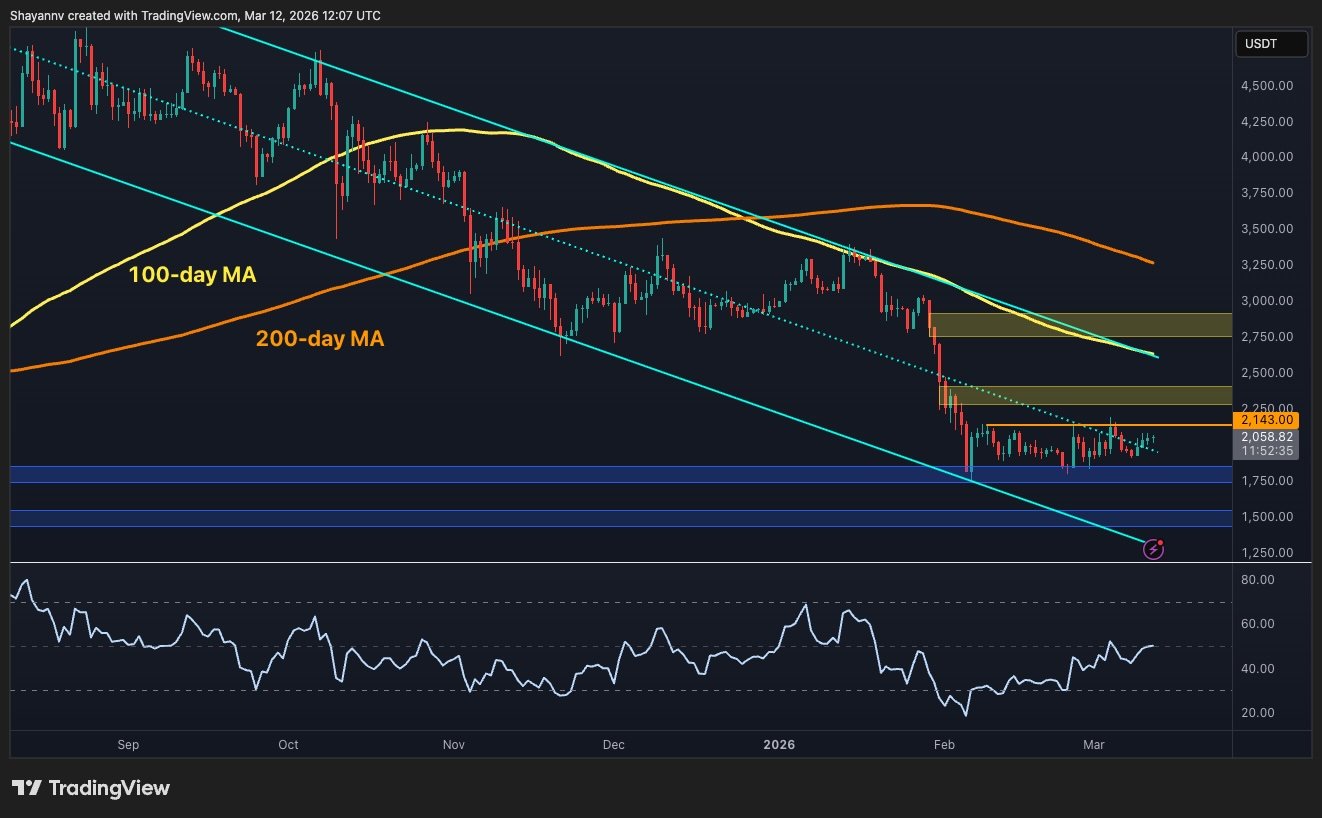
The daily chart indicates a downtrend. ETH is currently positioned below both its 100-day and 200-day moving averages, continuing a downward trajectory marked by lower highs. The sharp sell-off in early February severely impacted the chart, and despite a calming of panic, buyers have not sufficiently repaired the long-term outlook.
A noteworthy aspect is the market’s defense of the $1,800-$1,700 demand zone, which acts as a crucial boundary between stabilization and potential weakness. On the upper side, ETH faces resistance around $2,150, followed by the $2,400 supply zone, while significant bearish pivot points lie much higher near $2,800. For now, the market appears to be attempting a rebound within an overarching downtrend, rather than breaking free from it.
ETH Daily Chart
4-Hour Chart Insights
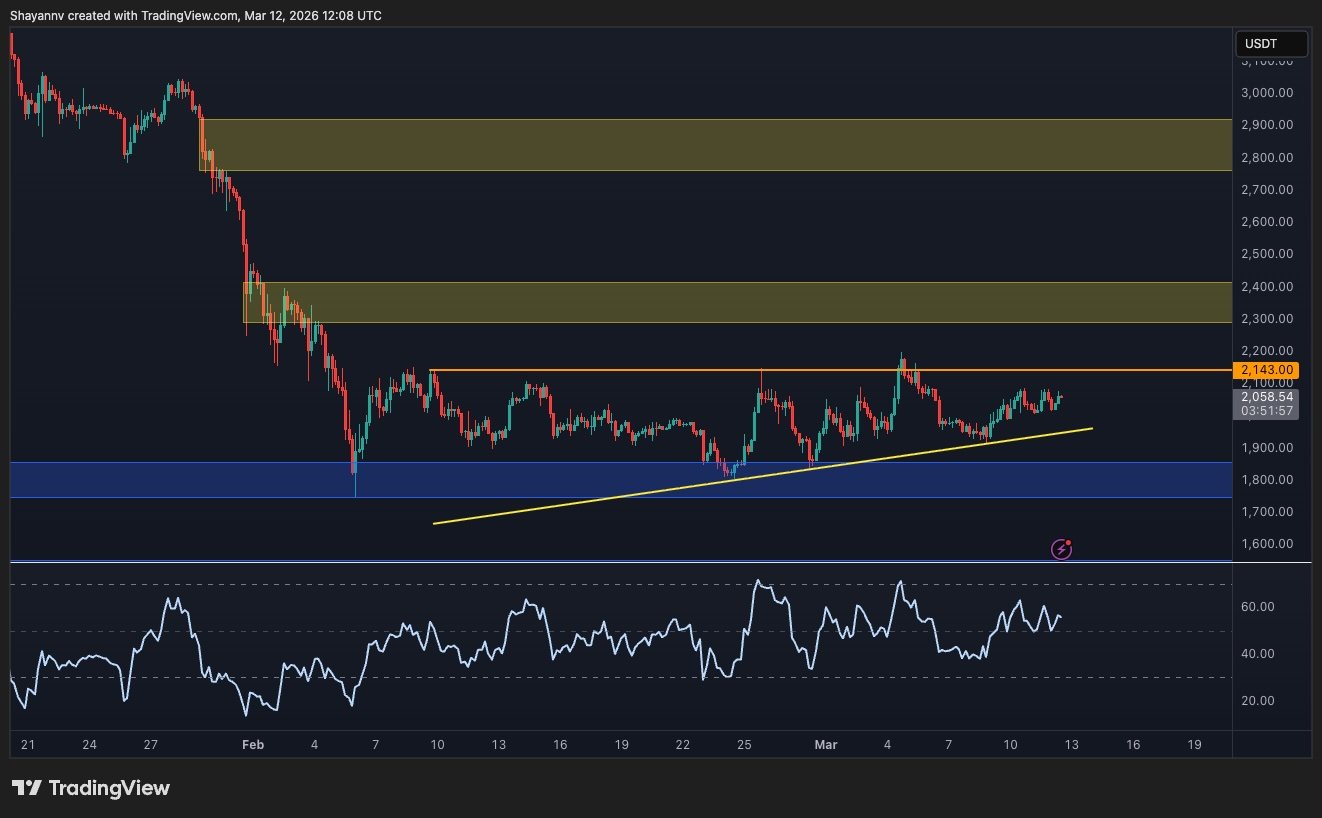
The 4-hour chart shows a more positive outlook. Since the late-February low, ETH has been forming a series of higher lows, and the supporting rising trendline suggests that buyers are increasingly intervening on dips instead of permitting another immediate drop. The momentum also appears to be improving, with the RSI stabilizing and maintaining a healthier range compared to previous downturns.
Despite this, buyers face a significant challenge: breaching the ceiling. The $2,150 level has been a persistent barrier, and until this resistance is overcome, the recent price movements resemble controlled consolidation rather than a new breakout. Should this level be reclaimed, ETH could swiftly move towards the next supply zone around $2,300 to $2,400. Otherwise, the market may remain confined in a horizontal pattern above the support regions.
 ETH 4-Hour Chart
On-Chain Analysis
Examining active addresses provides insight beyond mere price fluctuations. Recent network activity exhibited significant growth, suggesting continued user engagement with Ethereum, even when the market structure appeared shaky. This divergence indicates that despite some declines, the blockchain has not completely lost user participation.
Conversely, the recent decrease in active addresses suggests that engagement has dwindled amid price pressures. Thus, while there isn’t an unequivocal bullish signal, the underlying activity offers some support for a medium-term recovery hypothesis, contingent on prices overcoming existing resistance.
