

Bitcoin is moving into a crucial phase of its recovery. After weeks of rebuilding from the drop in February, the market is beyond merely holding support. It is now advancing towards a significant resistance band situated around the $80K mark, which is a pivotal zone where a brief relief rally could either escalate into a more substantial trend or be rejected back into the previous range.
Bitcoin Price Overview
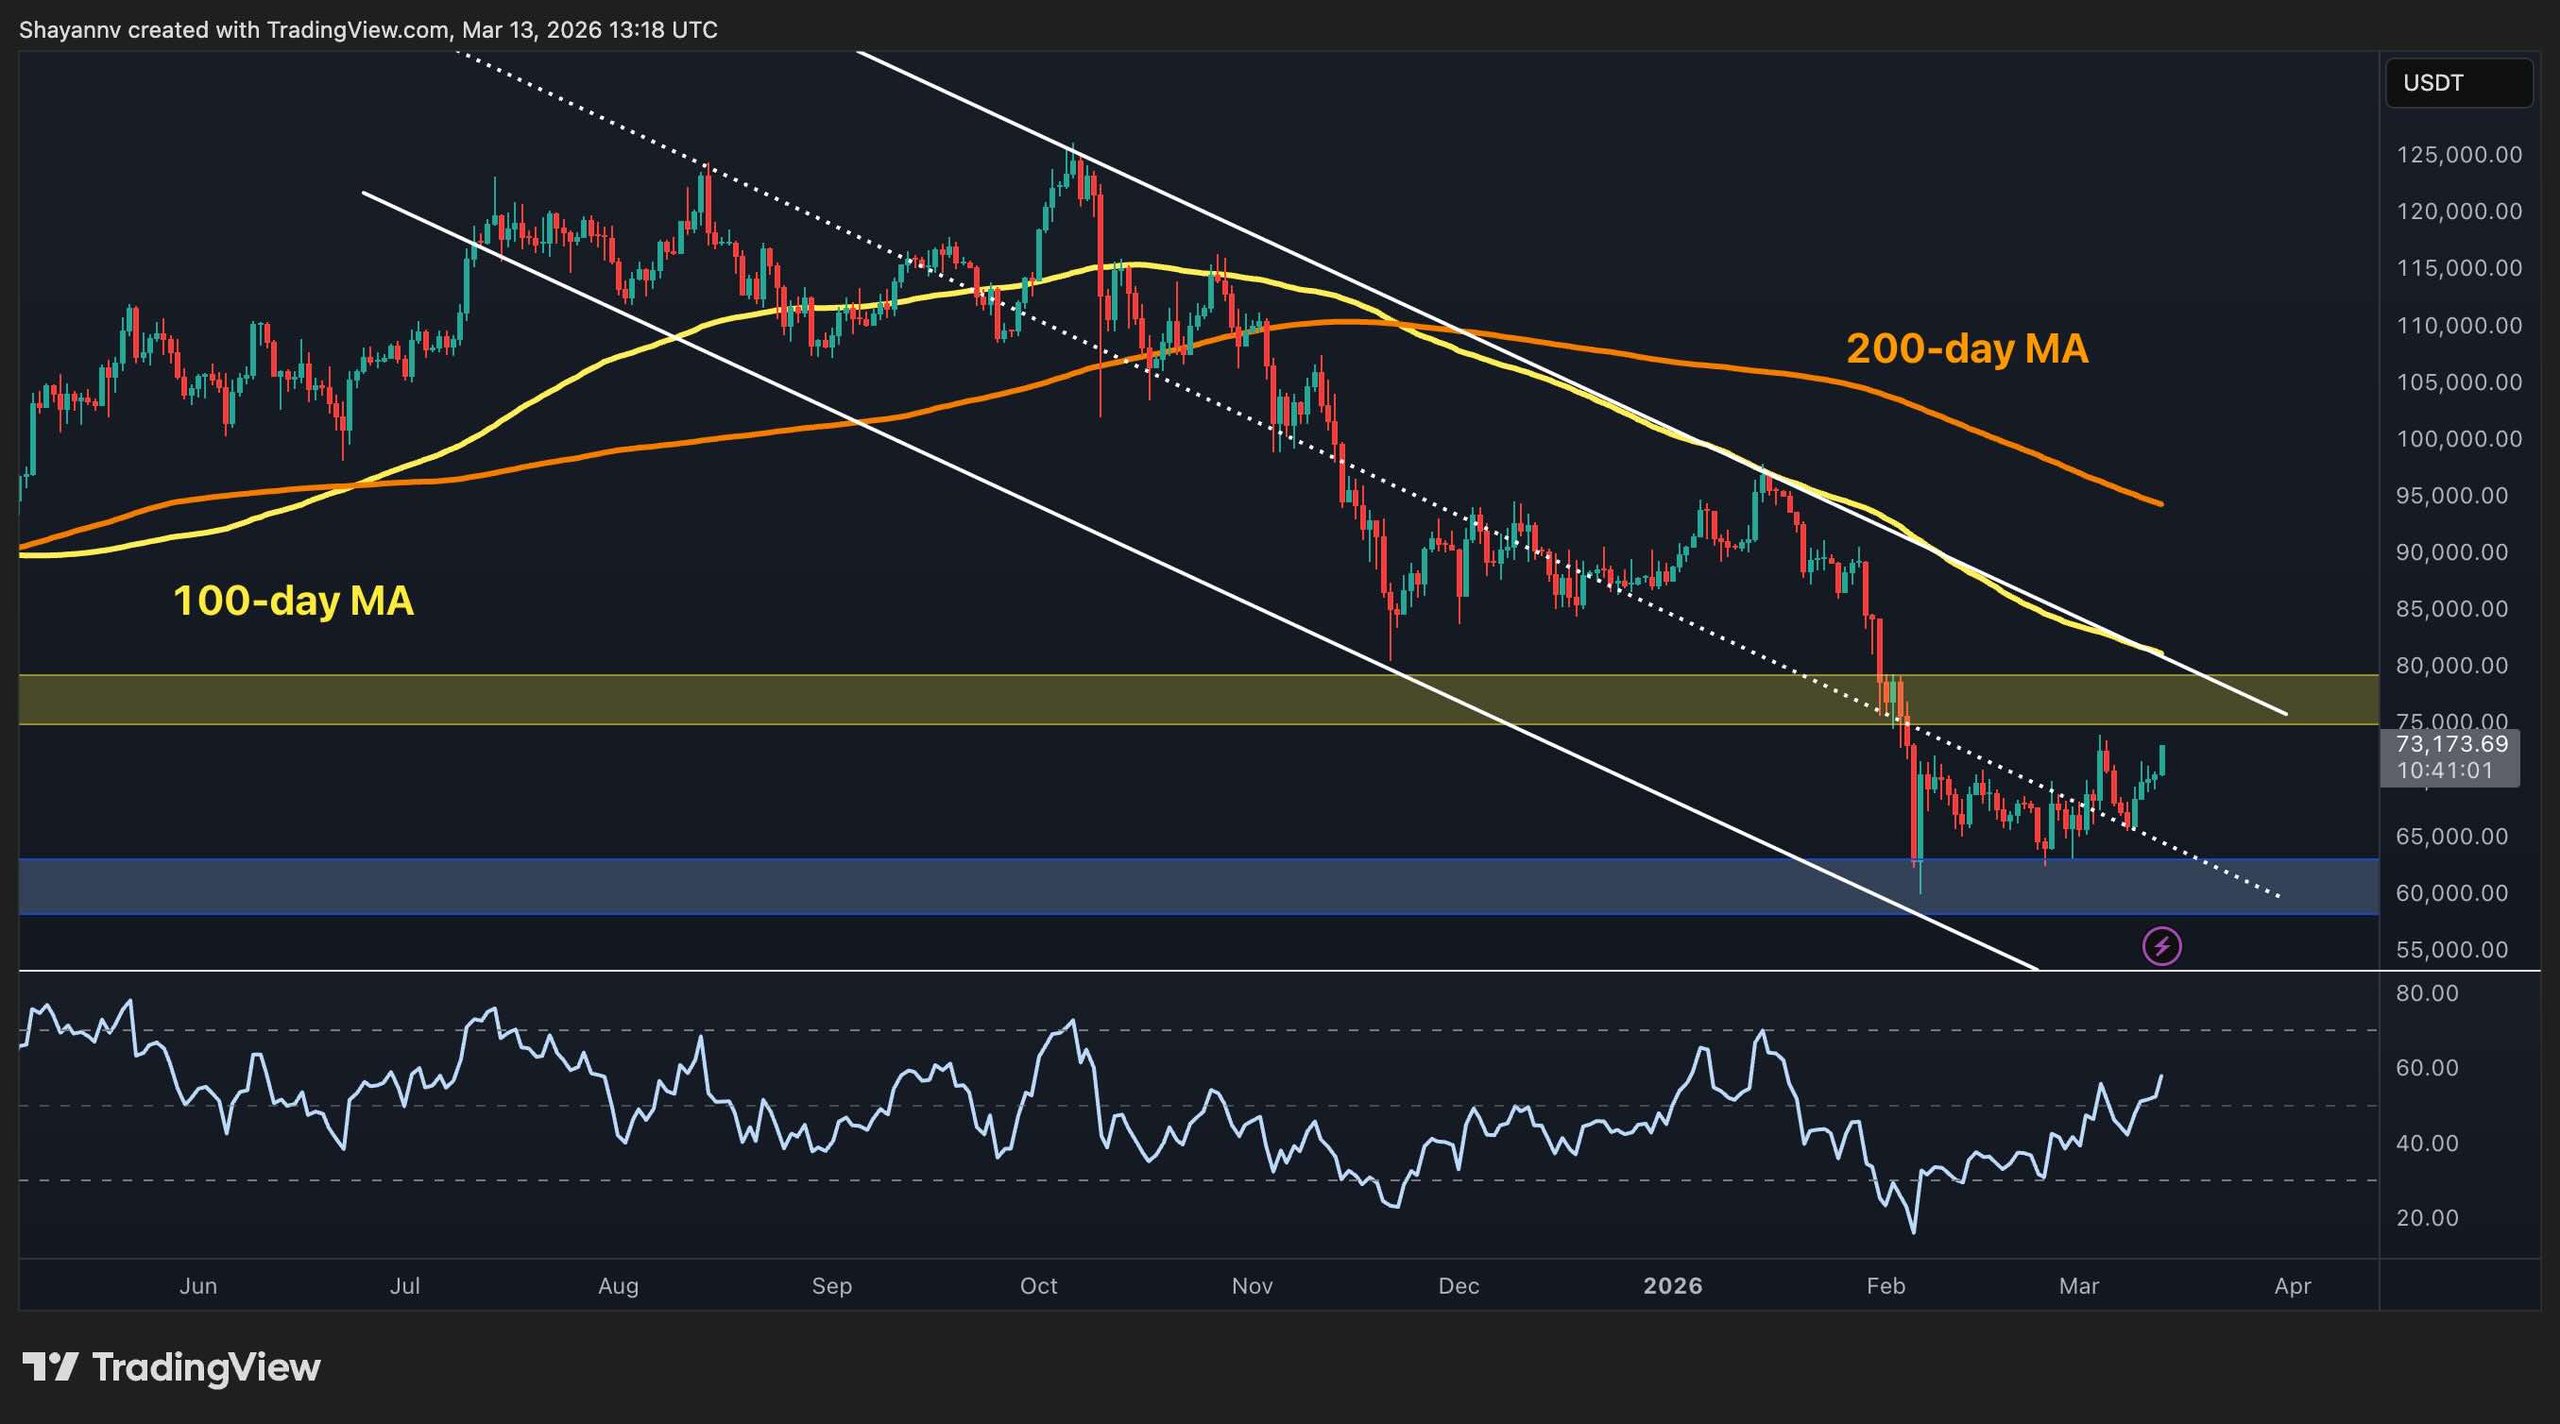
The daily price chart indicates positive developments, yet it hasn’t fully turned bullish. BTC has risen from the demand area near $60K to $62K, and is now approaching the prior breakdown zone between $75K and $80K. This area previously served as support before being lost in the broader downtrend. Reaching it again indicates that buyers are regaining control, but actually reclaiming it remains a challenge.
Caution is still advised as the price lingers below the declining 100-day and 200-day moving averages, both of which are still moving lower. This suggests that the macro trend has not yet been resolved. Essentially, BTC is rallying into overhead resistance while remaining under significant trend filters. A daily acceptance above $75K would substantially improve the technical outlook; otherwise, this could simply be a rebound in a larger corrective phase.
BTC Daily Chart
4-Hour BTC/USDT Analysis
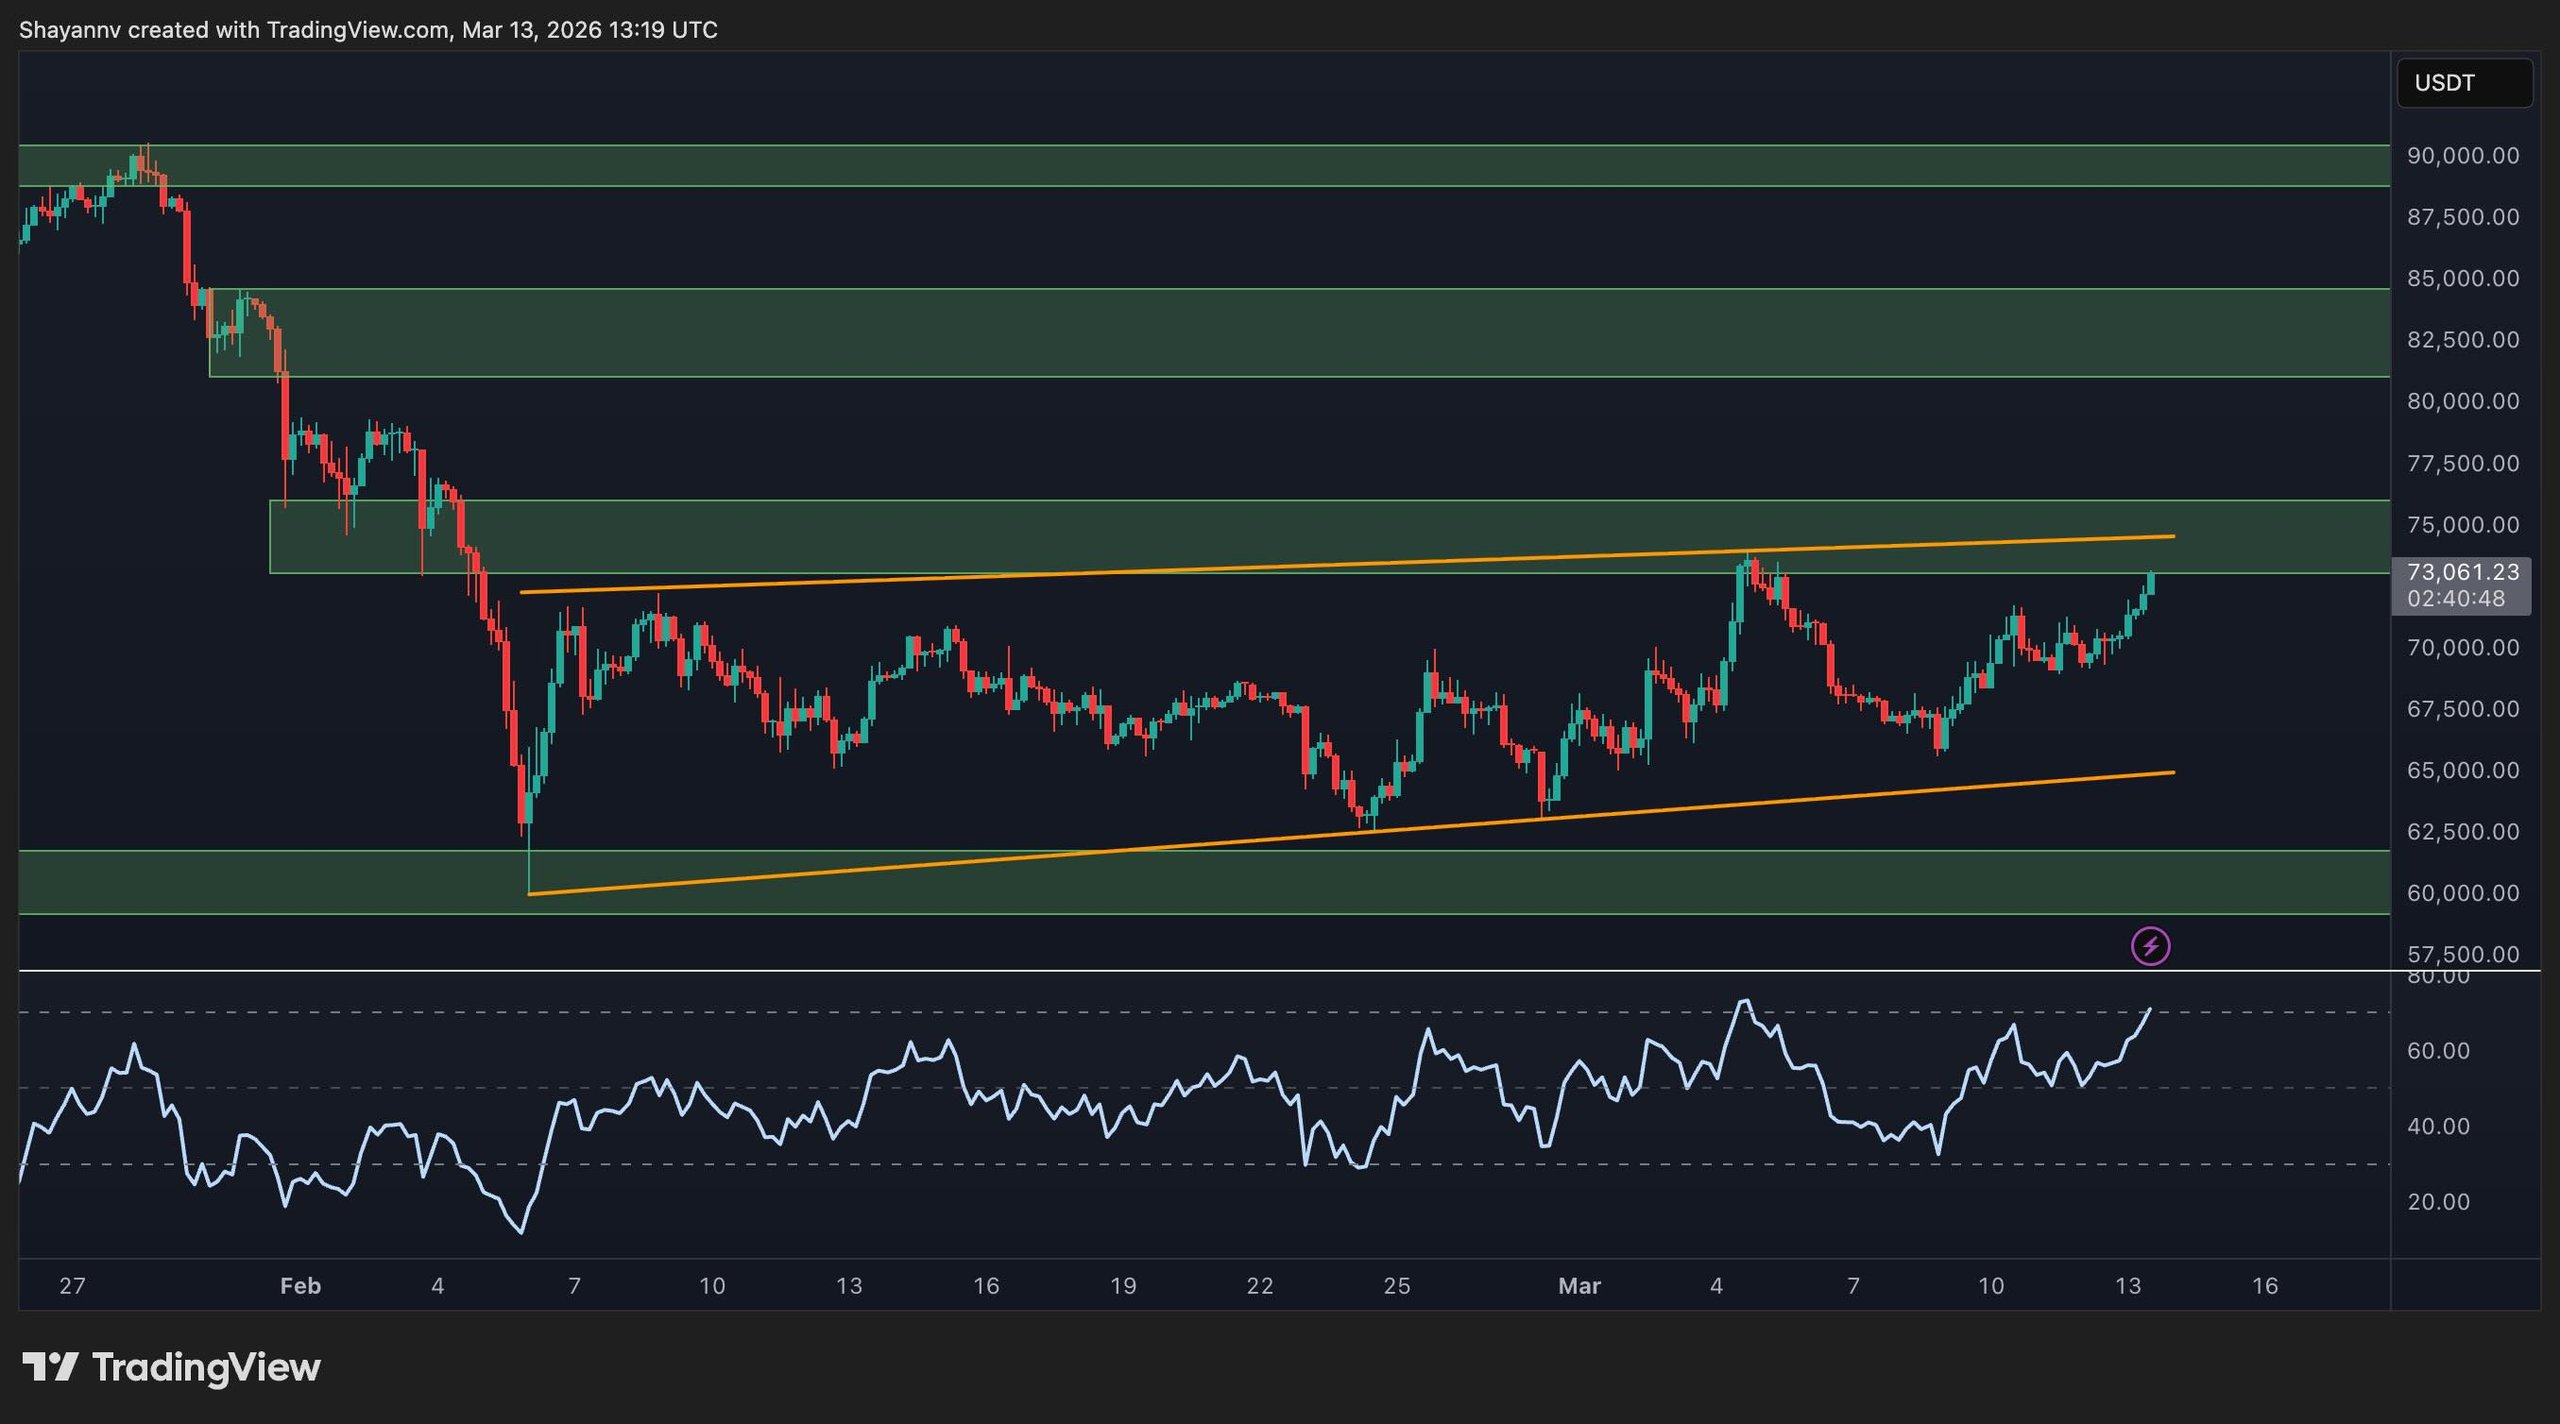
The four-hour chart showcases a clearer recovery pattern. Bitcoin is forming a rising structure with higher lows, and the recent upward momentum is pushing the price towards the upper boundary of this pattern. The market is actively testing resistance, typically indicating an impending breakout or a sharp reaction.
Momentum supports positive short-term strength, with the RSI reaching the upper limit of its range. However, this also implies that BTC approaches resistance with momentum already stretched. The next move is vital; a clean break above the channel top and the $73K to $75K supply band would indicate continuity towards the next resistance zones. Conversely, a rejection would likely pull the price back towards the mid-range, trapping the market in prolonged consolidation.
 BTC 4-Hour Chart
On-Chain Insights
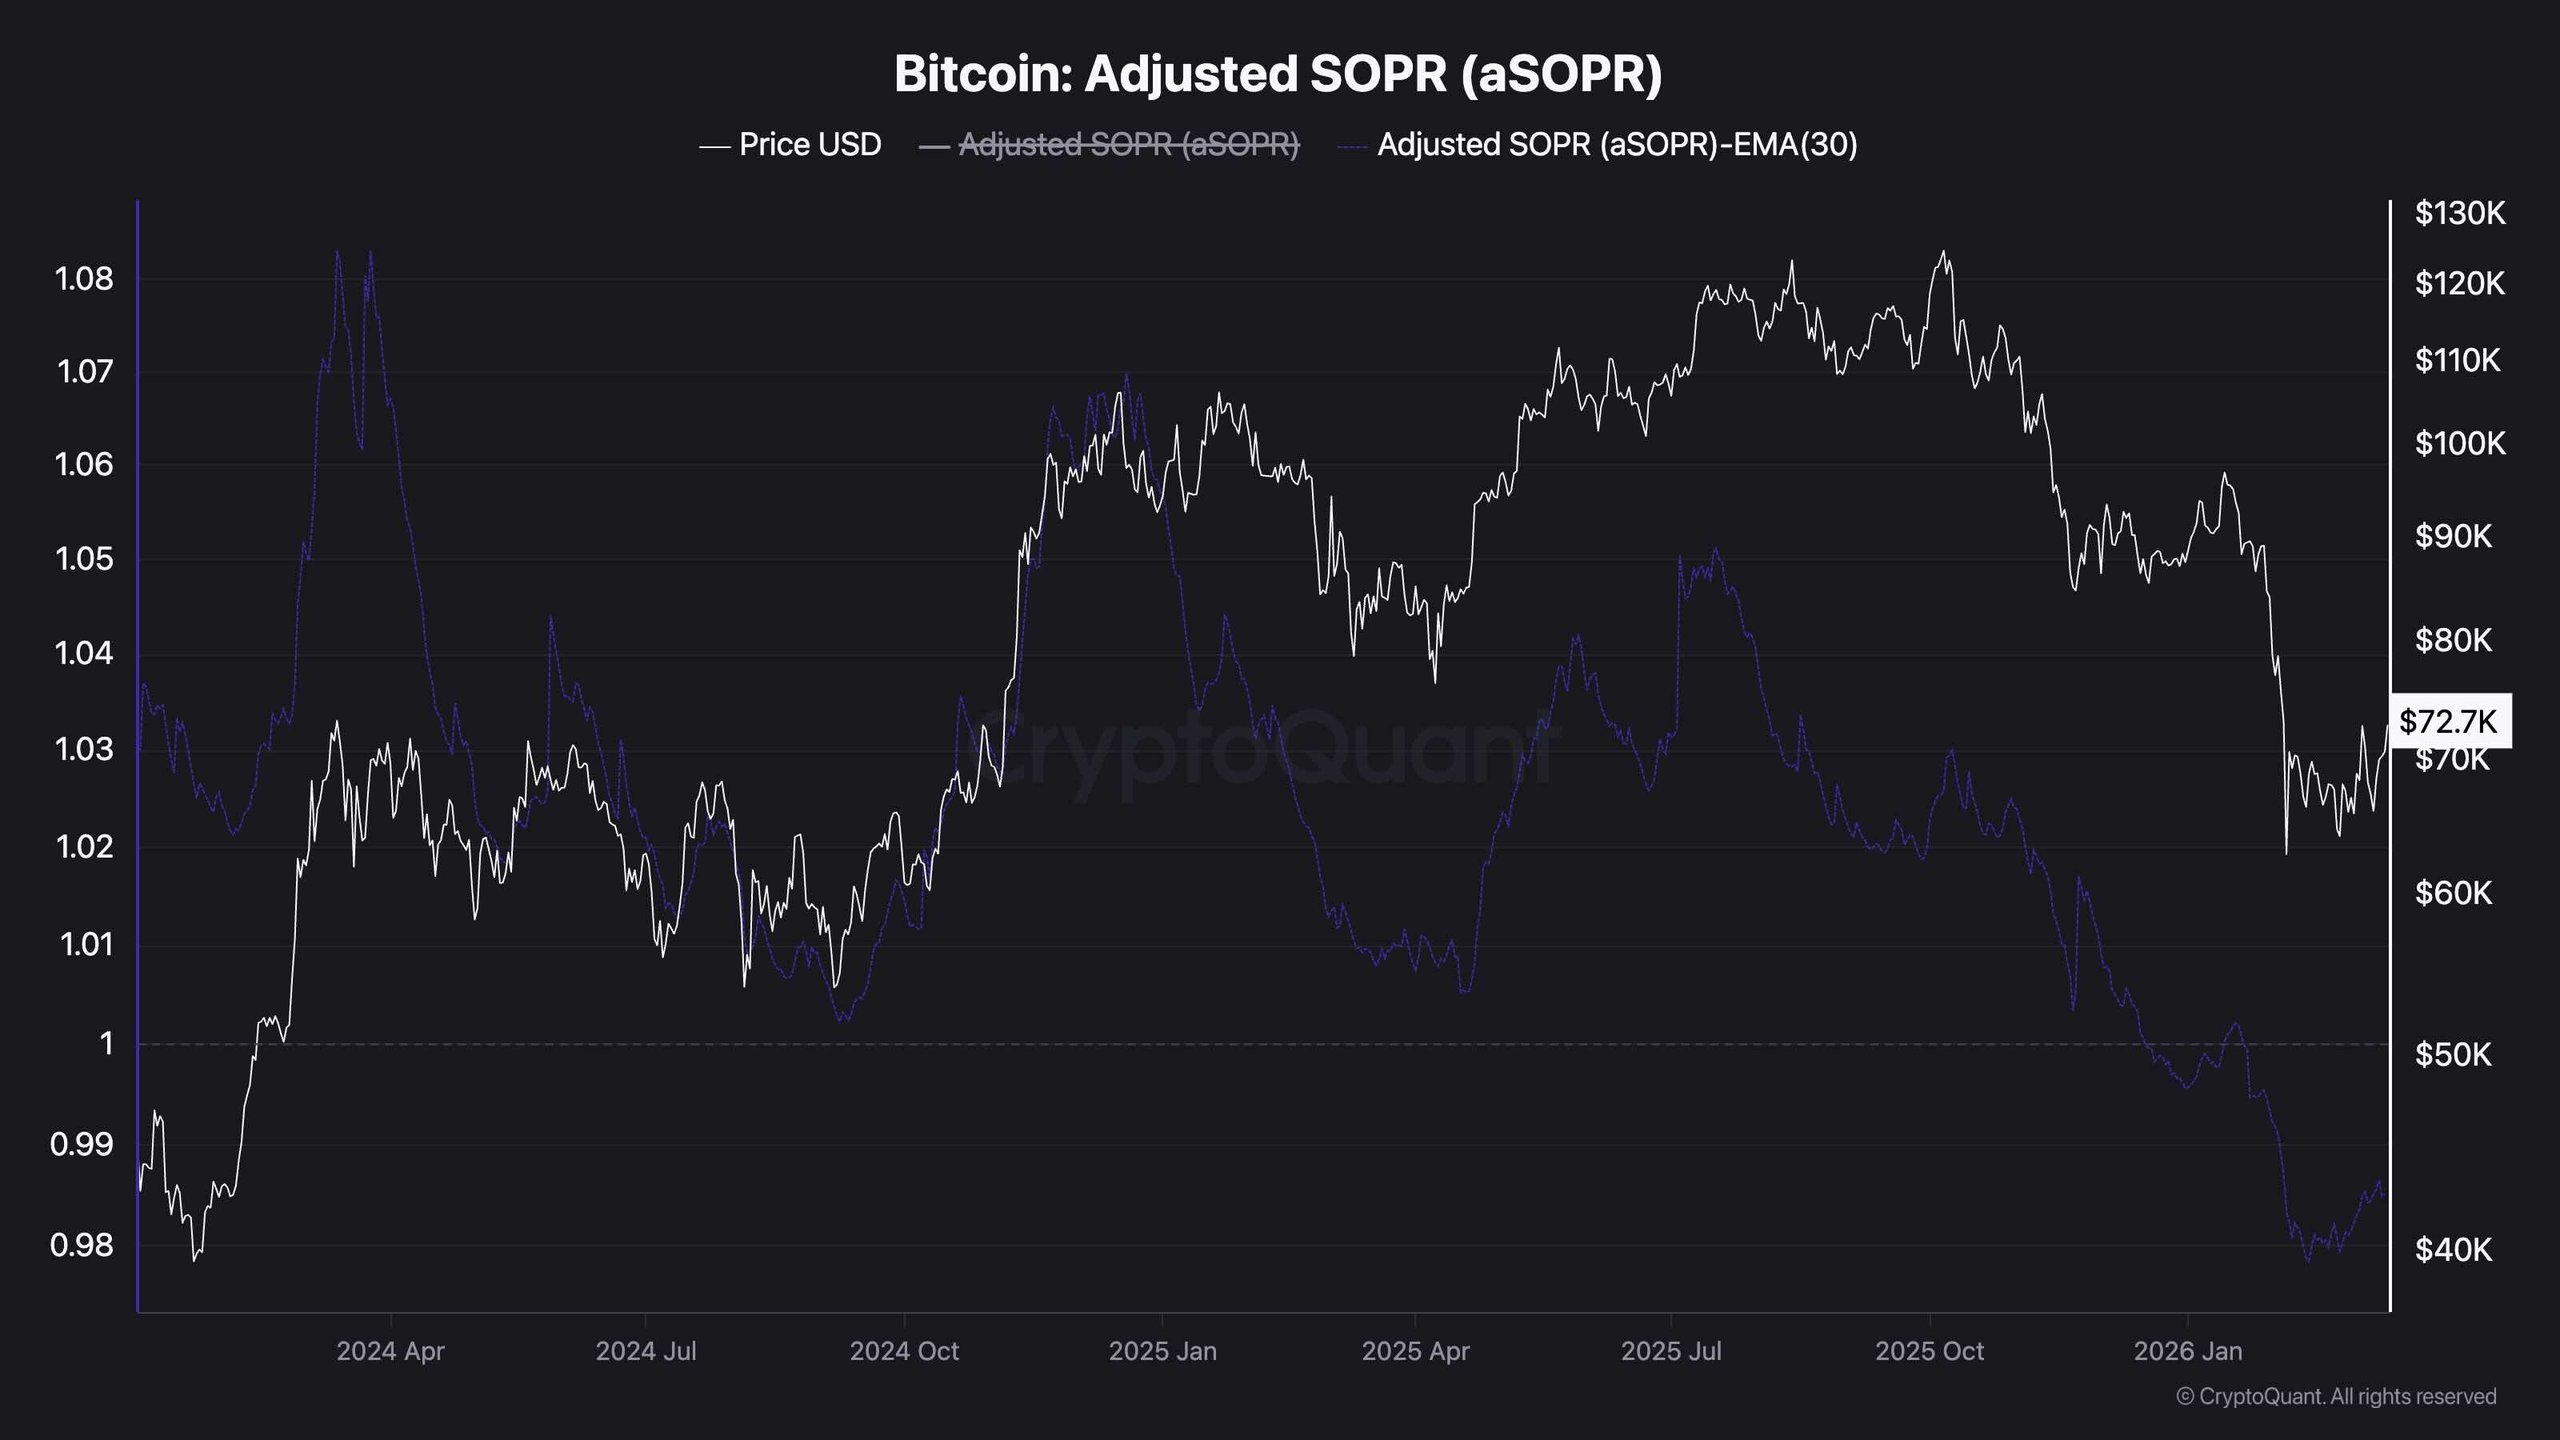
On-chain data adds extra intrigue. Currently, Bitcoin’s adjusted SOPR remains below 1, indicating that coins moved on-chain are generally still being exchanged at a loss. This behavior is common in corrective phases, and suggests the market hasn’t fully shifted back to profit-taking behavior yet. Despite the recent price recovery, network data implies that the broader reset might not be entirely concluded.
Simultaneously, aSOPR is beginning to rebound from its lows, suggesting improving conditions. While this does not alone confirm an expansion phase, it hints that the worst of the capitulation pressure could be behind the market. In essence, price is testing resistance while on-chain behavior attempts to strengthen. A confirmed breakout on the chart alongside a return above 1 on aSOPR would enhance Bitcoin’s outlook significantly.
 Adjusted SOPR Chart
Note
Special Offer for CryptoPotato readers: Get a $600 exclusive welcome offer on Binance. Follow safe investment practices.
