Bitcoin Price Outlook: Can BTC Rebound After Falling Below $66K?
A critical analysis of Bitcoin's current market behavior, potential support levels, and price predictions following a significant drop.


Bitcoin is currently in a precarious position, probing the lower limits of its recent price consolidation after retreating significantly from late-2025 highs. The evolving market structure suggests a potential accumulation zone, though short-term fluctuations are confined within a broadening channel.
Nevertheless, market volatility remains high, and the next few trading sessions could be pivotal in determining whether BTC can find stability above $60k or if it will descend further towards the support area near $50k.
Bitcoin Price Analysis: The Daily Chart
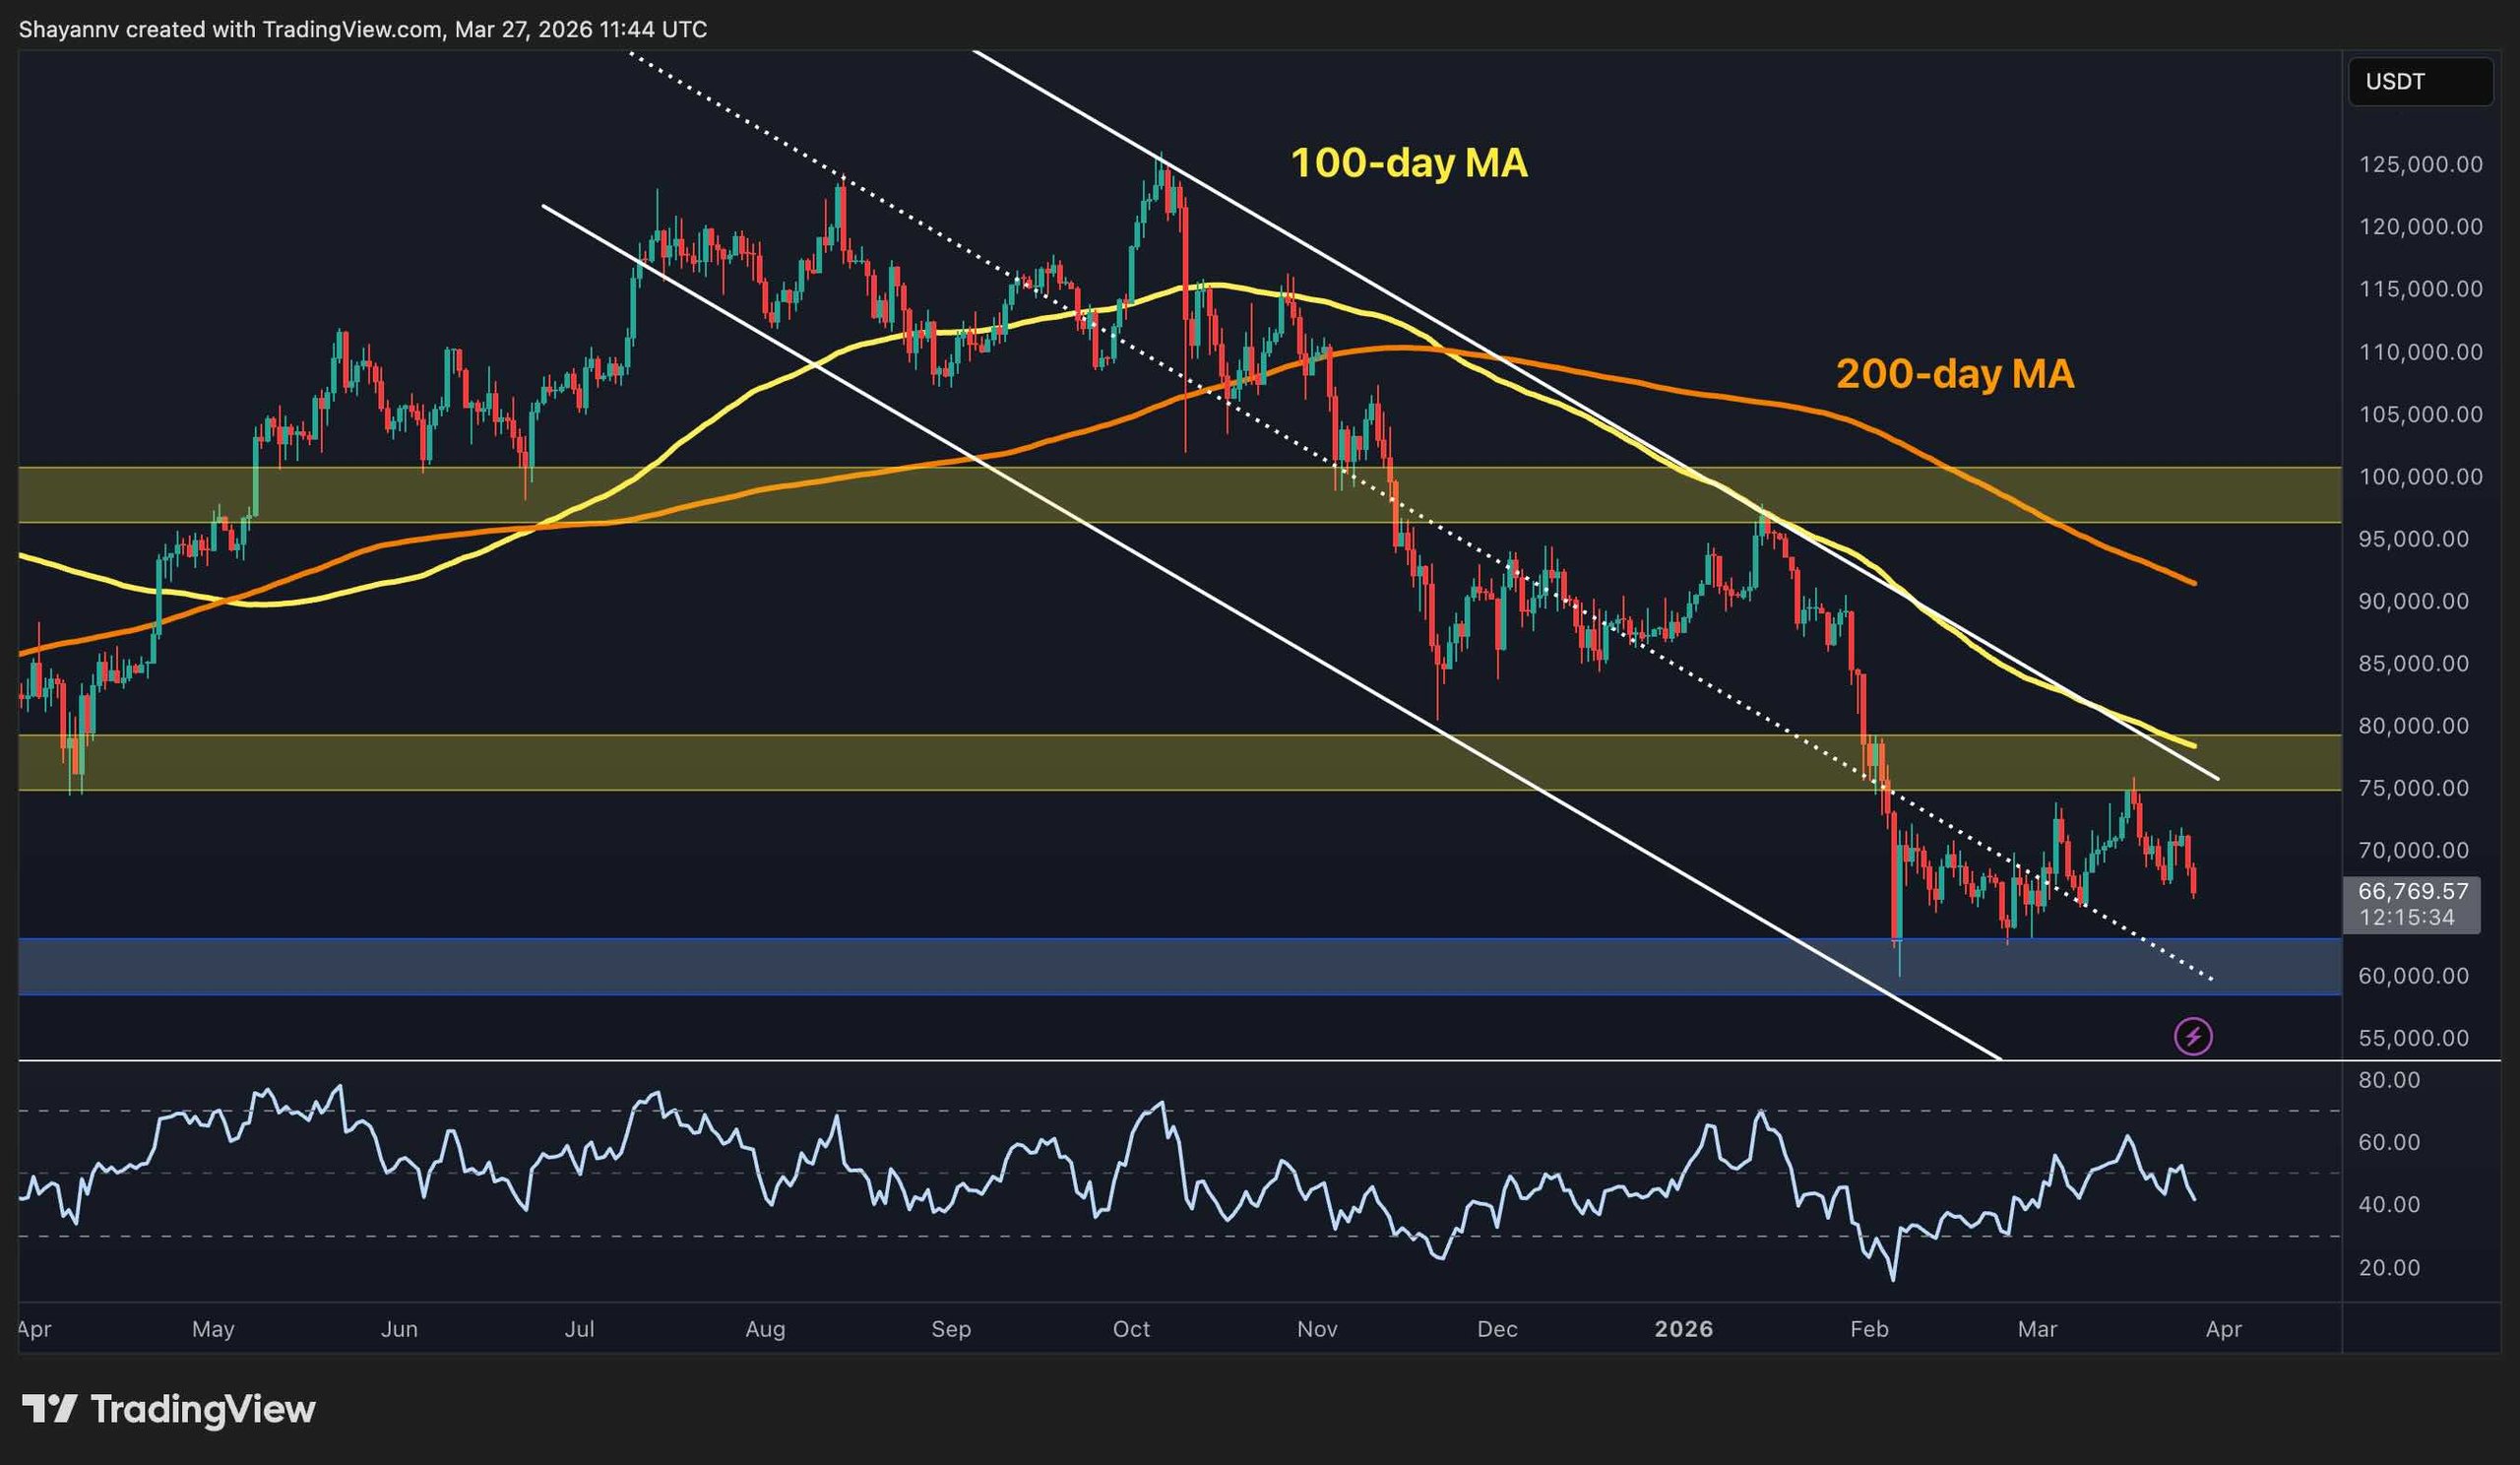
On the daily charts, BTC displays mixed signals with prices lingering below both the 100-day (~$80k) and 200-day (~$90k) moving averages within a descending channel. This trend underlines a bearish medium-term trajectory. Yet, the current consolidation hovers just above a robust support zone around $60k, coinciding with previous liquidity and demand areas.
The RSI has rebounded from oversold territories but is once again trending down, following rejection from the $75k resistance. With prices continuing to decline, another test of the crucial $60k demand zone appears imminent, and BTC’s short to mid-term direction is heavily reliant on market reactions at this threshold.
BTC Daily Chart
BTC/USDT 4-Hour Chart
If we examine the 4-hour chart, it becomes evident that BTC has been forming an ascending channel resembling a bearish flag. Throughout the past months, BTC has fluctuated between $60k and $75k, defined by the limits of this channel and key support and resistance levels.
The recent spike in volatility, reflected in a hefty decline towards the lower channel boundary, indicates a bearish shift in the short-term market structure post a failed breakout over the channel and horizontal resistance. This scenario raises concerns for buyers as a potential channel breakdown with momentum could trigger another drop towards the $60k area, inciting market anxiety.
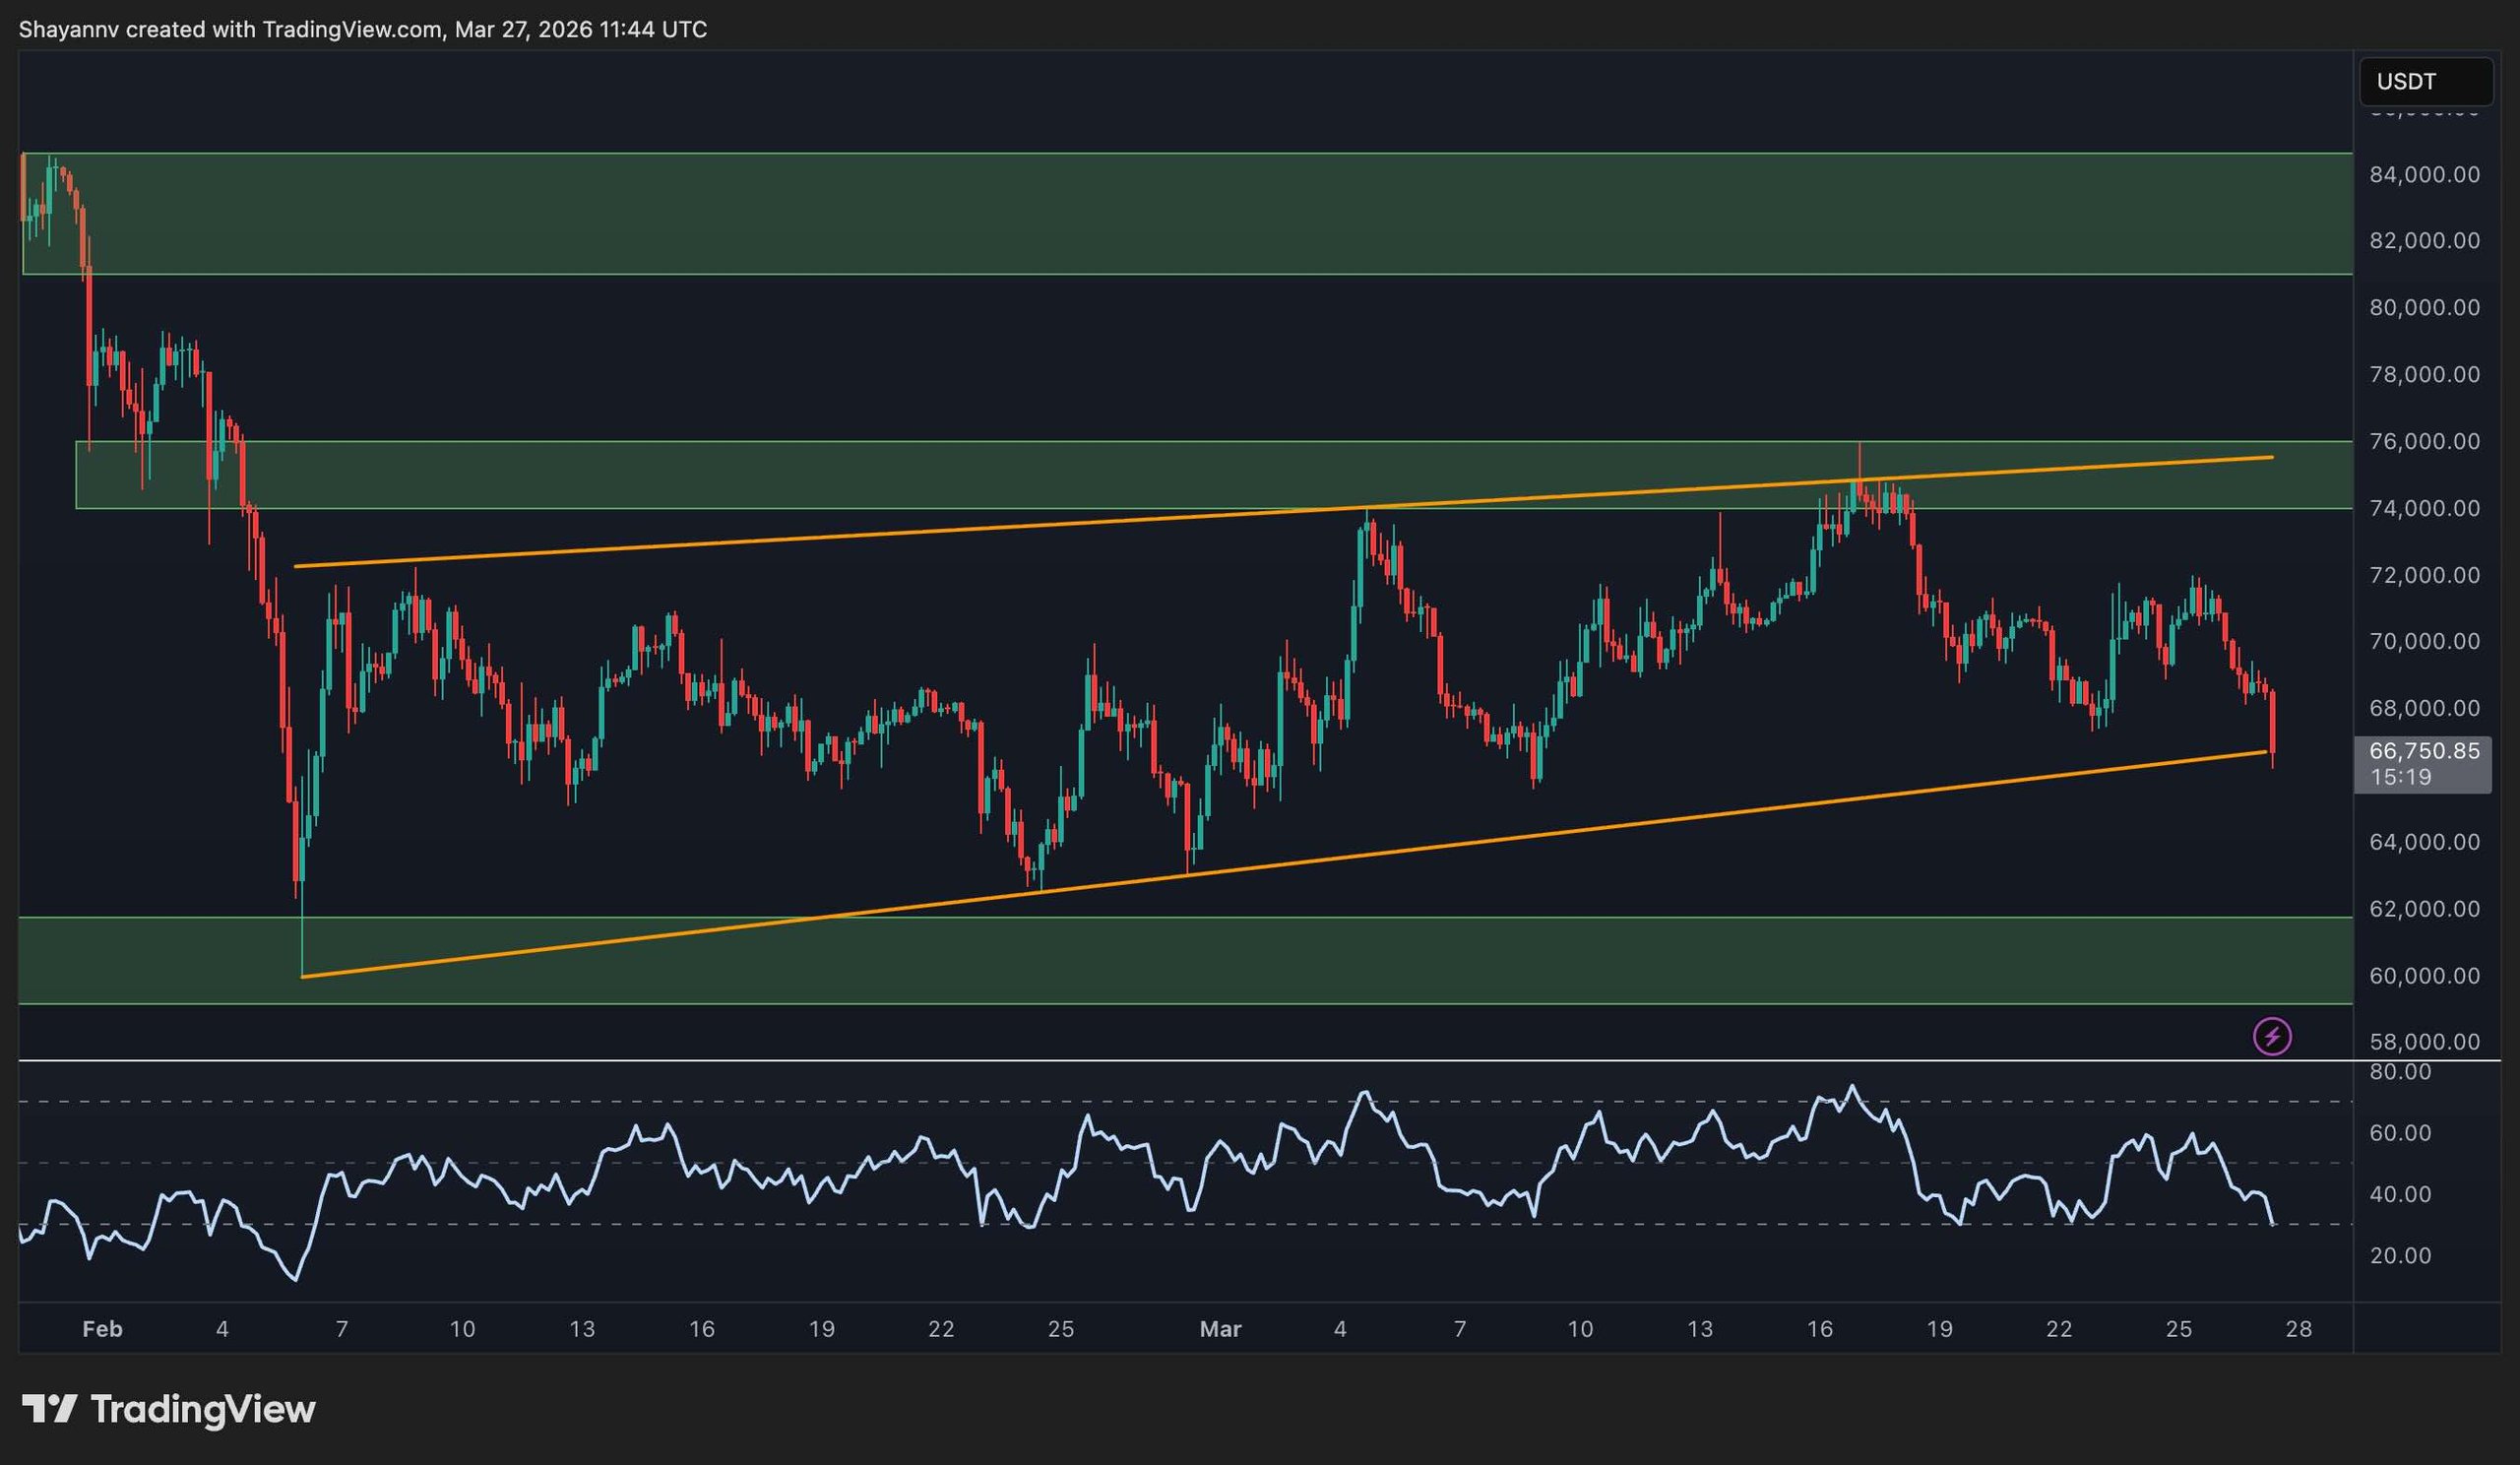 BTC 4H Chart
On-Chain Analysis
Current on-chain metrics underscore a significant point in this cycle. The LTH-SOPR/STH-SOPR ratio has dipped below one, nearing figures seen during the last market cycle’s accumulation phase in 2023.
This ratio illustrates long-term holders (LTH) realizing profits compared to short-term holders (STH). A ratio below 1 signifies LTHs selling at losses or at break-even, while STHs face considerable pressure. Historically, these low readings frequently align with market bottoms and robust accumulation periods.
This trend suggests that the current decrease in the ratio may signal capitulation from less robust investors, while more patient participants accumulate BTC within current ranges, potentially establishing the groundwork for the upcoming bullish phase.
However, such signals must coincide with positive price movements soon since even resilient holders cannot maintain positions indefinitely during significant drawdowns.
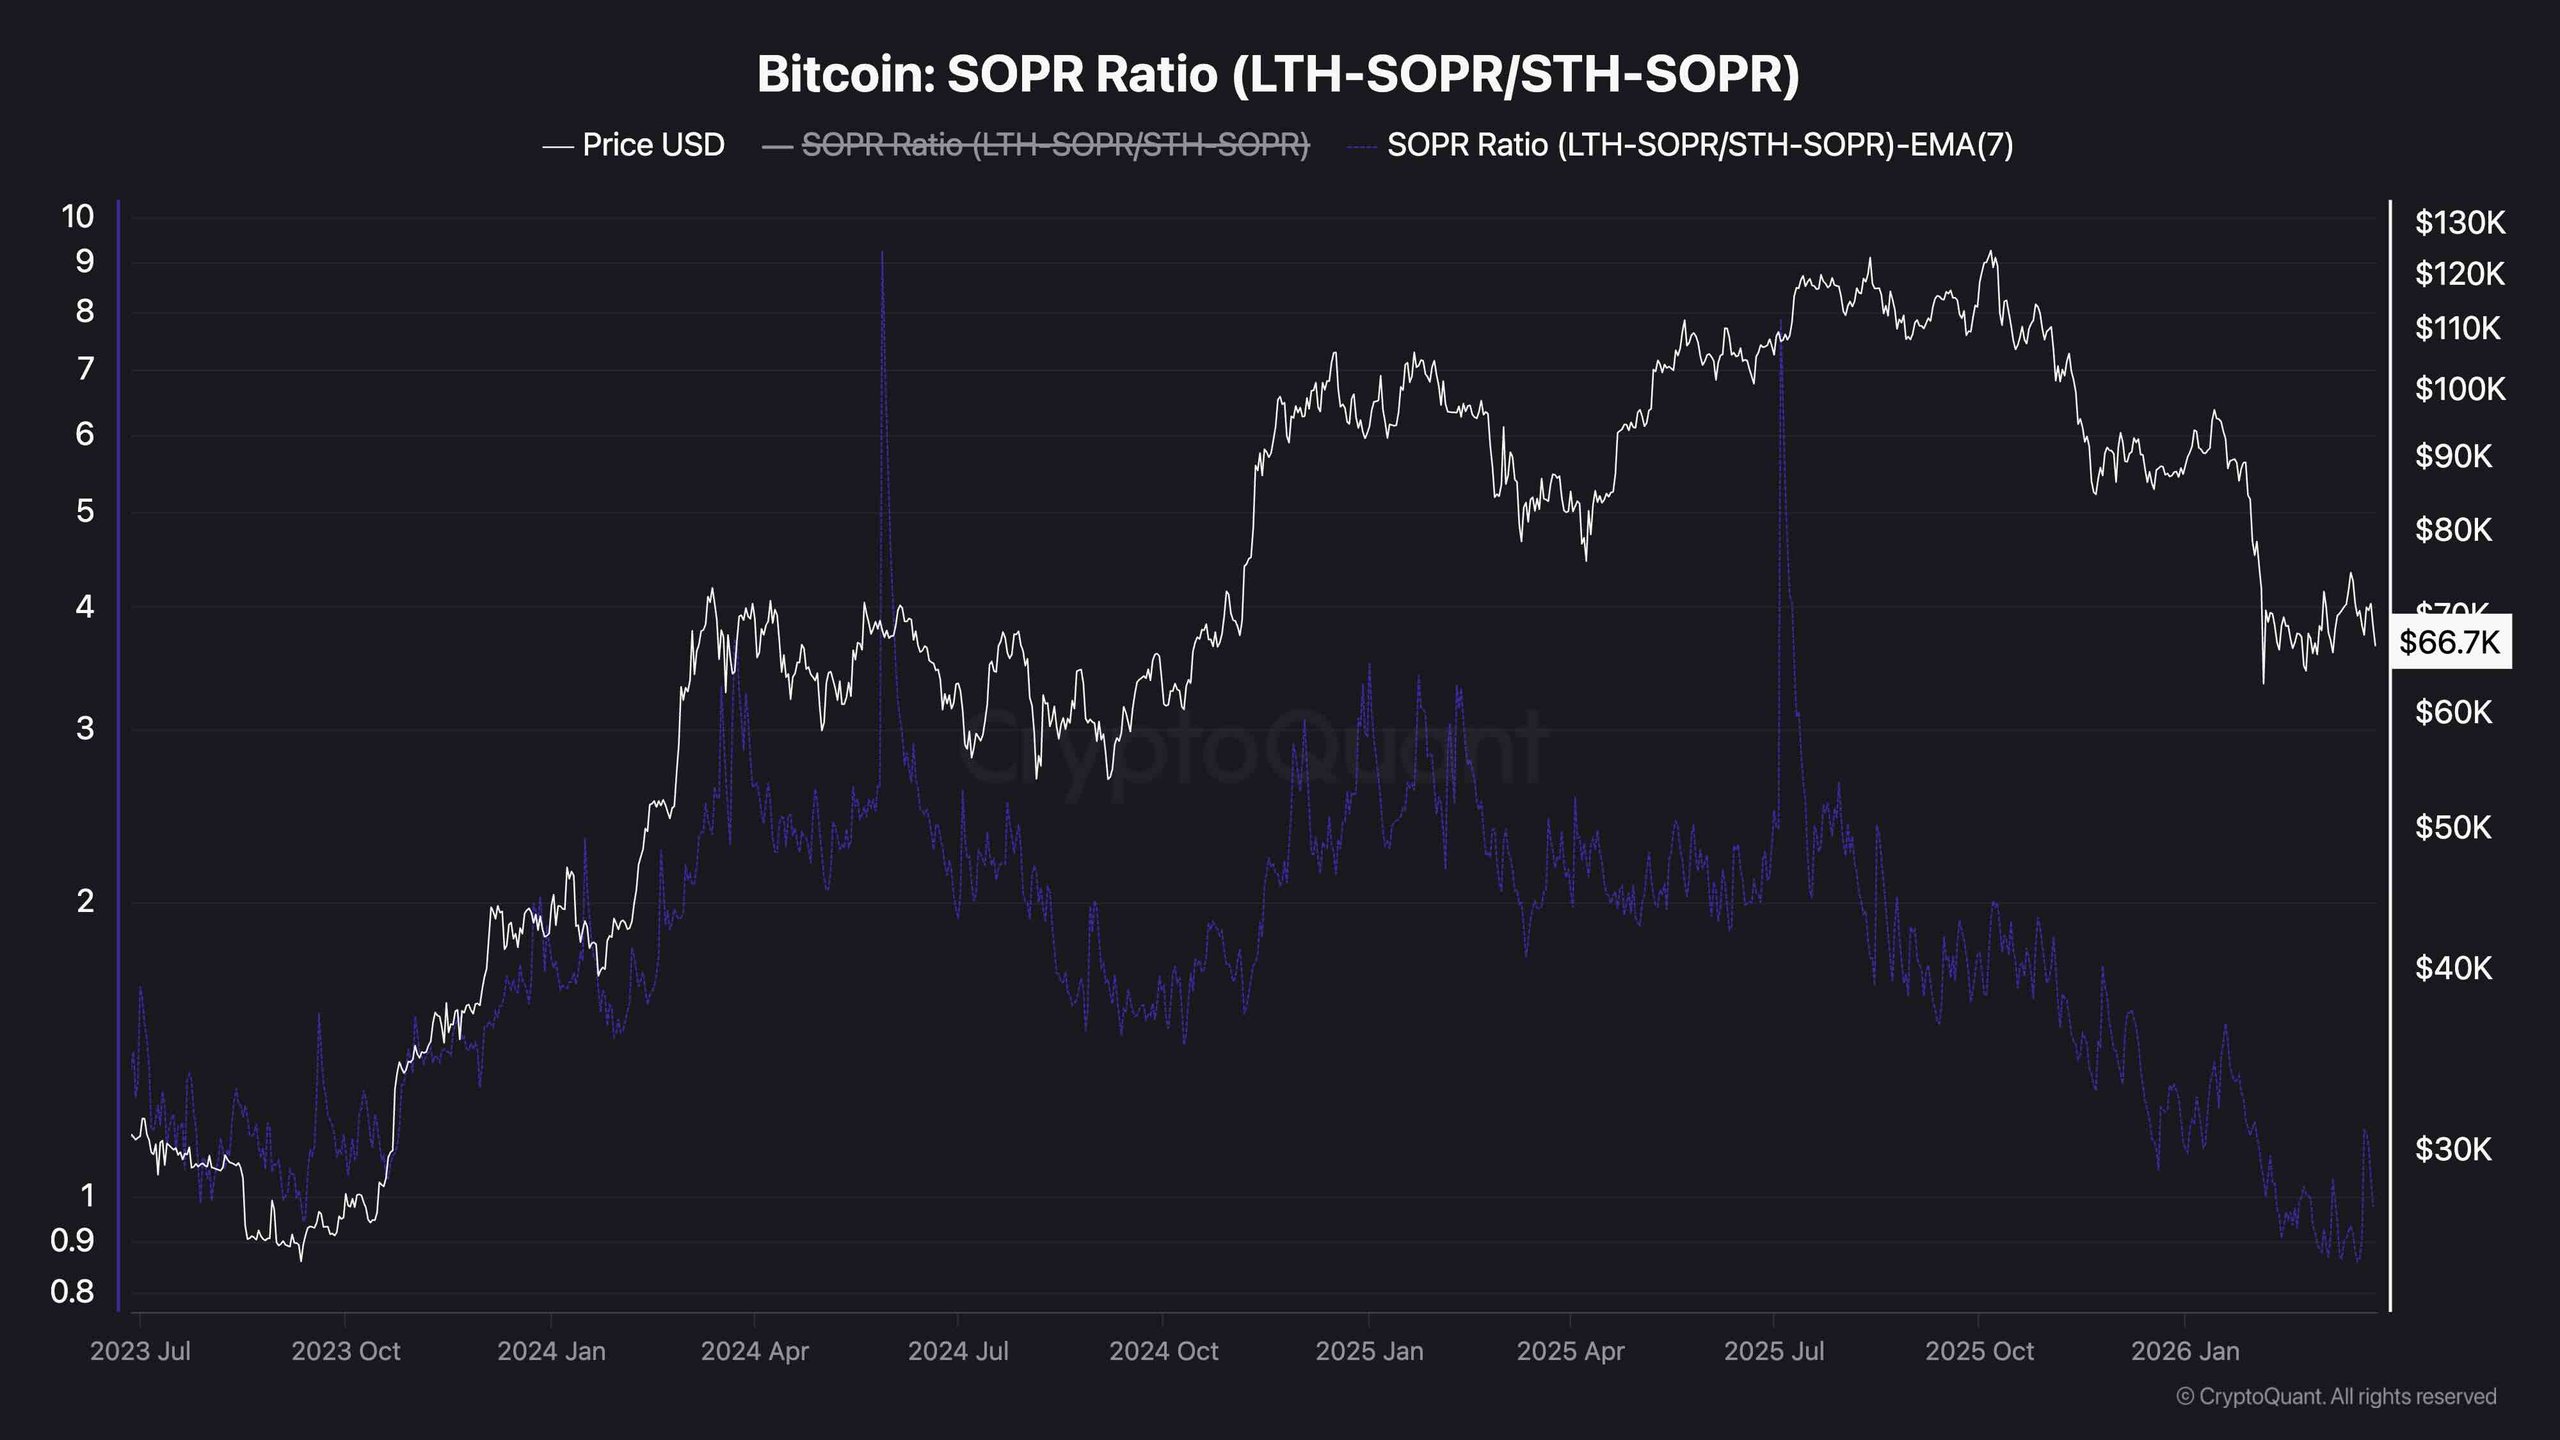 SOPR Ratio
Disclaimer: Information provided is based on analytics and does not constitute investment advice. Conduct your own research before engaging in crypto investments.
