Ethereum Price Analysis: What Must ETH Achieve to Exit Its Current Standoff?
A comprehensive look at Ethereum's price movements, exploring key resistance and support levels as the market readies for a crucial breakout.


Ethereum began trading for Q2 2026 above $2,100, remaining significantly under the values necessary for a clear upward trend. Following a challenging first quarter that saw a sharp drop of approximately 30% from late 2025 highs, the pivotal question for this quarter is whether Ethereum can establish a stable foundation or if the selling pressure will continue to increase.
Ethereum Price Evaluation: Daily Chart
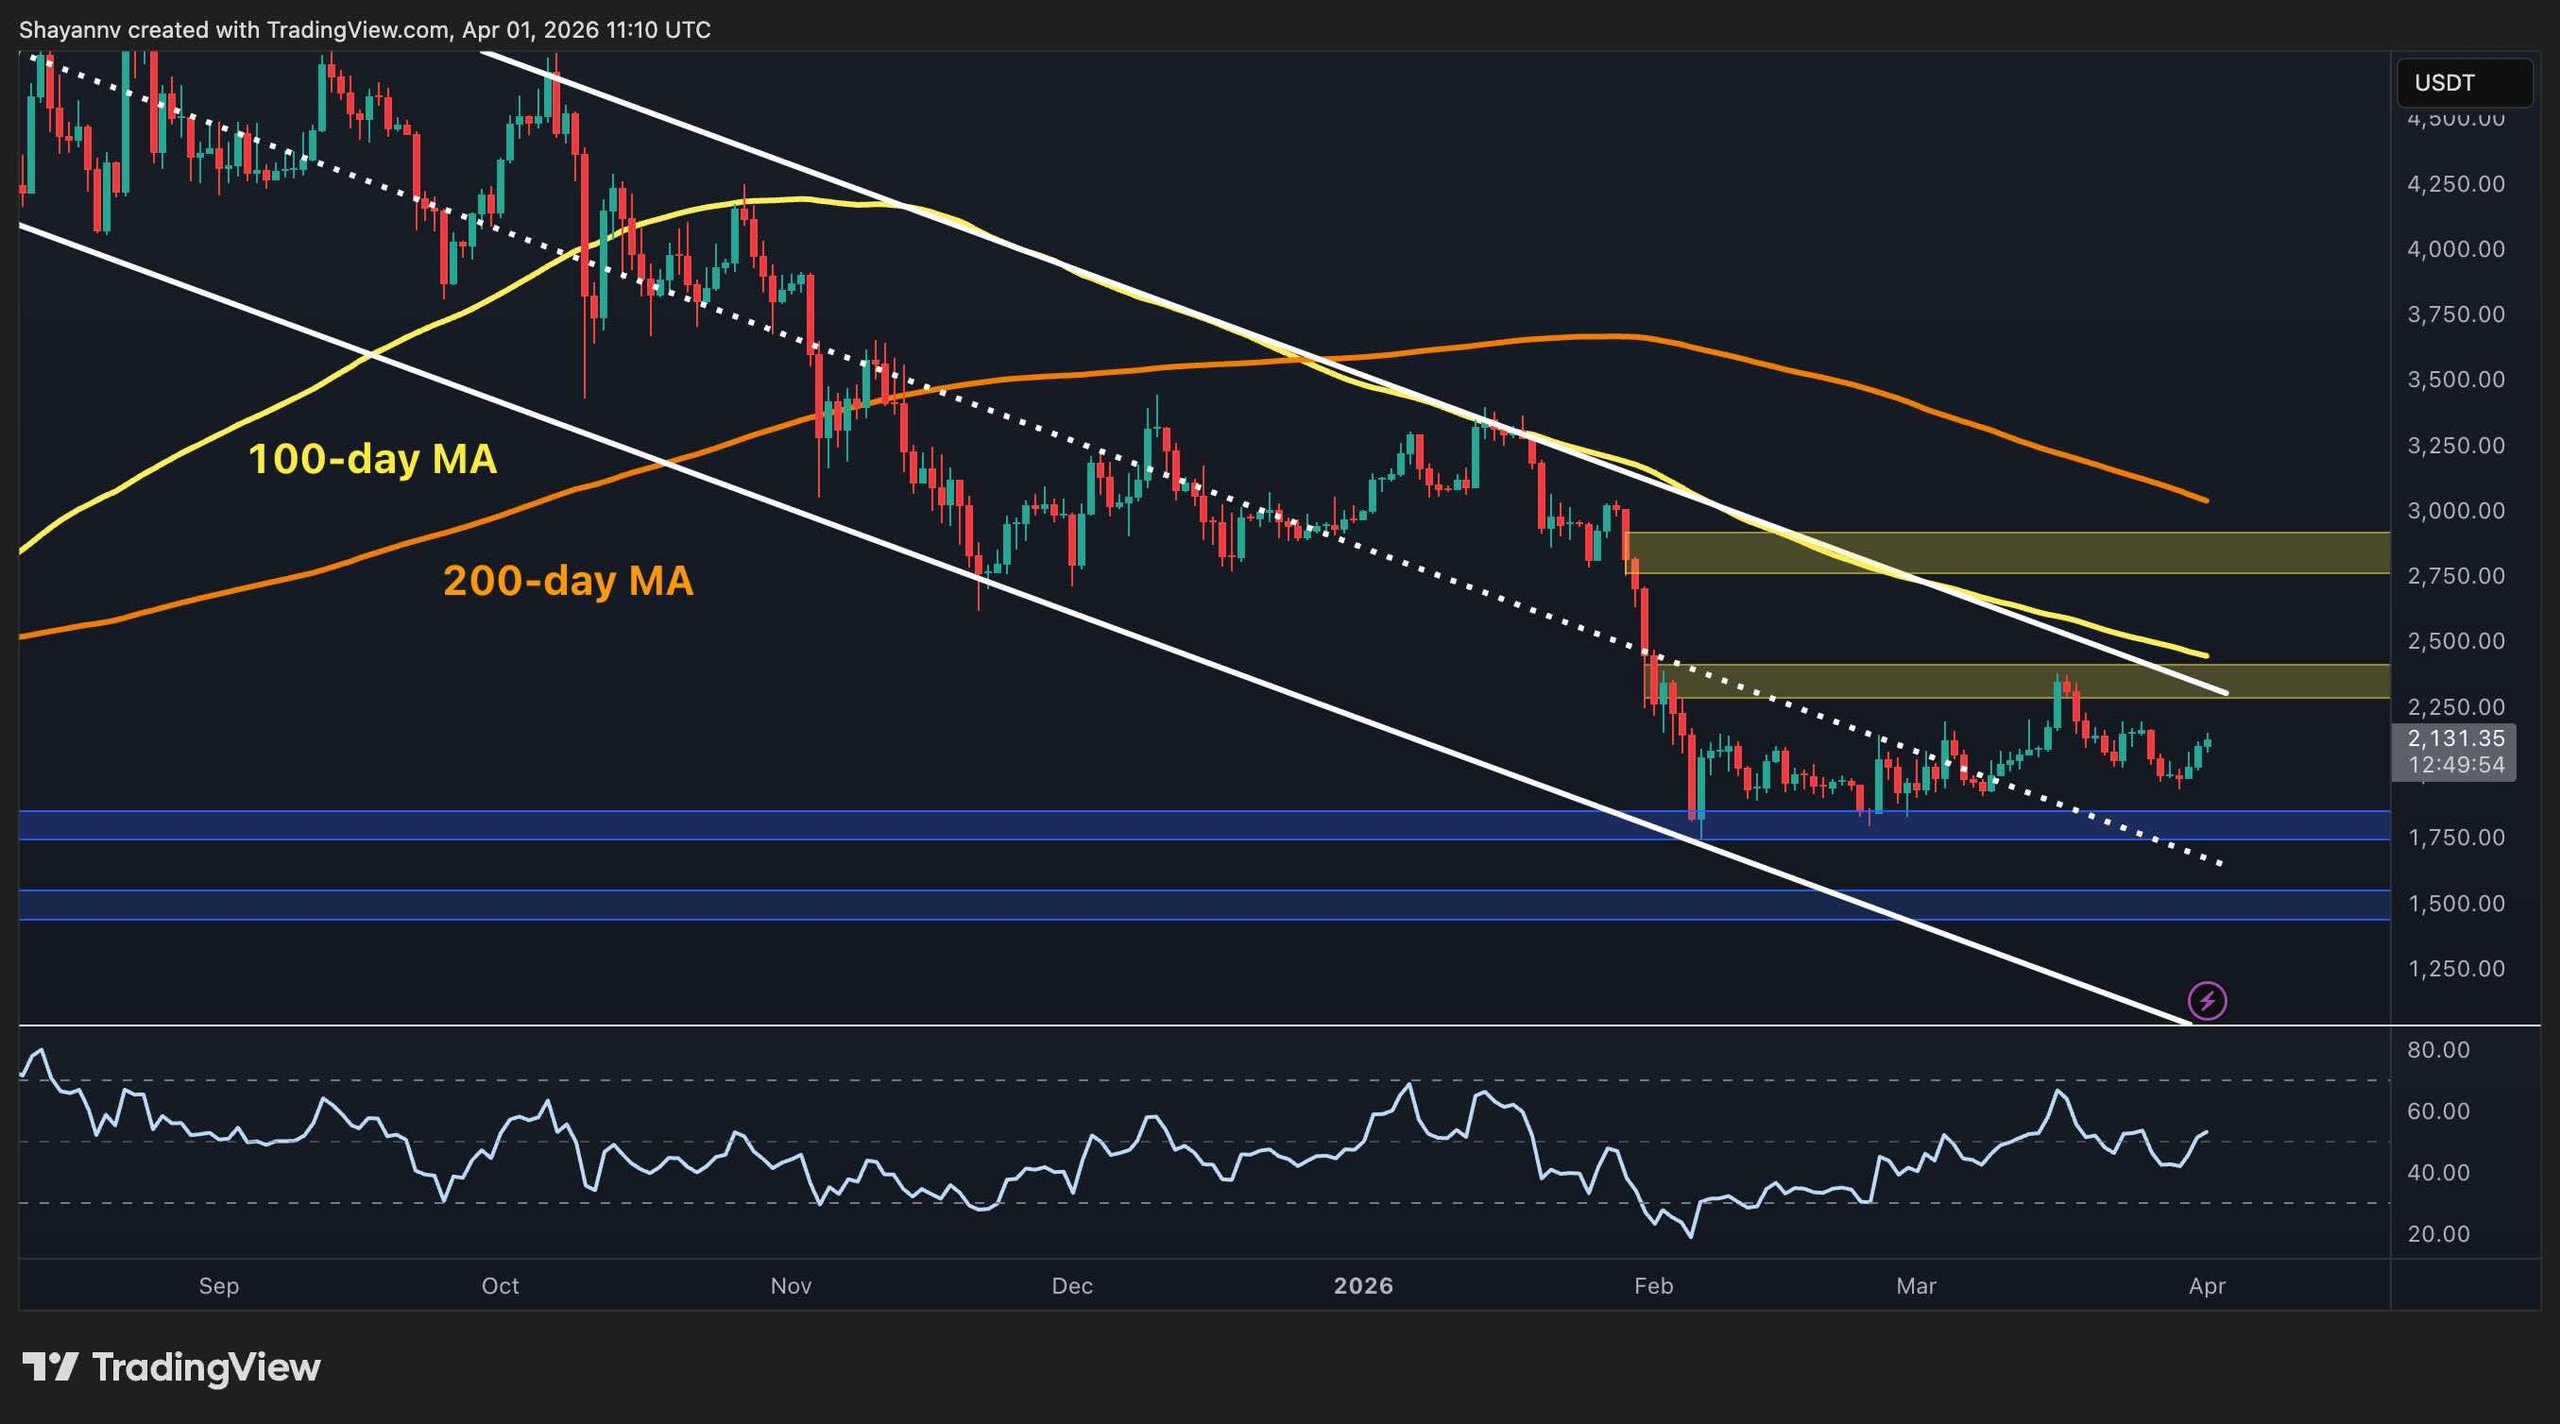
The descending channel in the daily chart remains unbroken as April approaches. Ethereum continues to record lower highs beneath a declining 100-day moving average (approx. $2,400) and a 200-day MA (around $3,000). The resistance zone around $2,400 has effectively rejected Ethereum, establishing this area as a crucial threshold to surpass before considering any bullish outlook.
The critical support lies at $1,800, which withstood tests during a February downturn without closing below it. The next significant level after that is $1,500.
Additionally, the Relative Strength Index (RSI) is stabilizing around mid-50s, indicating some recovering momentum, though not sufficient to alter the broader trend yet. Thus, a consistent daily closing above $2,400 remains essential for any bullish case.
Ethereum Daily Chart
ETH/USDT 4-Hour Chart
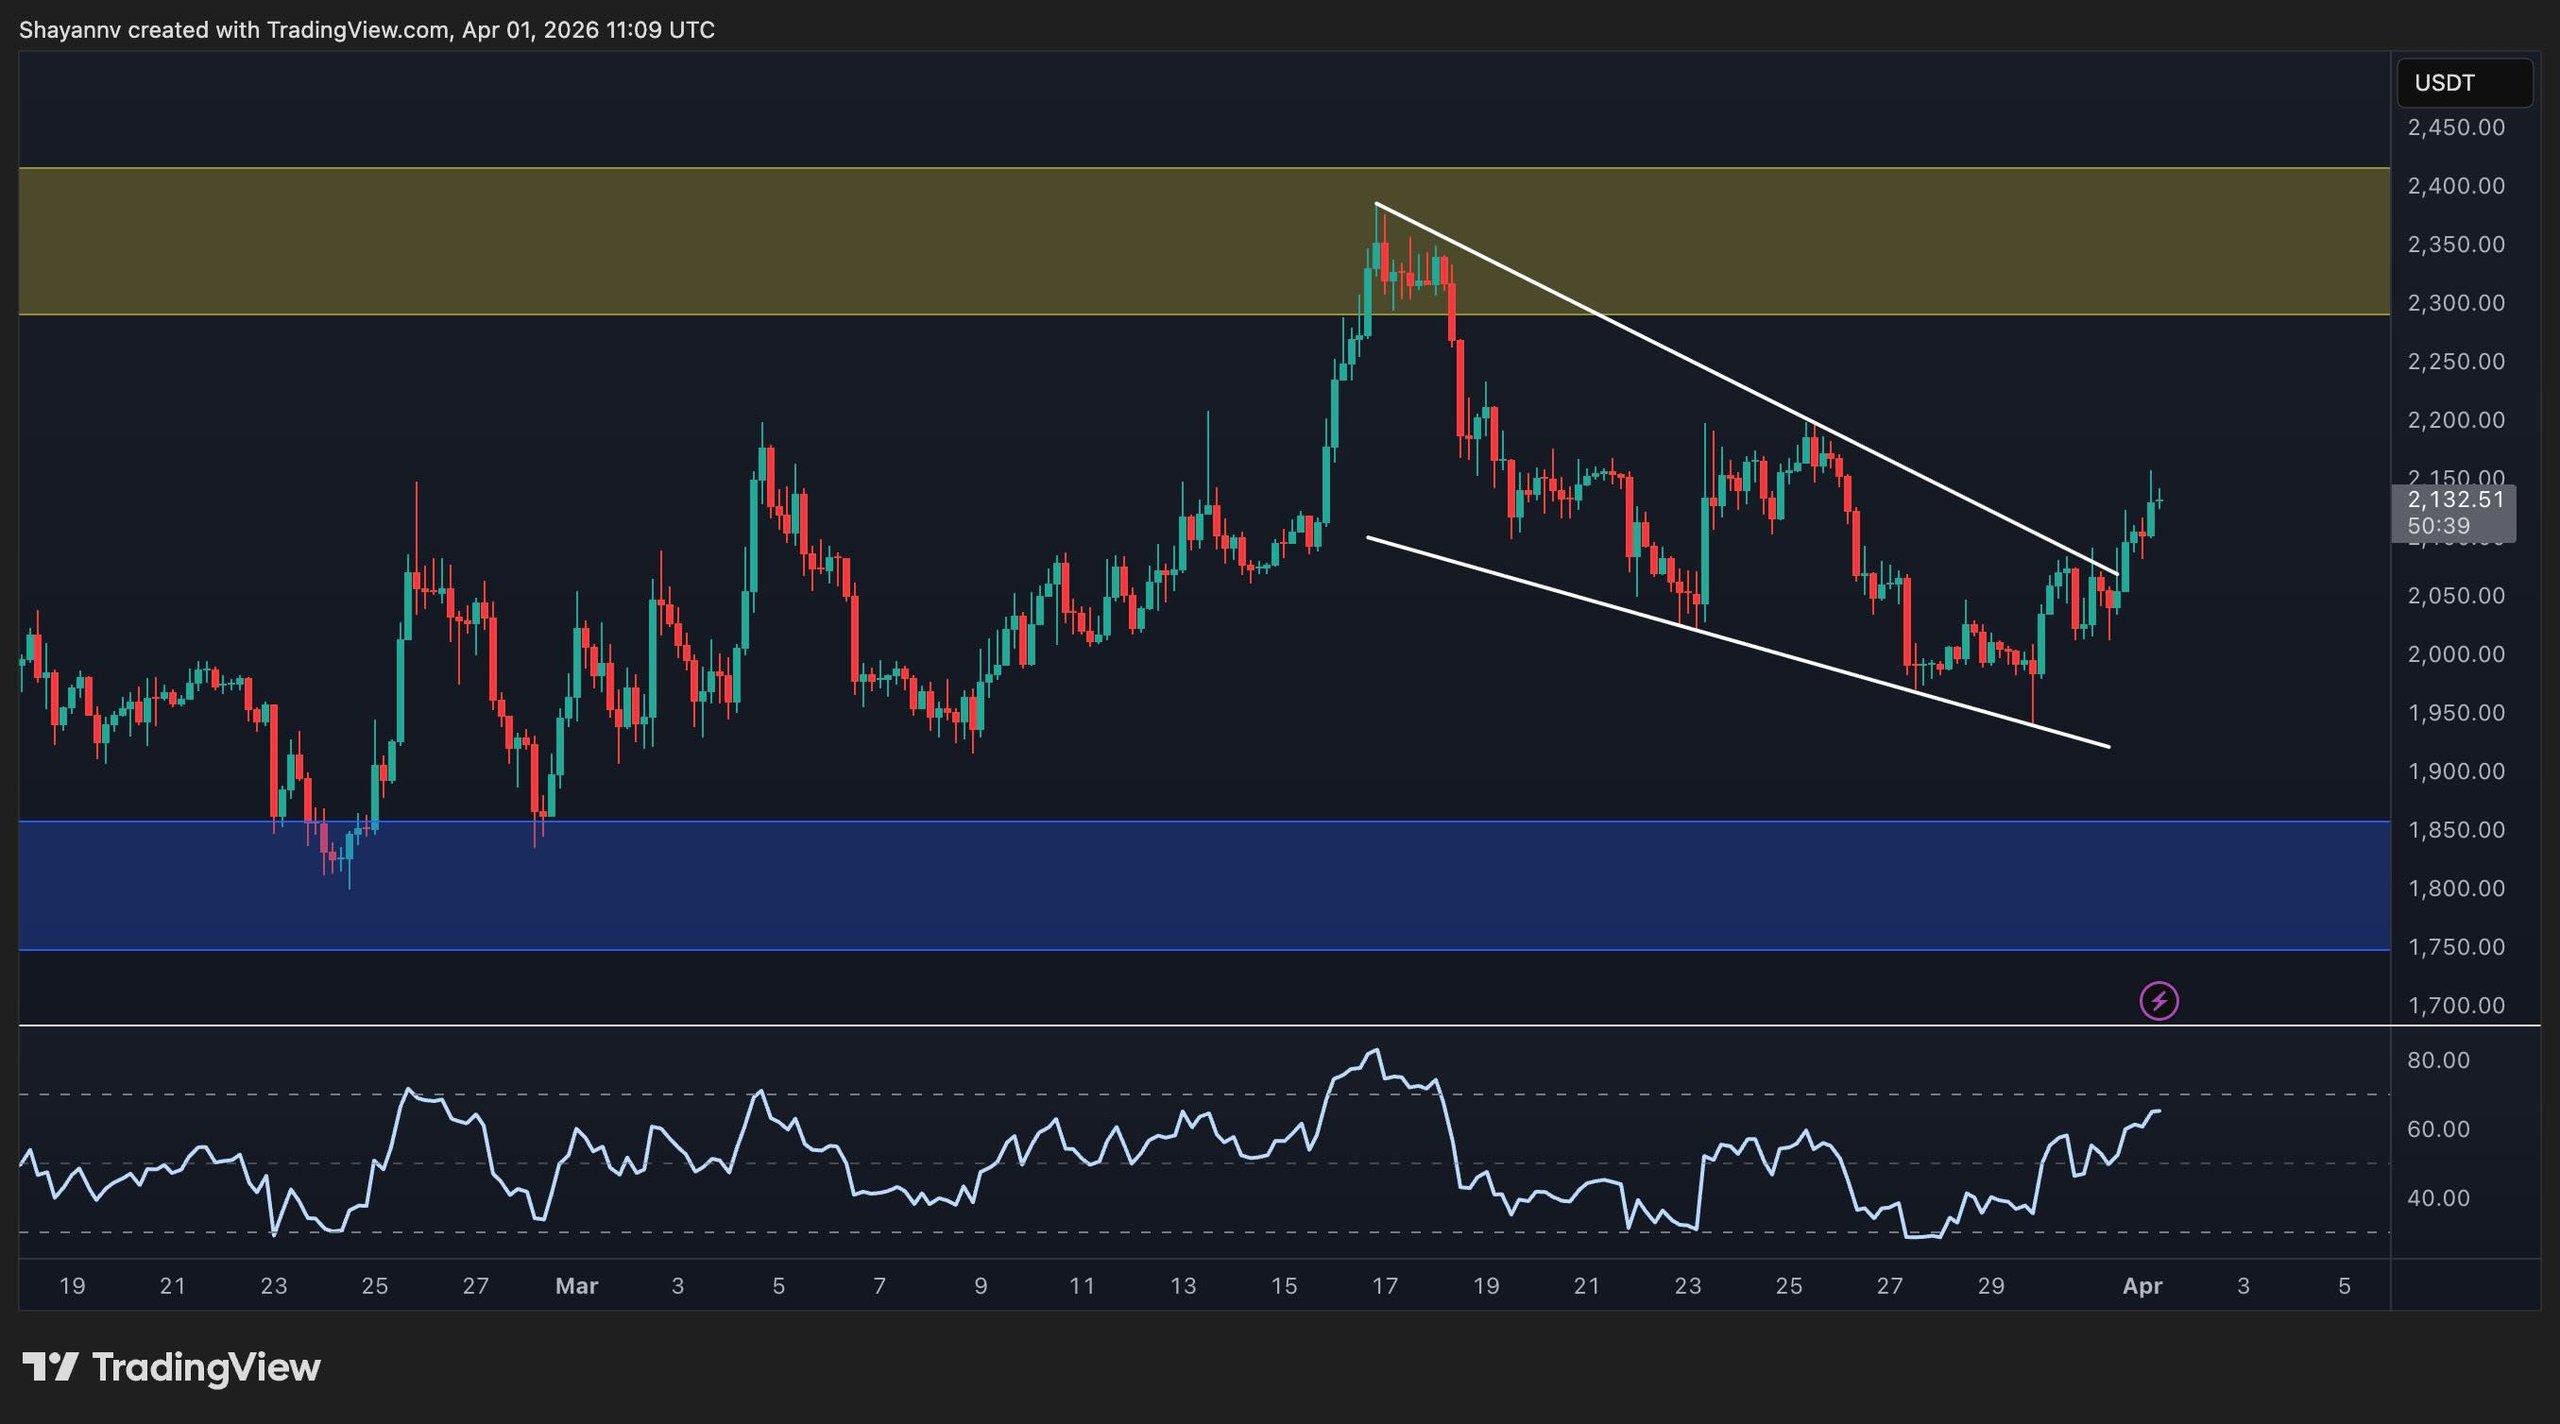
In a shorter timeframe, Ethereum has experienced price movements within a falling wedge pattern since the mid-March rejection at $2,400. Currently, it trades above $2,100 after surmounting the upper boundary of this pattern in recent days. The RSI has surged into the low 70s, signaling a potential short-term rise.
This RSI reading warrants close observation, as it suggests a likely retest of the $2,300-$2,400 resistance area, which has previously rejected Ethereum. A decisive breakthrough above this level would signal a positive mid-term outlook. Conversely, a failure to maintain bullish momentum could see the market retract towards the vital support surrounding $1,800 once again.
 Ethereum 4H Chart
On-Chain Insights
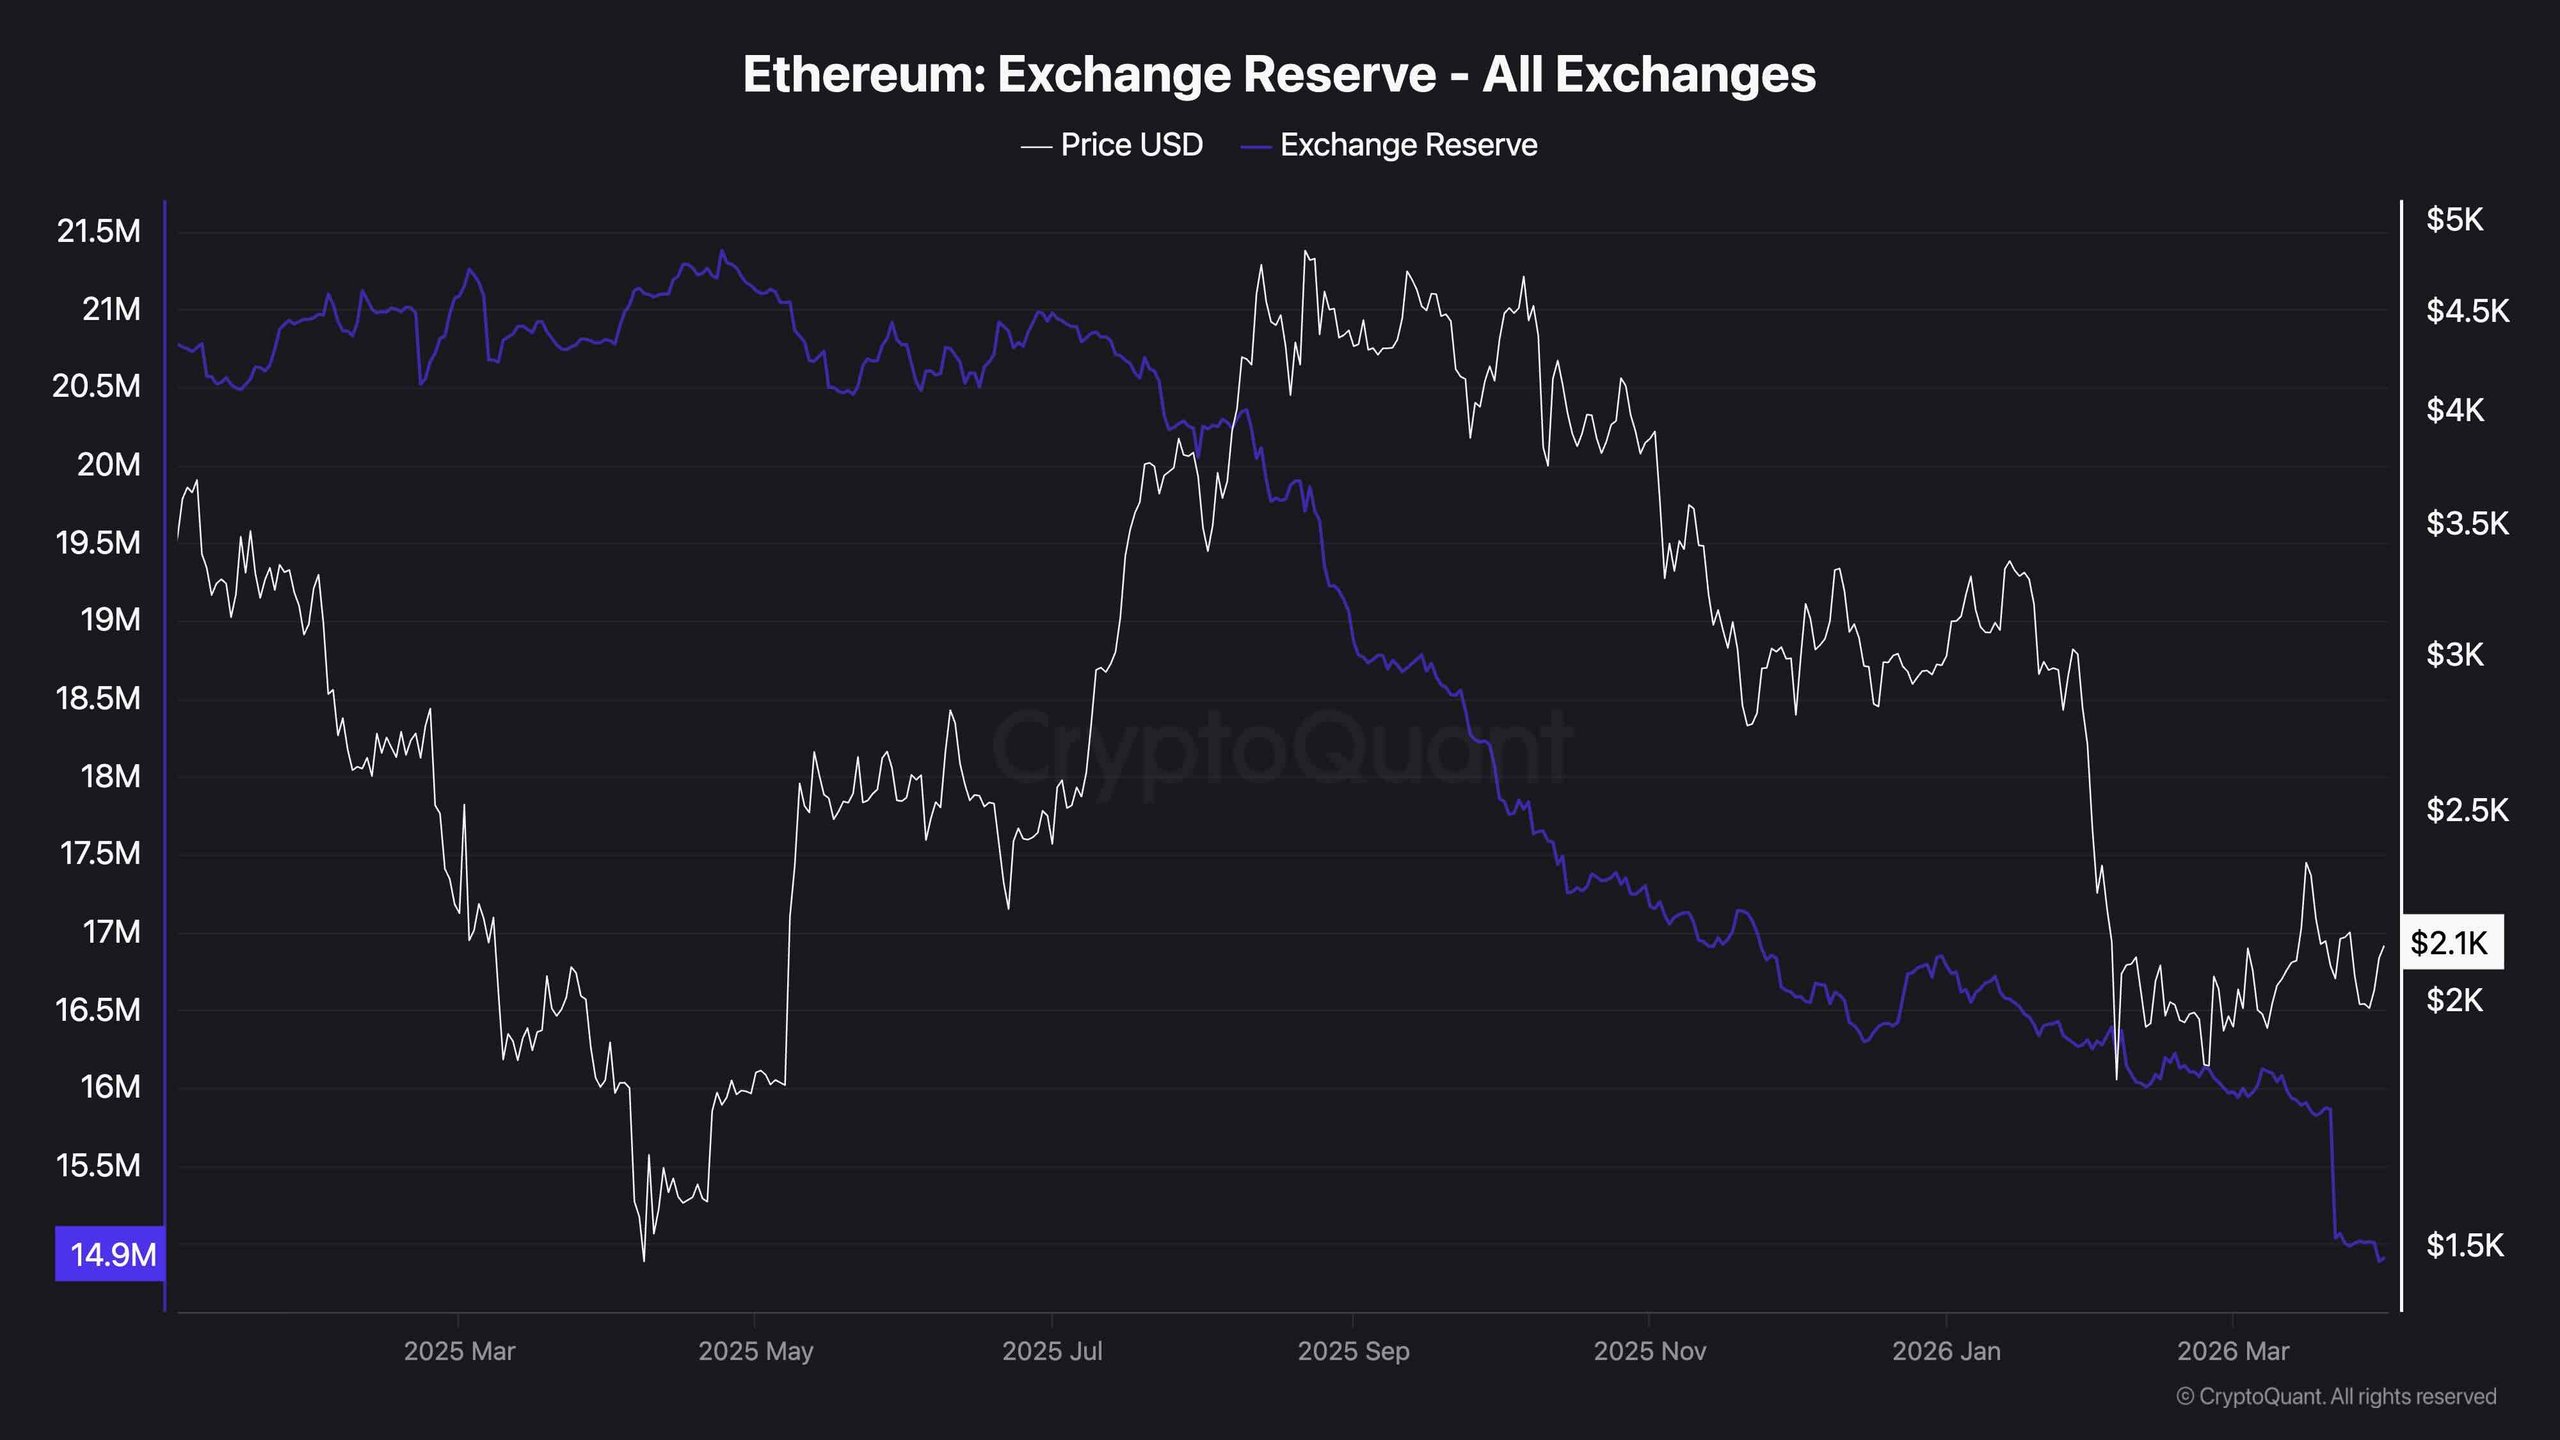
Ethereum’s exchange reserve now sits at approximately 14.9 million ETH, the lowest level seen in the past year, marking a continuing decline that picked up pace throughout late 2025 and into 2026. This represents a significant drop from mid-2025 levels near 21 million ETH and reflects a steady trend of holders extracting ETH from exchanges for self-custody.
Similar to Bitcoin, falling exchange reserves minimize available sell-side supply, fostering a beneficial structural outlook over the medium term. Nevertheless, the caveat applies here too: reserves have decreased in conjunction with prices rather than in anticipation of a recovery.
The supply-side situation is improving, yet without a noticeable increase in demand—which should manifest in reclaiming key price levels and an uptick in aggregate on-chain activity—these reserve figures should be interpreted as a quietly forming foundation rather than an immediate catalyst for price increases.
 Ethereum Exchange Reserve
Special Offer: Register a new account with Binance via this link to receive a $600 welcome bonus!
