XRP's Q2 Outlook: Lack of Bullish Signals as Price Holds Steady
An analysis of XRP's current trading position as the new quarter approaches, highlighting key resistance levels and market trends.


XRP is concluding the first quarter of 2026 priced at approximately $1.30, remaining at its lowest point over recent years. This altcoin has drastically lost its gains from the previous cycle peak and continues to struggle against the US dollar and Bitcoin. Unfortunately, technical indicators show no signs of a reversal as we enter a new quarter.
Ripple Price Assessment: The USDT Pair
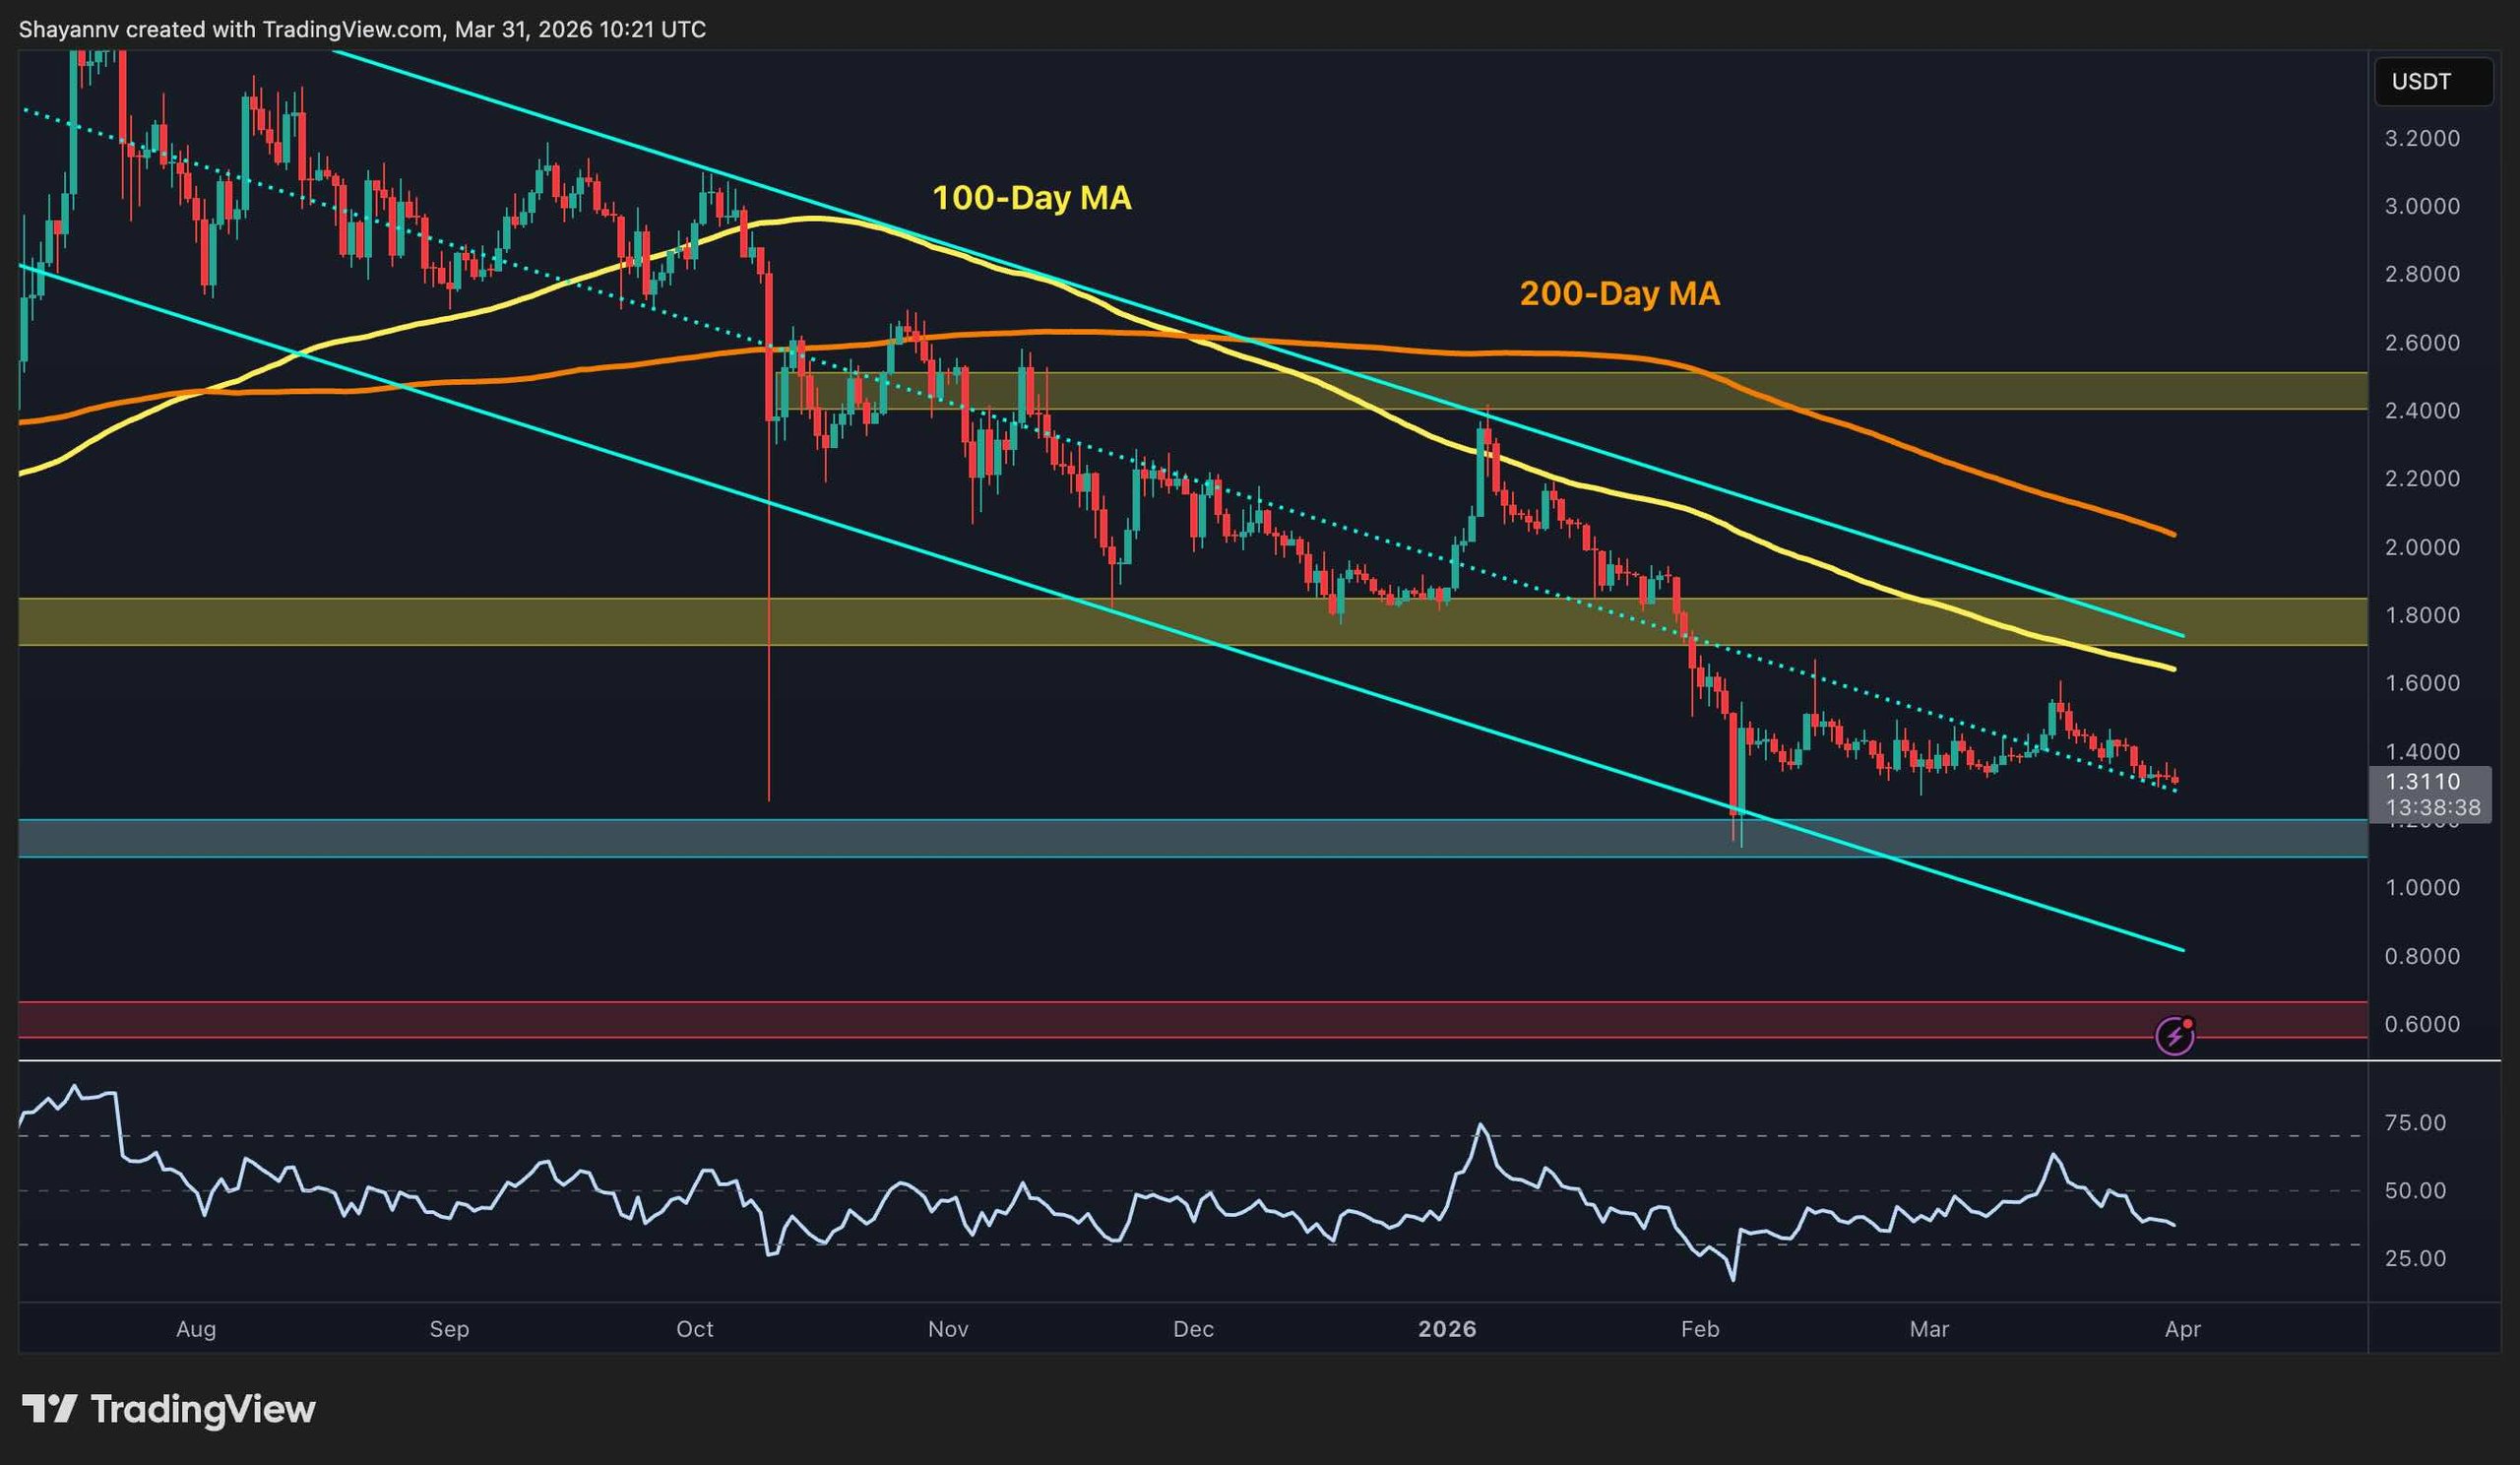
XRP has dipped below the $1.40 range which previously provided weak support in March, now trading nearer to $1.30. The market is perilously close to the February low of around $1.20. A significant descending channel remains in play, with the 100-day and 200-day moving averages (~$1.70 and ~$2.00, respectively) positioned well above the current price, adding substantial overhead resistance.
The crucial support zone around $1.20 was strong during February’s market pullback, but a confirmed break below this point could lead the price towards $1.00 and potentially down to $0.60 as illustrated in the analysis.
The RSI has also retraced back towards the low-30s after a short-lived recovery in mid-March, indicating a resurgence in bearish momentum. Therefore, without a regain of at least $1.80 on a reliable daily close, buyers may remain idle.
XRP to USDT Action
The BTC Pair
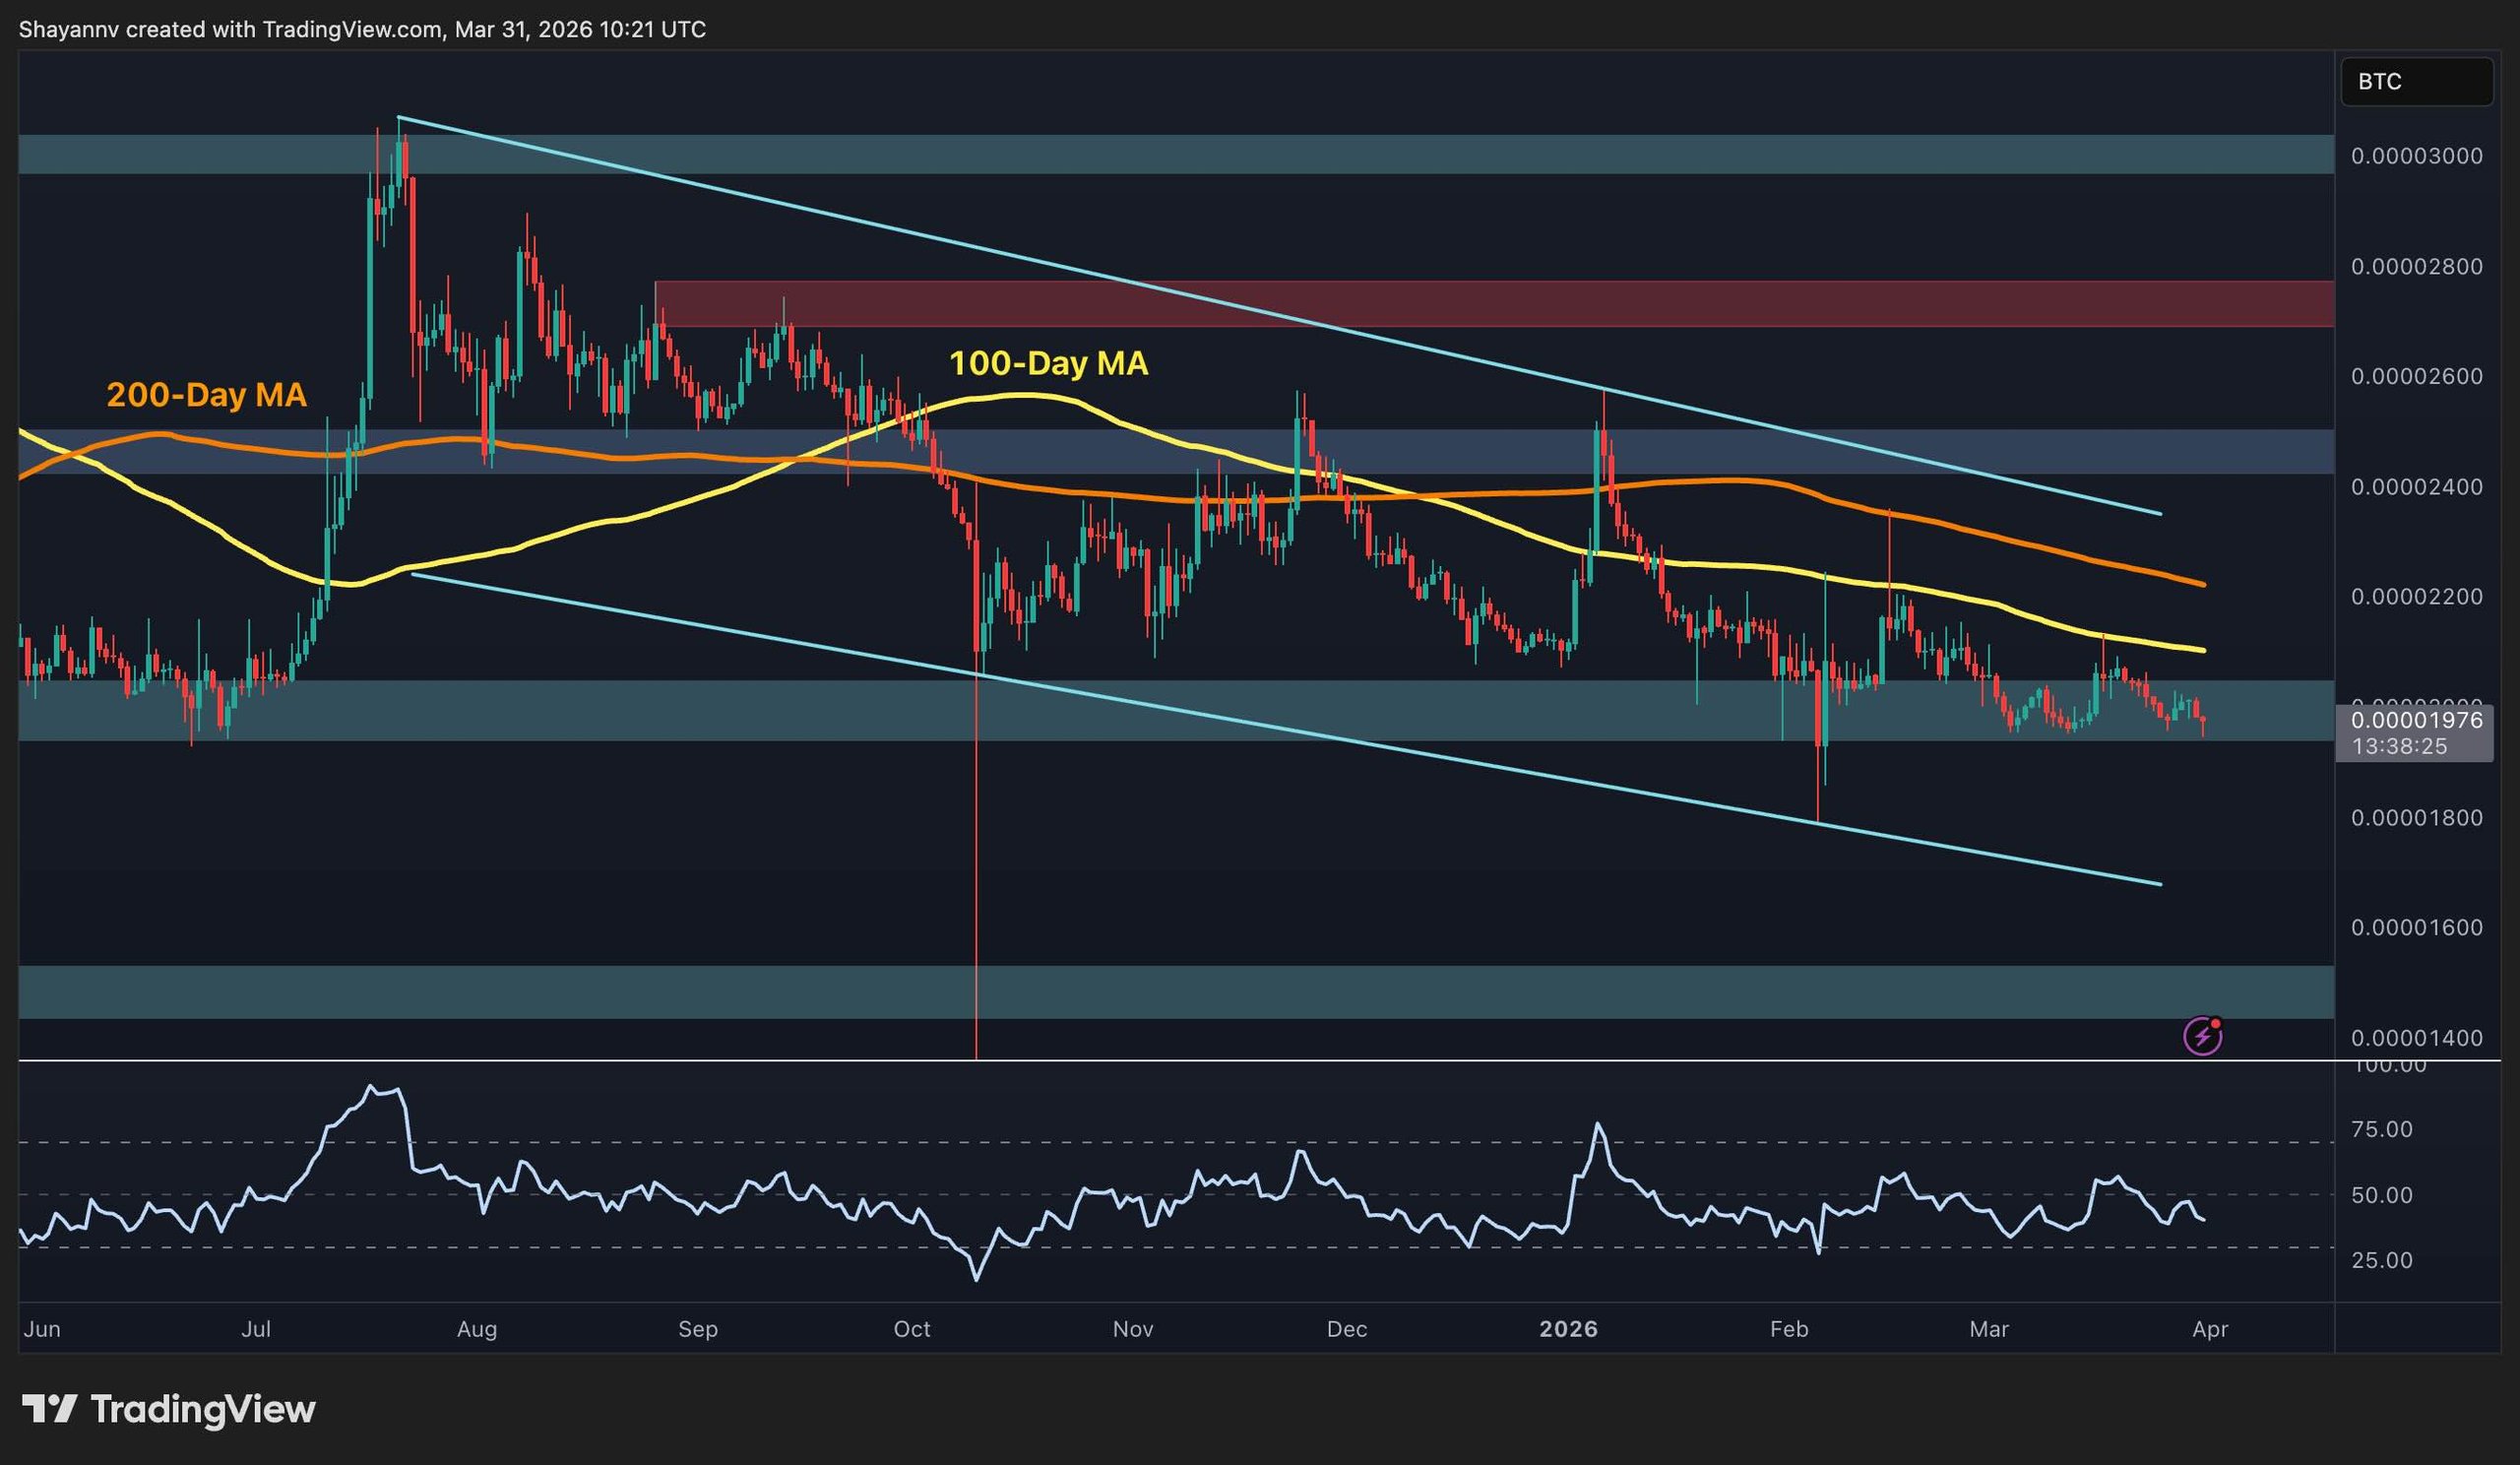
Action in the XRP/BTC pairing is similarly declining, currently at around 1,970 sats, having previously breached the 2,000 sats psychological support level. Should the price fail to stabilize and recover this area soon, it will confirm XRP’s continued decline relative to Bitcoin, which itself is hovering at multi-month lows.
With both moving averages trailing above and decreasing, and the 100-day and 200-day MAs converging near 2,100 sats and above the current price, the RSI presents no clear directional guidance.
Key support levels lie at the 1,800 sats range, alongside potential lower markers at 1,600 sats and the critical horizontal level at 1,500 sats as far deeper targets. These areas might soon activate if selling pressure intensifies into Q2 2026.
 XRP to BTC Analysis
Disclaimer
Information presented in this analysis reflects the views of the analysts referenced. It does not constitute financial advice or represent the position of the publication on whether to buy, sell, or hold any assets.
