Bitcoin Price Forecast: Structural Resilience May Propel BTC to $85K Soon
An analysis of Bitcoin's current market behavior and predictions for its price trajectory amid improved technical indicators.


Bitcoin Price Forecast: Structural Resilience May Propel BTC to $85K Soon
Bitcoin is currently trading at approximately $78,000, maintaining an upward trend as improving technical metrics and renewed geopolitical optimism attract new investors.
The extension of the US-Iran ceasefire acts as a significant risk-on catalyst, alleviating a major source of macroeconomic uncertainty that had burdened the markets and providing buyers with a favorable environment to breach crucial resistance levels.
Bitcoin Price Analysis: Daily Chart
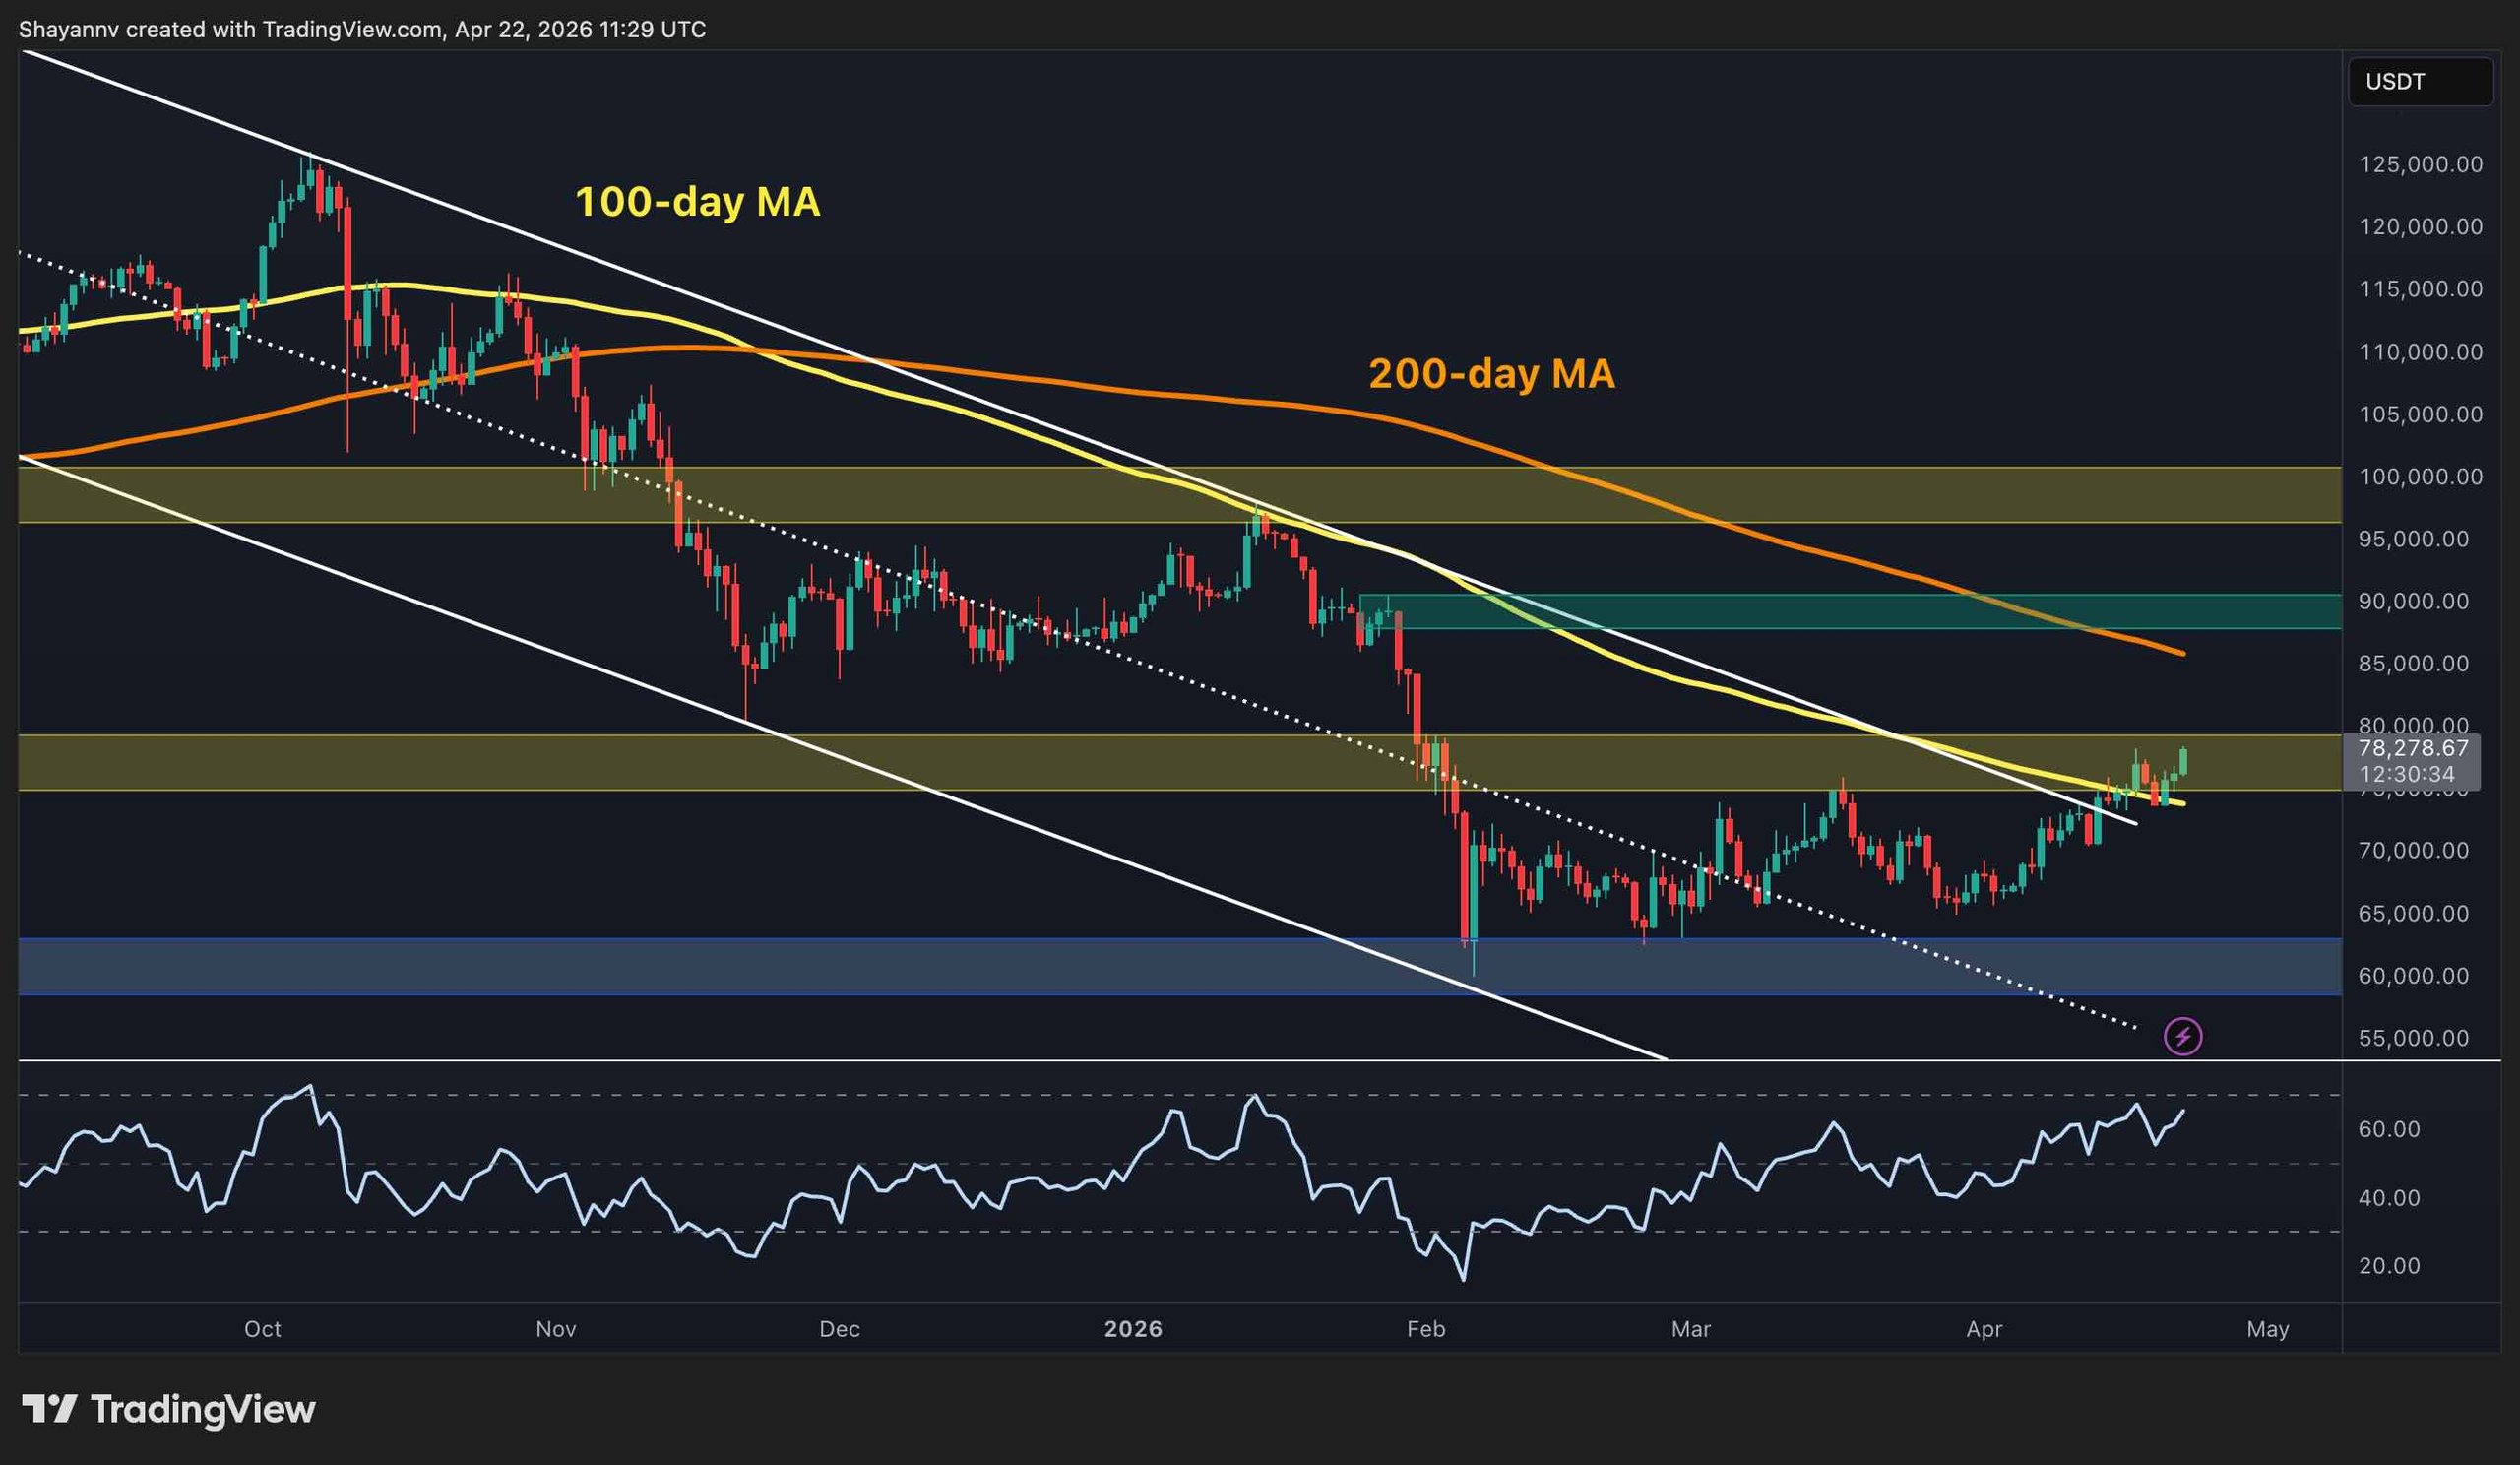
The daily chart presents a different narrative compared to just one week prior. BTC has decisively moved above a descending channel and surpassed the 100-day moving average (MA) around $75,000. It’s now advancing through the resistance band of $75,000–$80,000, with the Relative Strength Index (RSI) also increasing but not yet in overbought territory.
Importantly, this move distinguishes itself from previous attempts, as the price is not merely touching resistance and retracting; it steadily progresses through the supply zone, closing higher consistently.
The next significant challenge looms in the $85,000–$90,000 range, where the declining 200-day MA and a notable supply cluster intersect. A weekly finish above the $80,000 psychological threshold would signal a considerable structural development, indicating that the primary downtrend during this correction has effectively ended. Conversely, the old channel boundary and the 100-day MA near $75,000 are now the initial support levels to protect during any retreat.
Bitcoin Daily Chart
BTC/USDT Four-Hour Chart
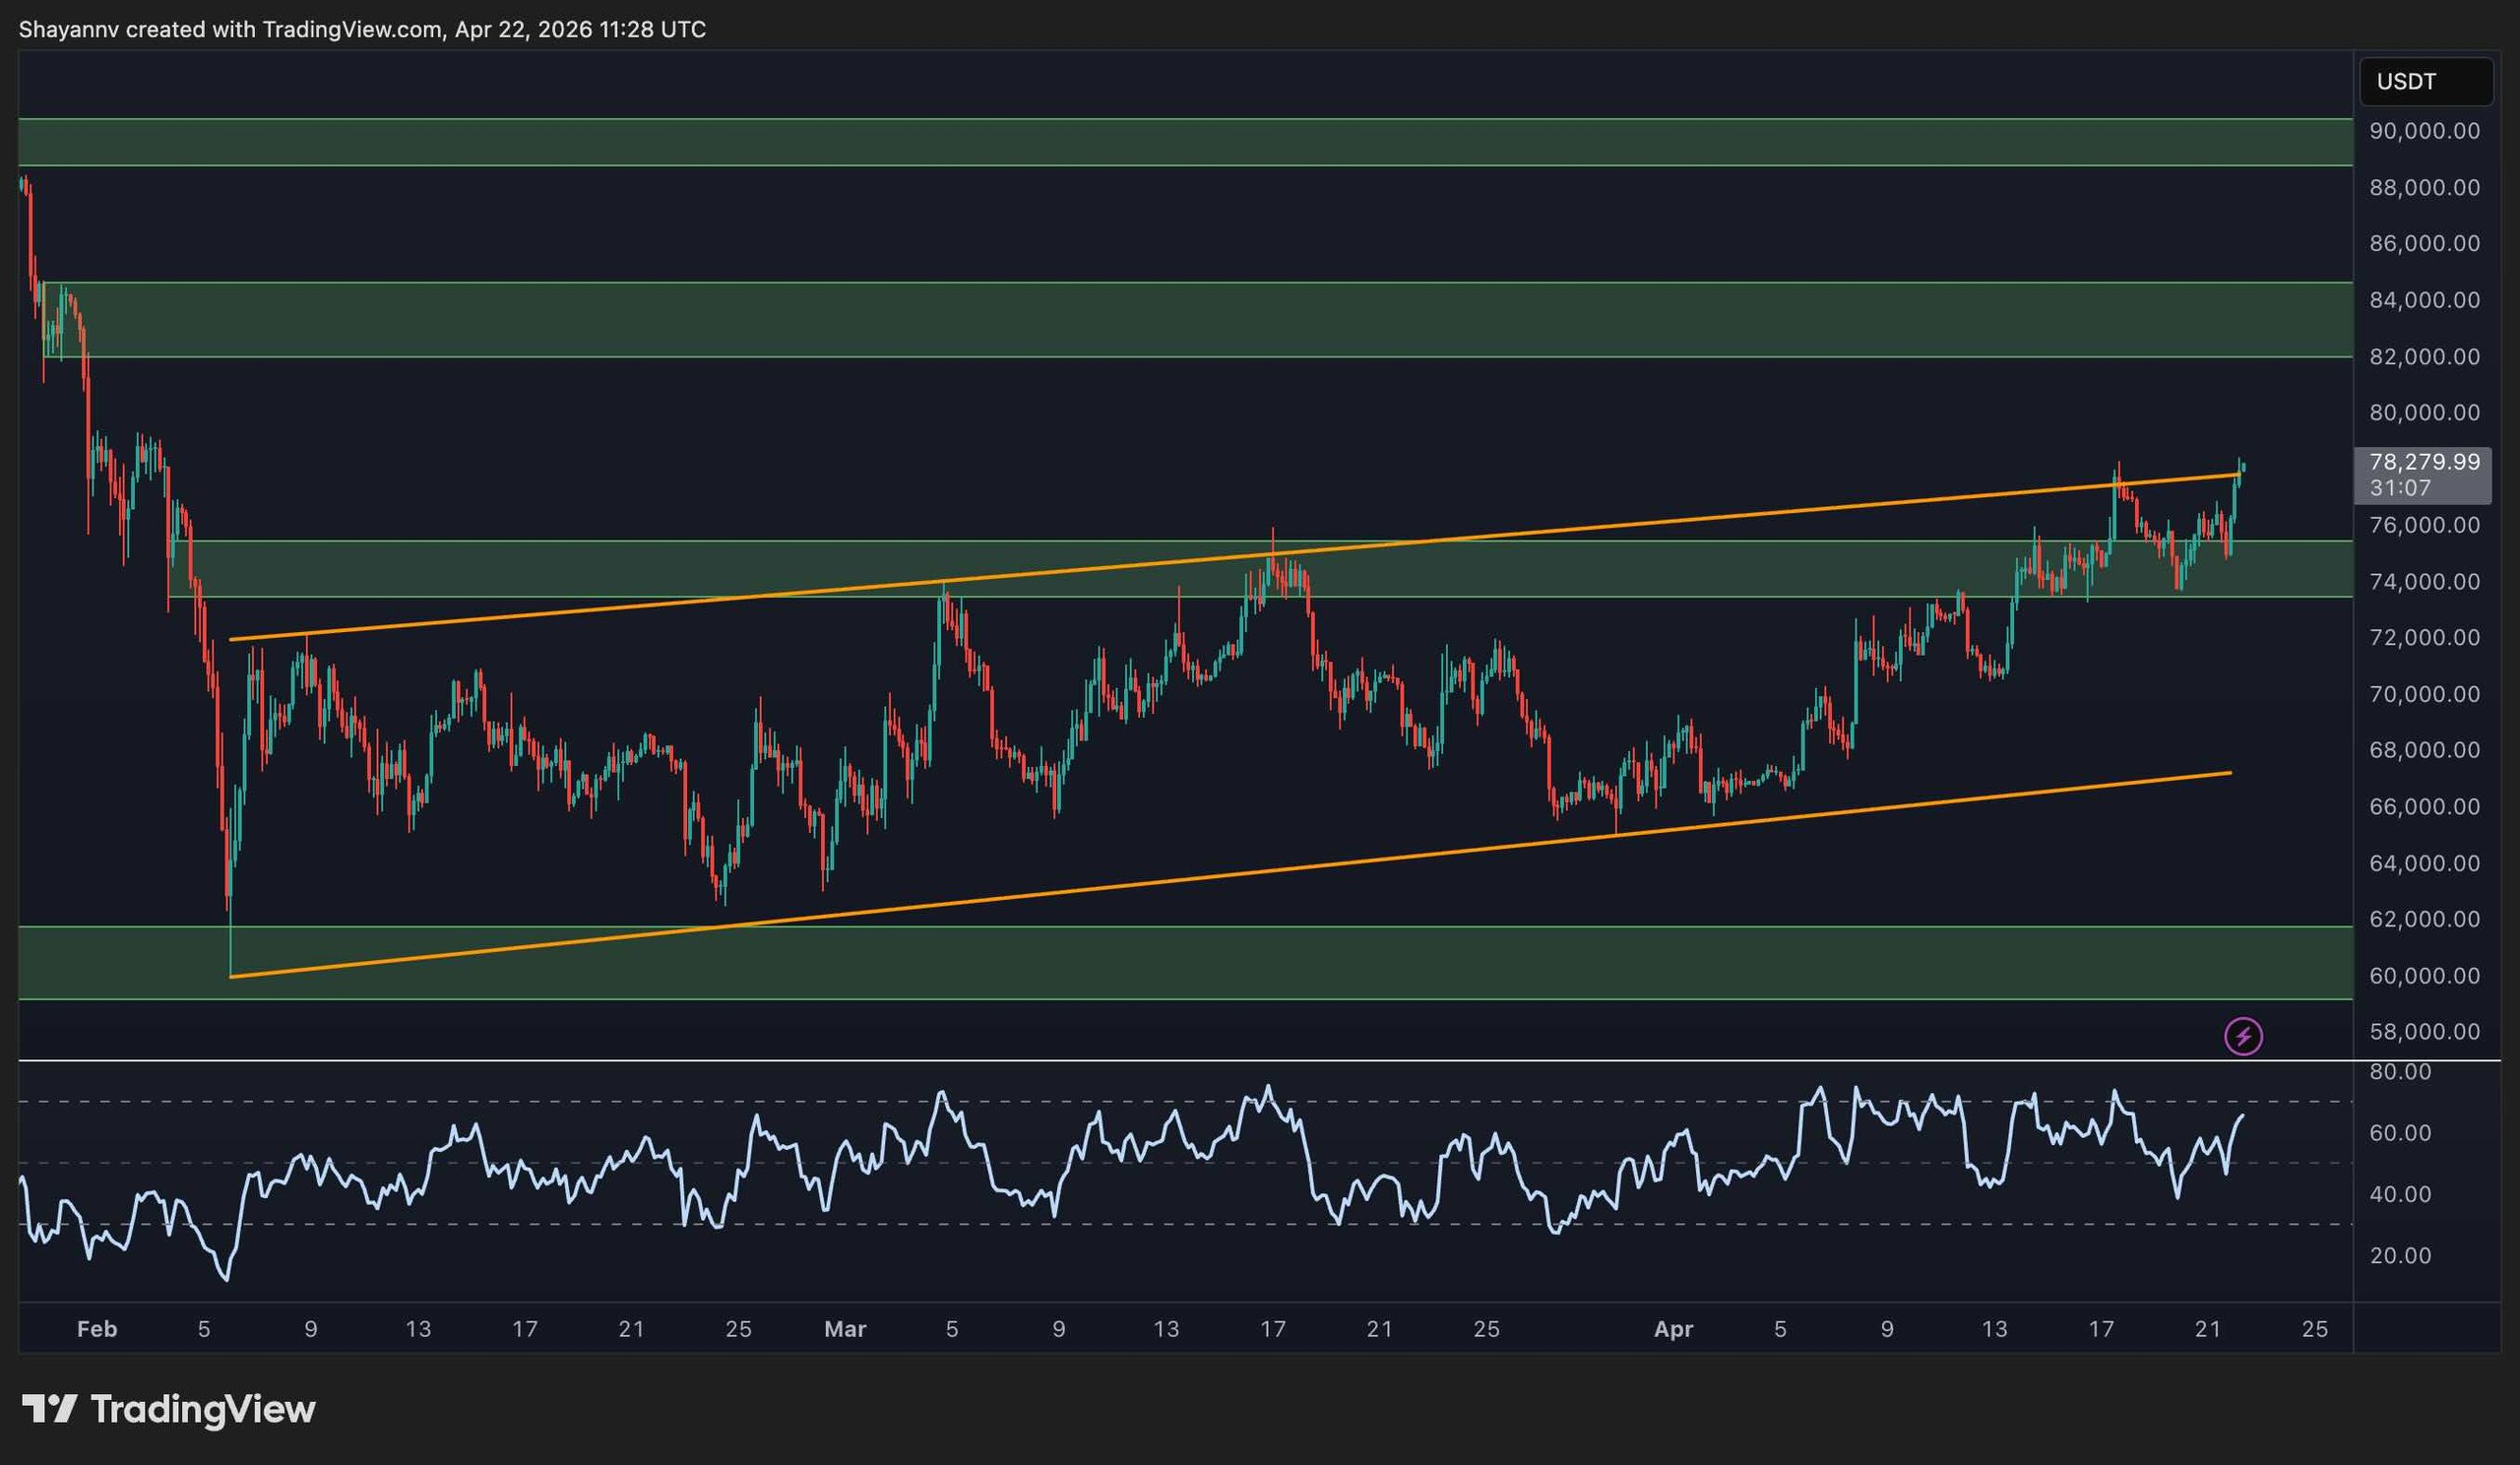
The ascending channel from our lows in February is struggling to offer a clear breakout upwards, as BTC challenges the upper boundary near $78,000. Unlike the mid-March efforts and last week’s unsuccessful breakout, this movement reflects tangible follow-through and momentum, supported by the upward trend in the RSI.
The $74,000–$76,000 range, encompassing the previous upper channel boundary and a crucial horizontal level, is the most vital zone to hold during any pullback on the four-hour chart. A successful retest of this area, followed by a rebound, would illustrate a textbook continuation pattern, strengthening the case for targeting the $80,000 mark, and potentially the $82,000-$84,000 bearish order block in the following weeks.
 BTC/USDT Four-Hour Chart
Sentiment Analysis
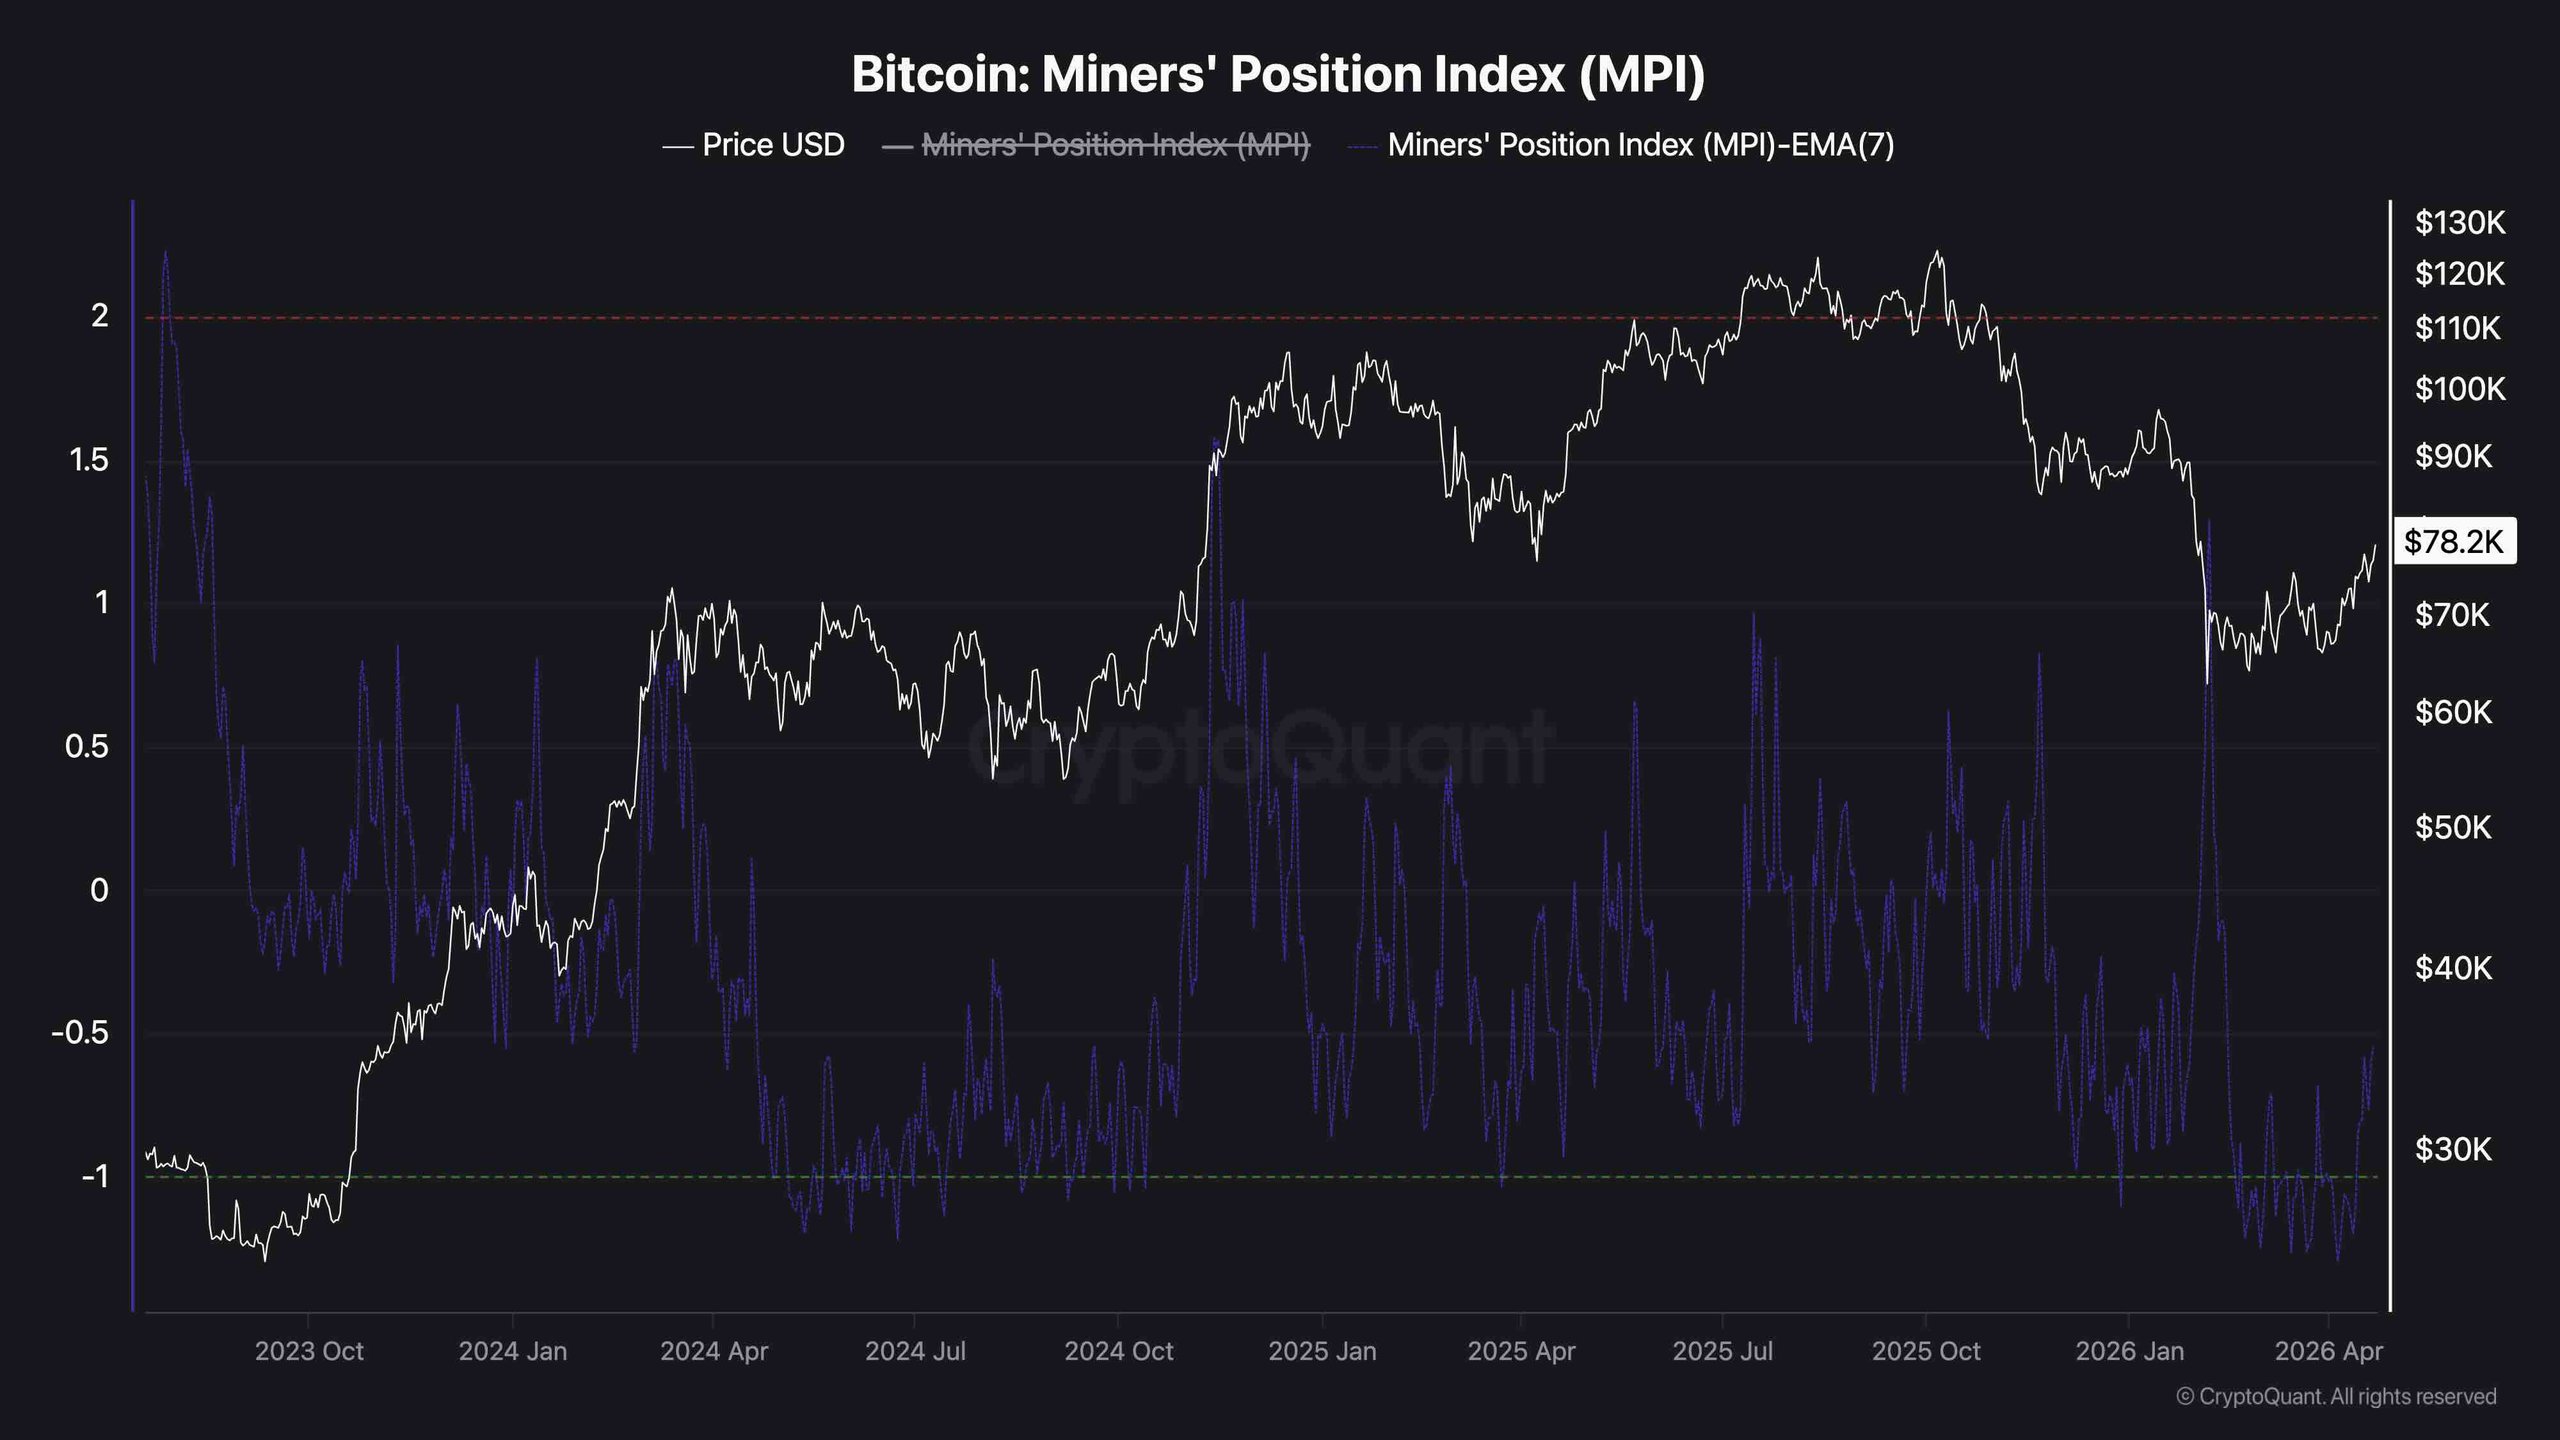
Currently, the Miners’ Position Index (MPI) is under zero on the 7-day Exponential Moving Average (EMA). It has recently bounced back from the green zone, which typically signifies periods of accumulation among miners rather than distribution. During the 2025 bull market, the MPI frequently surged past zero as miners heavily sold into strength. This tendency preceded local peaks consistently.
In contrast, today’s readings indicate a lack of urgency among miners to liquidate this rally. Unlike earlier cycles, when prices hovered between $110,000 and $125,000, and the MPI remained elevated as miners sold into demand, the current index reflects miners holding their assets instead of capitalizing on profits. This reduces a persistent source of selling pressure in the Bitcoin marketplace. With exchange reserves also at multi-year lows, the supply landscape appears considerably healthier heading into a possible rally towards $80,000 compared to similar price levels in past surges.
 Miners’ Position Index
Disclaimer: The information provided by CryptoPotato represents the viewpoints of the quoted authors and does not necessarily reflect CryptoPotato’s opinions. Always conduct your own research prior to making investment decisions.
