ETH Price Forecast: Surge to $2,500 Appears Close as Ethereum Rises 14% Monthly
Ethereum is trading around $2,350 and positioning itself for an upcoming breakout.


Ethereum is currently valued at around $2,350 and stands at a crucial juncture that could dictate its path in the coming weeks.
The cryptocurrency has been gaining traction throughout April, signaling potential for a strong bullish reversal. Though the trend has not fully materialized, various indicators across multiple timeframes suggest a growing bias toward buyers.
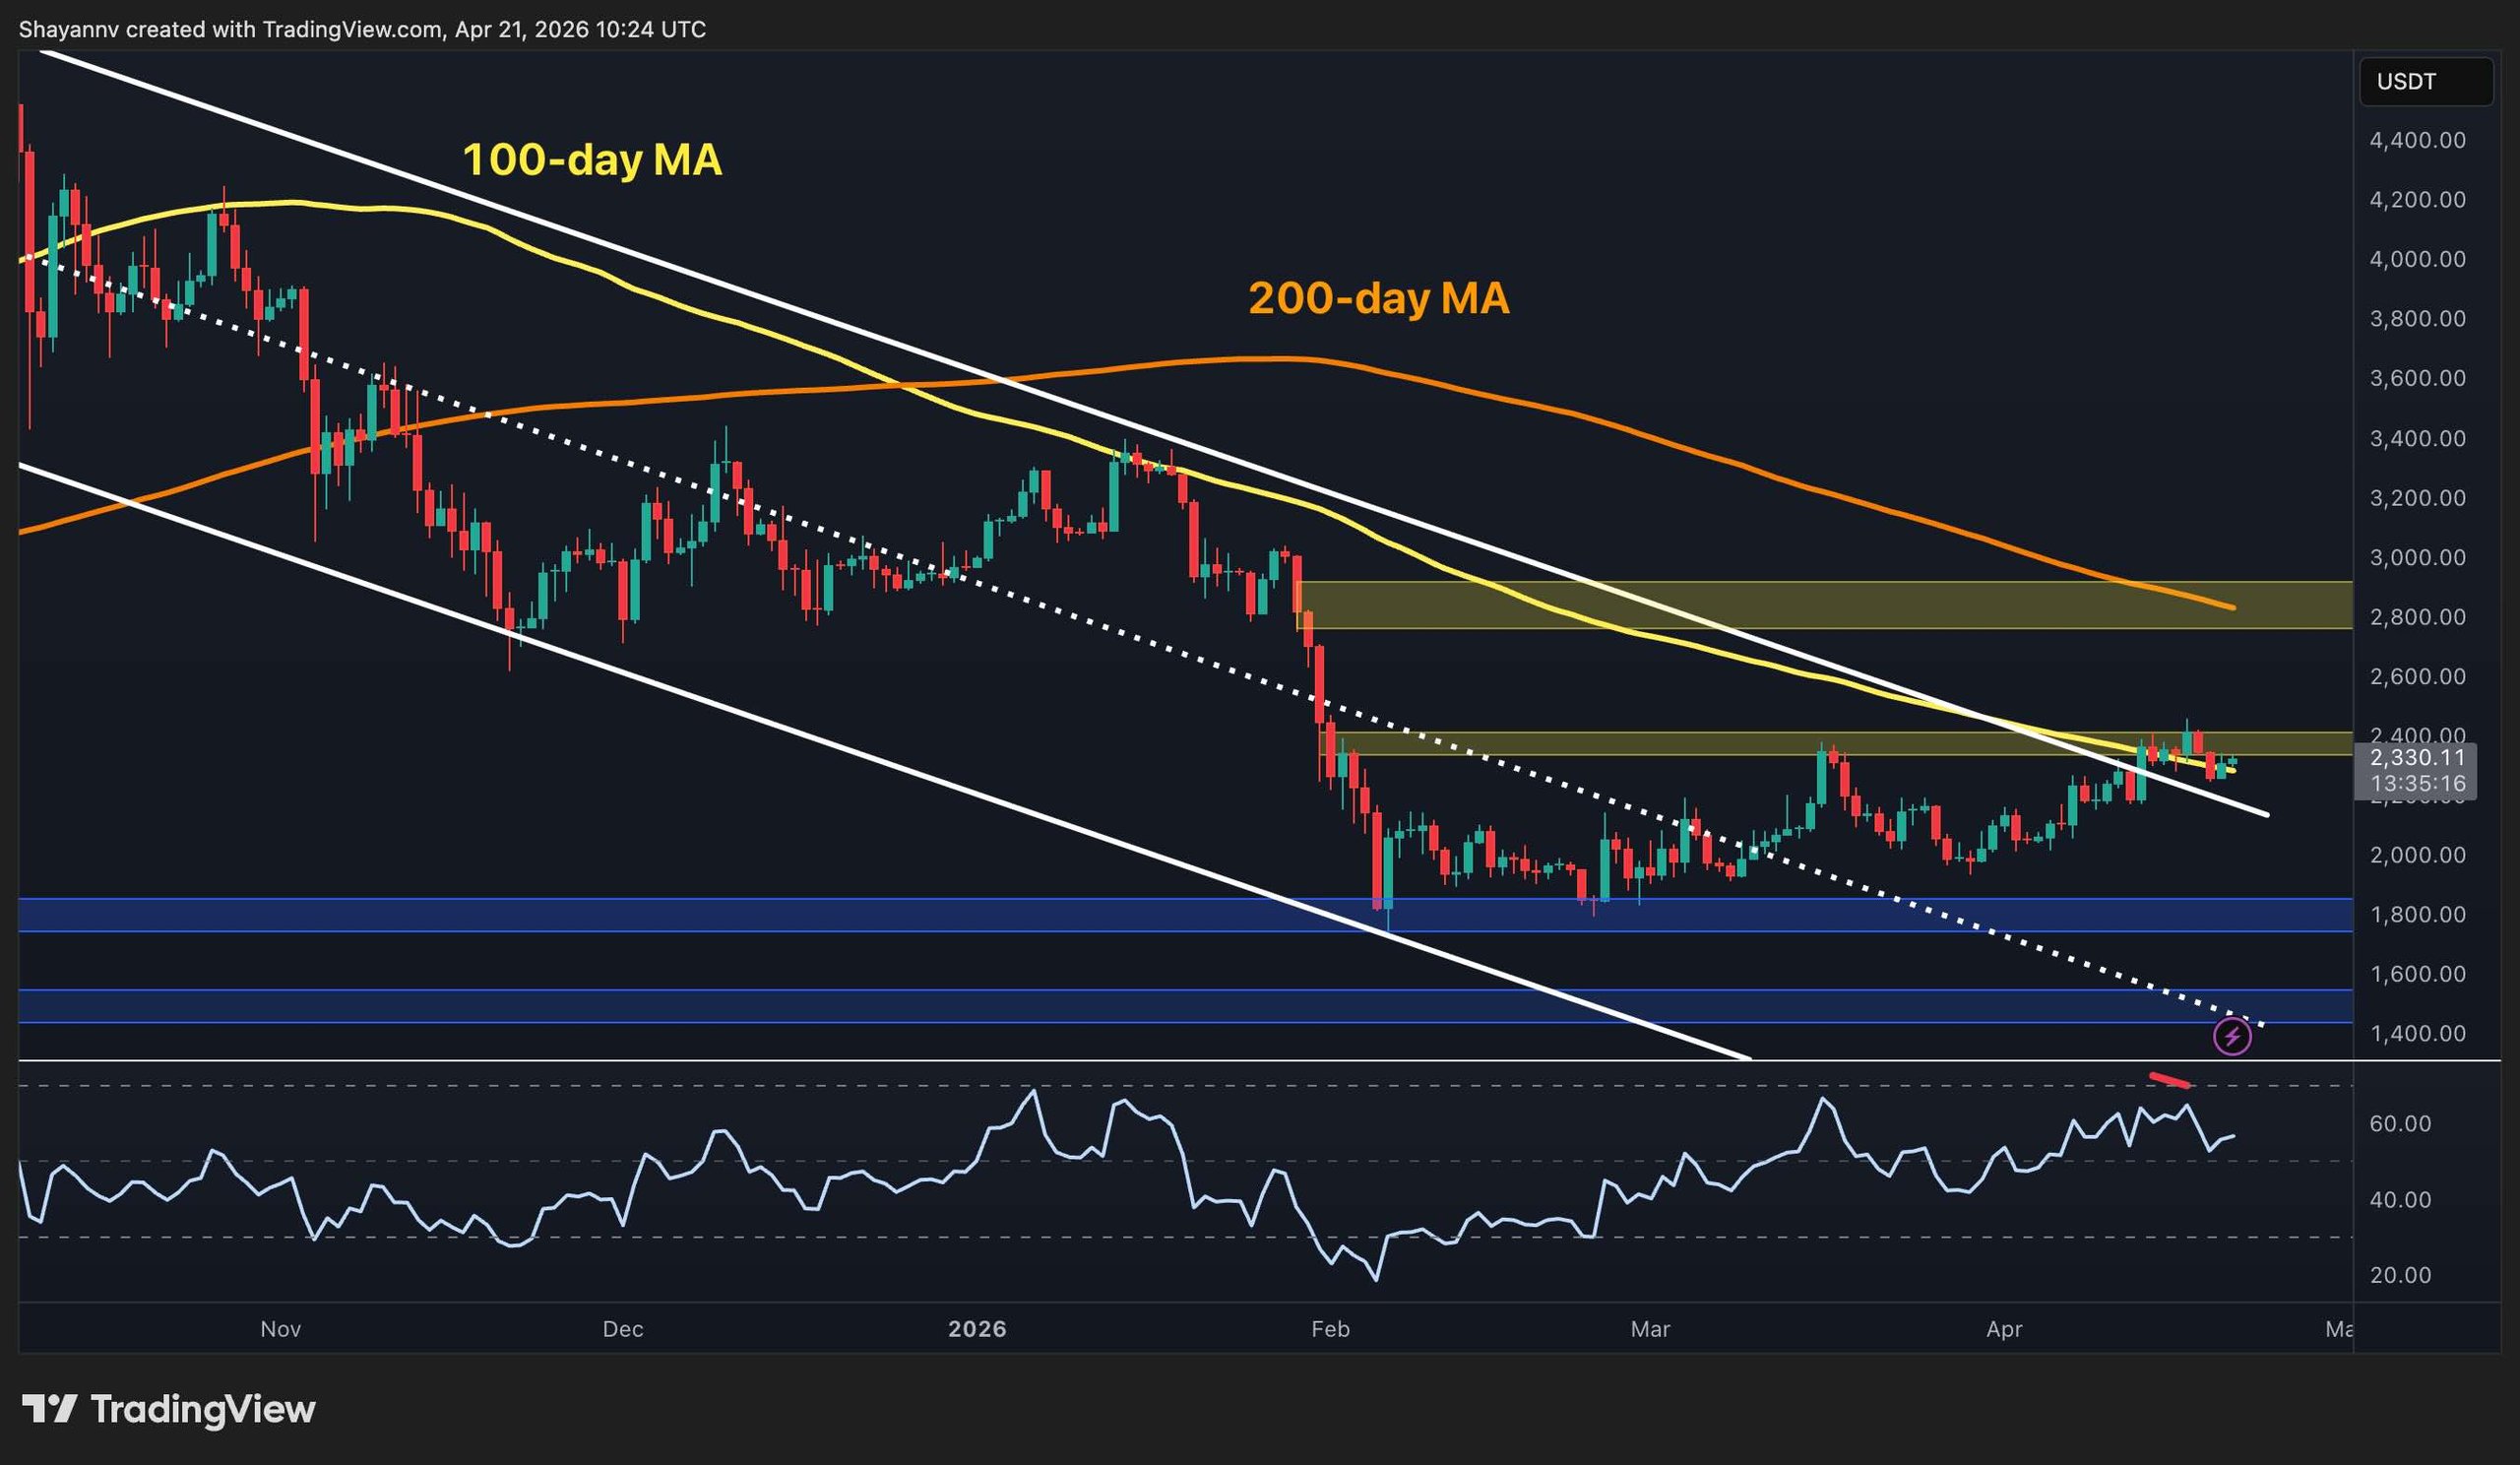
Ethereum Price Analysis: Daily View
The daily chart reveals that ETH is testing the $2,400 resistance level for the third consecutive time. With the 100-day moving average converging with the upper boundary of the channel, the price is attempting to maintain itself above both metrics. The Relative Strength Index (RSI) has remained above 50, indicating positive momentum and increasing the likelihood of a breakout over $2,400.
Presently, ETH persists above the $2,300 level. A successful breach of the $2,400 zone could pave the way toward the formidable $2,800 resistance level, which aligns with the declining 200-day moving average.
Conversely, a daily close below the crucial $2,000 threshold would serve as an initial red flag. Nevertheless, given the current market dynamics and structural indicators, the probability of a breakout over $2,400 appears favorable.
ETH Daily Chart
Source: TradingView
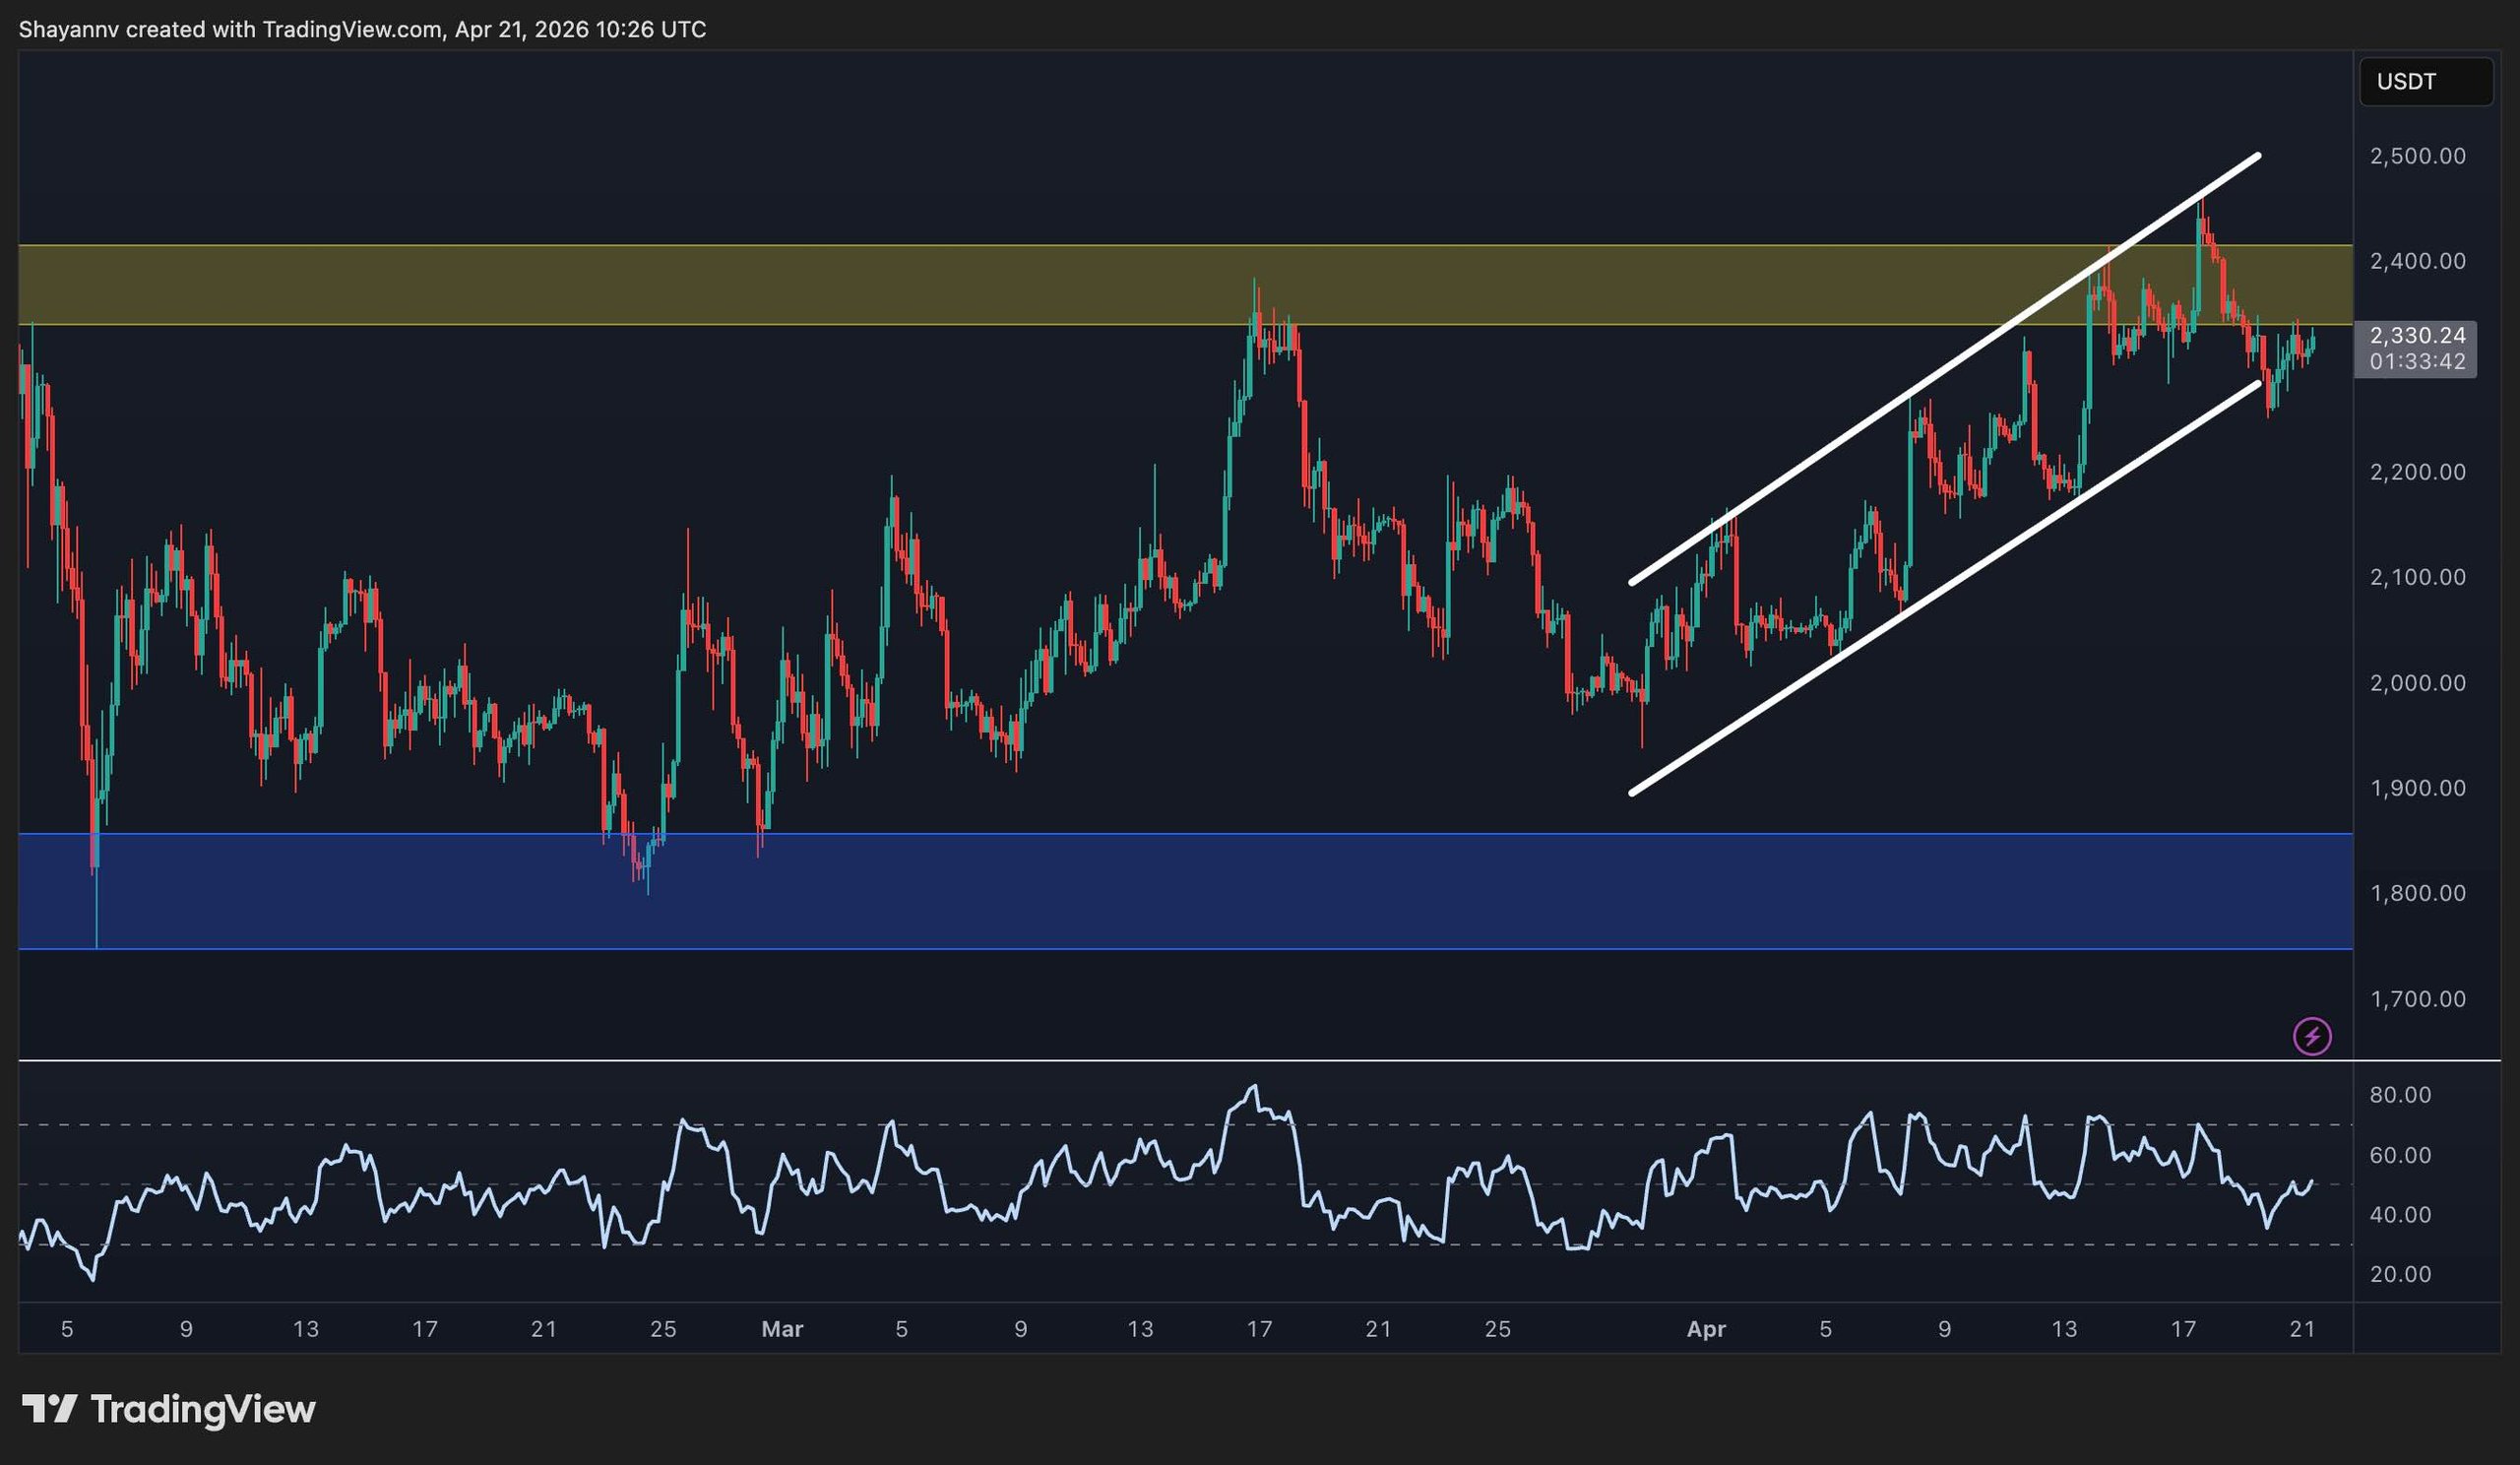
ETH/USDT Four-Hour Chart
ETH’s short-term ascending channel saw pressure early this week as the price dips below the lower boundary. However, this decline was swiftly reversed, with prices returning within the channel—a classic scenario often referred to as a bear trap, strengthening the bullish argument.
Such false breakdowns often precede rapid upward movements, as sellers are dissuaded from breaking below significant trendlines, and buyers reclaim the market.
As it stands, ETH is worth around $2,350, just under the $2,400 resistance threshold, with the lower channel boundary around $2,200 now working as a robust support. The RSI hovers near 50, indicating potential for additional upward movement, especially considering the recent failed breakdown.
 ETH 4-Hour Chart
Source: TradingView
Sentiment Overview
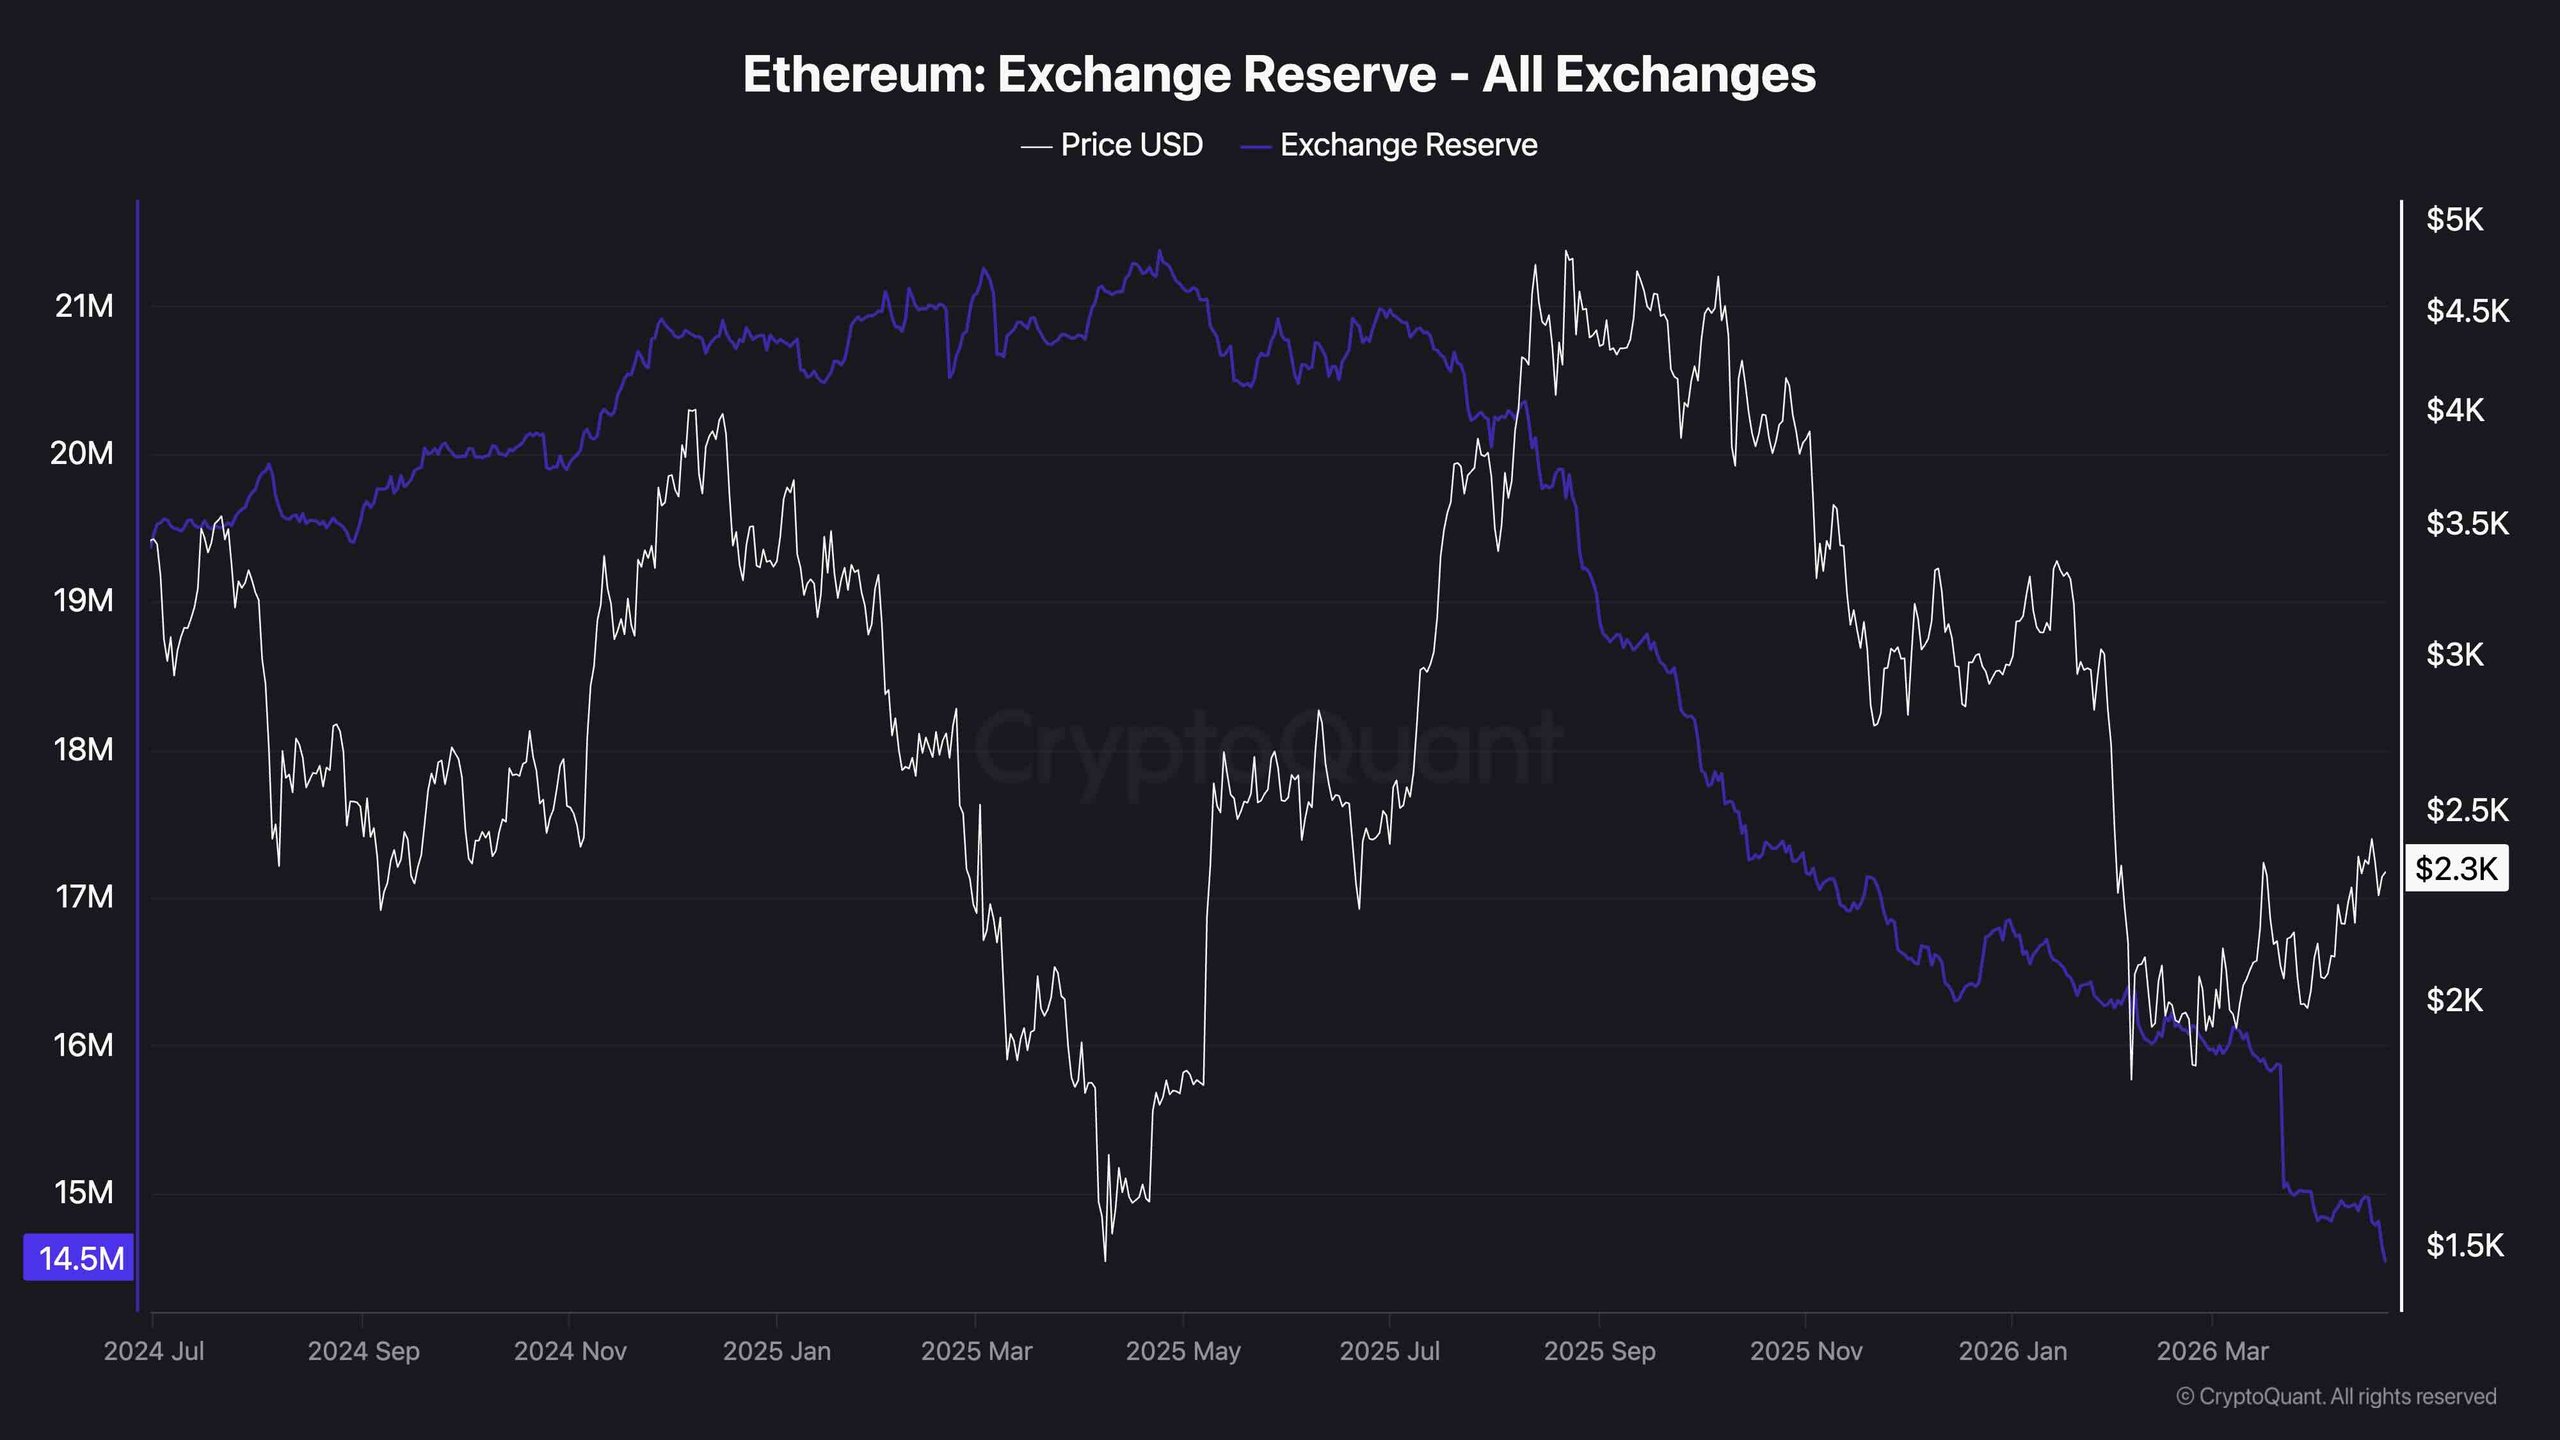
Currently, Ethereum’s exchange reserves have plummeted to approximately 14.5 million ETH—a record low and a notable decline from the 16 million level observed during February. The rapid pace of this outflow contrasts sharply with past trends, suggesting that holders are opting to withdraw and retain their assets rather than sell during this bullish phase.
This behavior counters distribution metrics and, combined with the previous analysis of failed breakdowns on the four-hour chart, offers a compelling bullish setup on the technical front. Not only are buyers defending essential chart levels, but supply dynamics are tightening just as a breakout attempt is underway.
 Ethereum Exchange Reserve
Source: CryptoQuant
For those interested in following the cryptocurrency market, be sure to stay updated with our latest insights and analyses.
