


Bitcoin Faces Challenges Ahead of $90K-$110K Range as Several Factors Affect Bullish Momentum
Bitcoin’s ongoing price consolidation within the $90,000 to $100,000 range marks a significant point in its broader bull market, but several factors could impede its upward trajectory.
What to Know:
- Key USD liquidity sources are tightening.
- The Trump administration is re-evaluating the feasibility of a strategic BTC reserve.
- A historical pattern from previous bull market peaks is re-emerging.
Since early 2023, Bitcoin has exhibited a stairstep bull run characterized by gradual price increases followed by periods of consolidation that build momentum for future rises. However, the current consolidation phase poses risks marked by tightening USD liquidity.
Tightening USD Liquidity
The tightening of fiat liquidity is generally unfavorable for all asset classes, including cryptocurrencies. According to Arthur Hayes, Chief Investment Officer at Maelstrom, the cash balance in the U.S. Treasury General Account has surged from $623 billion to $800 billion recently, restricting liquidity in the market. This pattern generally leads to higher borrowing costs and could create a challenging environment for risk-sensitive assets like Bitcoin.
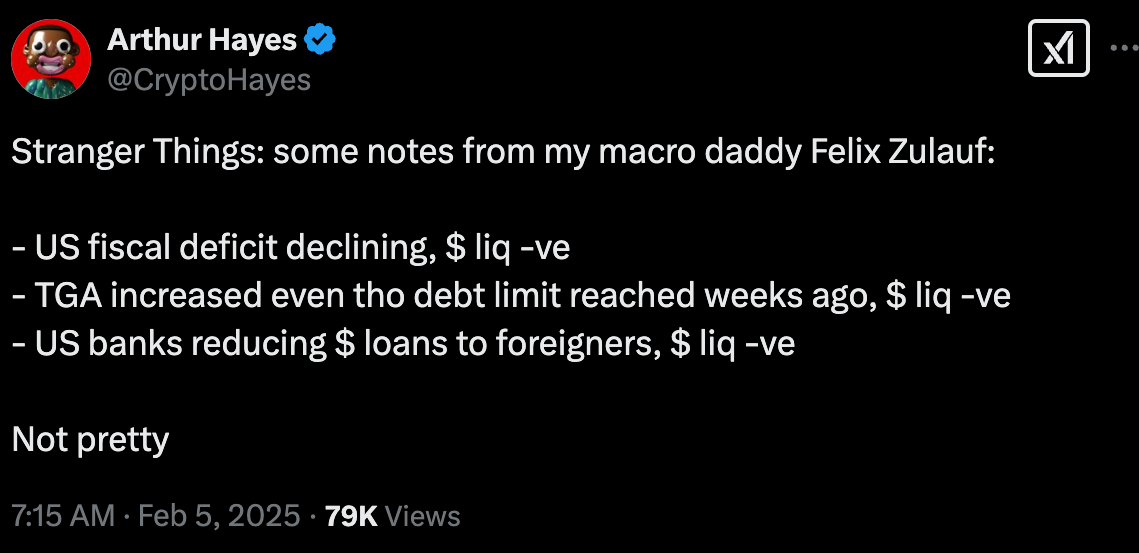 Arthur Hayes’ post on X
Trump Administration’s Strategic BTC Reserve Review
Although initiatives for establishing a strategic BTC reserve were once a priority for the previous administration, there has been a shift towards a more cautious approach. Investors had hoped for prompt actions but are now met with delays as Trump’s new crypto czar states that the feasibility of a reserve is under evaluation. As a result, Bitcoin’s price has experienced volatility following these new developments.
Reappearance of a Topping Pattern
Finally, traditional technical analysis indicators such as the 14-week relative strength index (RSI) suggest a bearish divergence akin to patterns observed during previous market peaks.
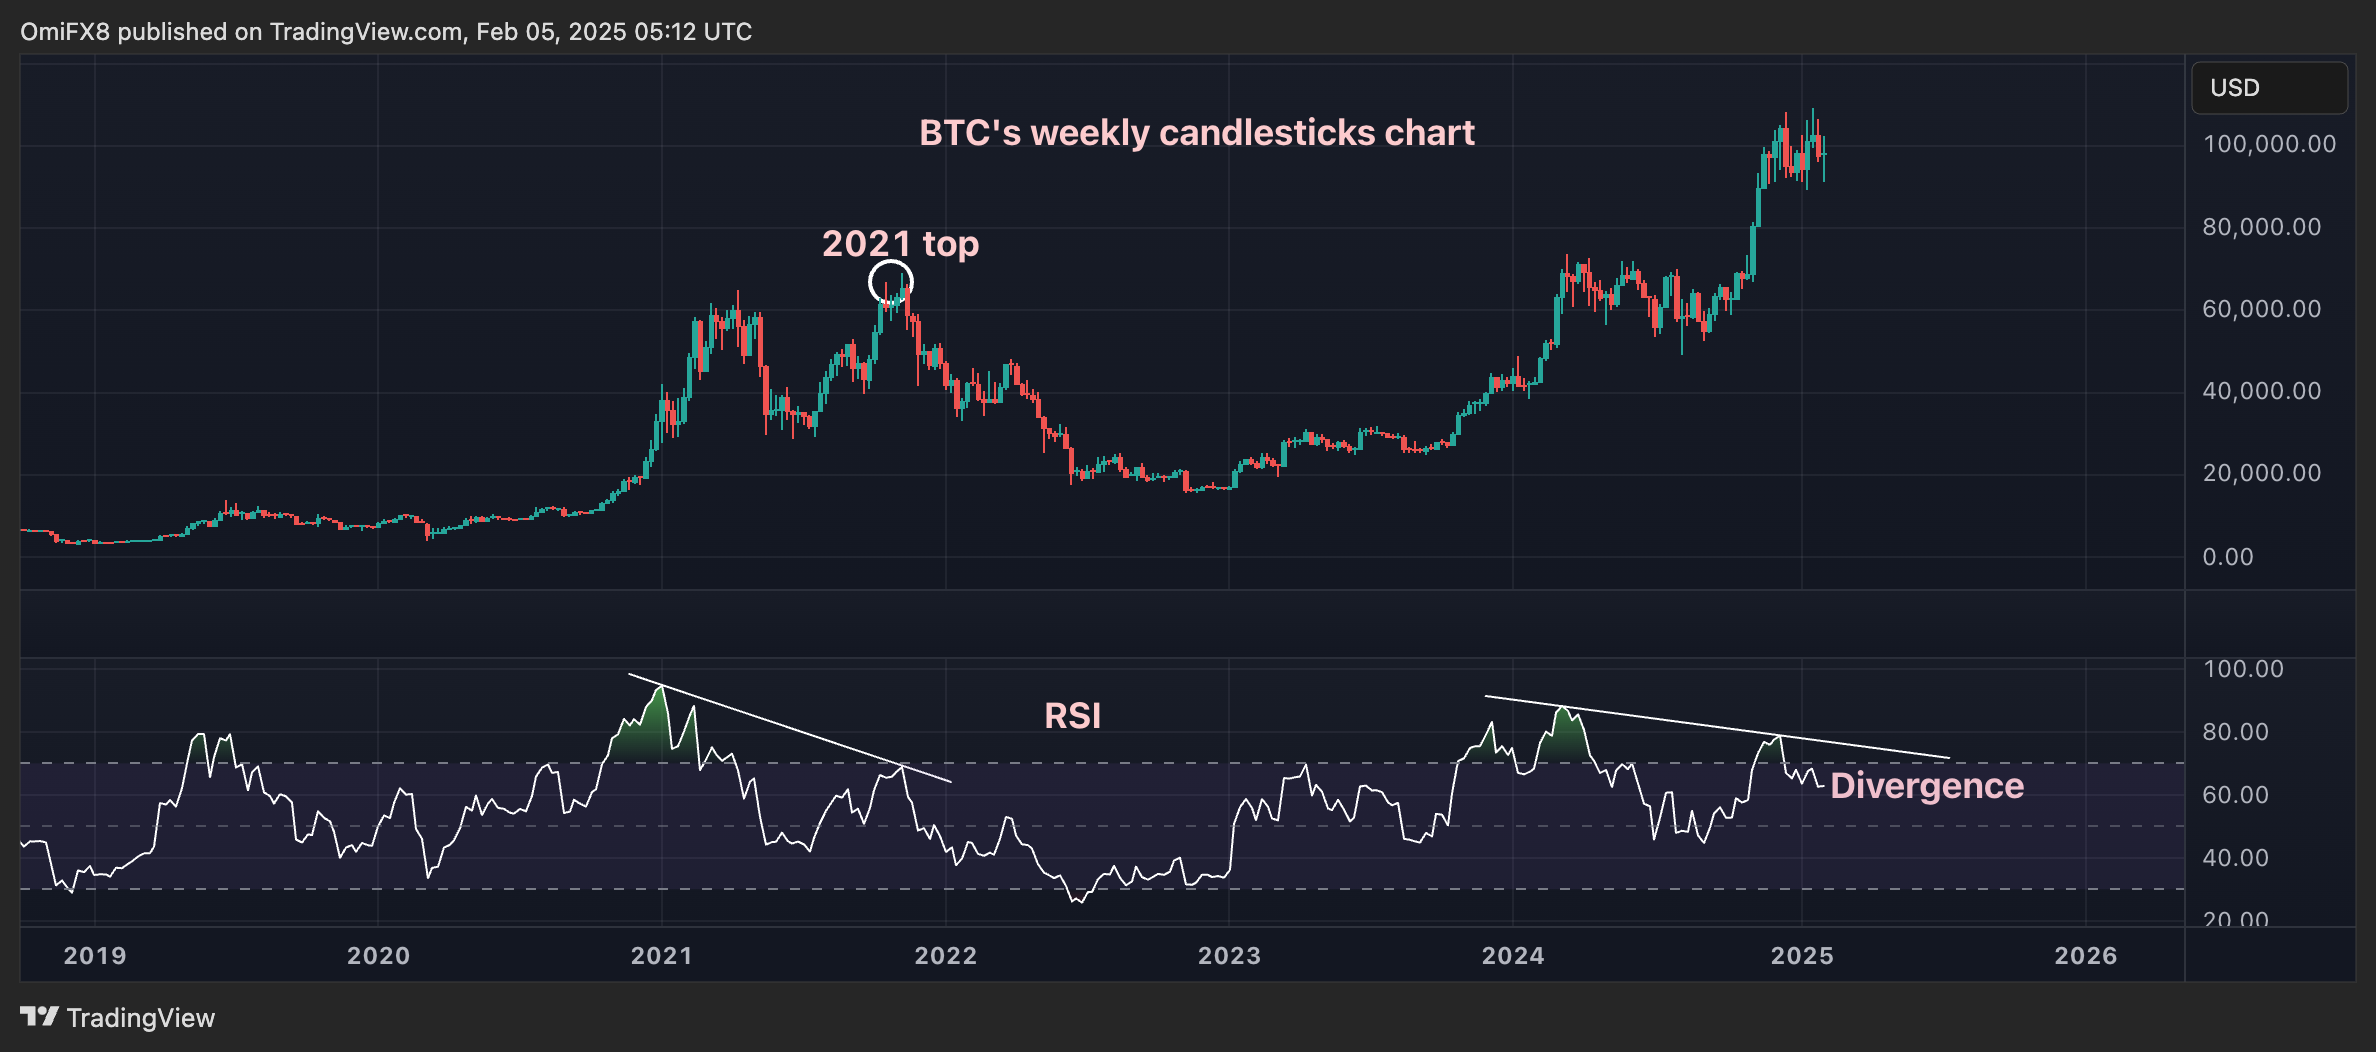 BTC’s weekly candlesticks chart with the RSI
If these trends continue without a change in liquidity or strategic policy, Bitcoin might face more pressure as it aims to break through the critical price range.
