
BNB Price Forecast: Expecting a Bullish Breakthrough as Market Aligns
The BNB price is at a pivotal point, potentially reaching $700 or falling towards $600 amid fluctuating market sentiment.


The 2025 BNB price is positioning itself for a transformative year as the BNB/USD pair hovers at a critical juncture amidst varying market emotions.
Recent trading patterns indicate promising chart formations as key indicators show mixed signals. This leads to speculation about whether Binance Coin (BNB) will ascend to $700 or face a downward trend below $600. Here are the insights from recent technical analyses.
Rounded Bottom Indicates Possible Bullish Breakthrough for BNB Price
 BNB Price Chart
(Source: CoinGecko)
BNB Price Chart
(Source: CoinGecko)
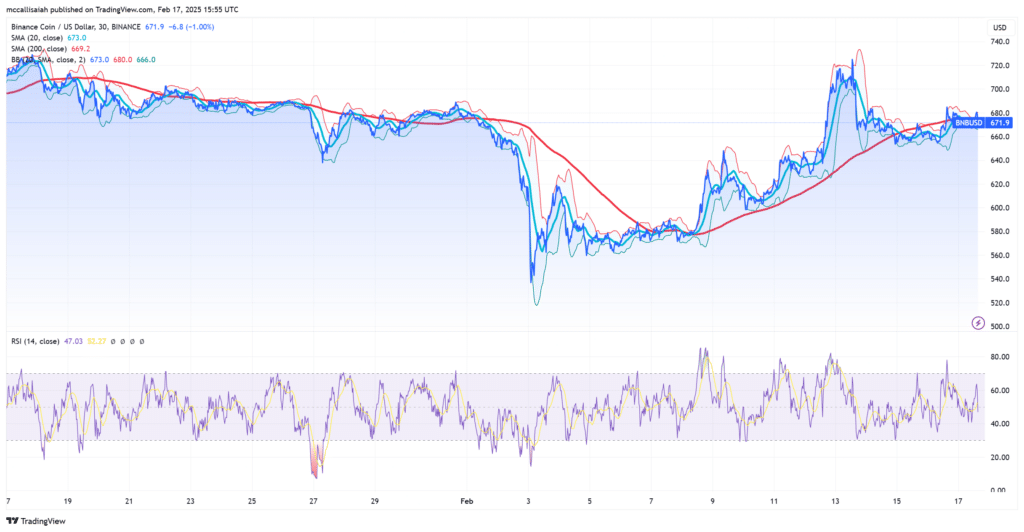
The BNB price chart is suggestive of a rounded-bottom formation, typically a precursor to a bullish reversal. A surge past $700 may confirm a cup-and-handle setup, a recognized signal of upward movement. Traders monitoring this level might witness heightened buying activity if the breakout occurs.
Key resistance levels to observe include:
- $680-$700: The immediate threshold restricting price movement.
- $733: The subsequent target if $700 is surpassed.
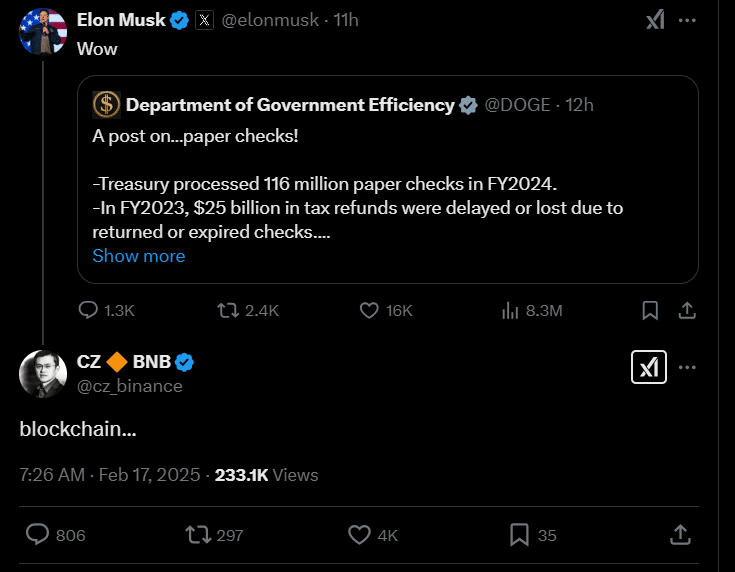 Market Insights
(Source: X)
Market Insights
(Source: X)
From a support perspective, BNB continues to encounter formidable backing, mitigating selling risk. The primary support zone is around $660, which aligns with the 20-day moving average and lower Bollinger Band. A more significant support threshold exists at $620, acting as a safeguard against major pullbacks.
Bollinger Bands Suggest Increasing Volatility
The BNB/USD indicates a widening Bollinger Band pattern, with prices clinging near the upper band—a common bullish indication. However, this expansion also signifies growing market volatility. A breakthrough beyond $680 could instigate a considerable rally, whereas failure to maintain this level raises the likelihood of a decline.
Moreover, a golden cross between the 20-day and 200-day SMA signifies potential medium-term upward momentum.
Market Sentiment: BNB at a Crossroads
Despite supportive technical signals, BNB’s trajectory is clouded by conflicting market dynamics. Trading volume on the BNB Chain has dwindled to $2.8 billion, revealing a potential drop in demand. The presence of a falling wedge further complicates the outlook, typically a bearish indicator.
Liquidity trends could potentially shift market dynamics and enhance demand for BNB and the broader market.
A successful breakout above $700 may pave the way for a rise towards $733, and sustained momentum could suggest further increases.
Conclusion on BNB Price Growth
The BNB price forecast hangs in a delicate balance. While certain technical patterns hint at a bullish breakout, broader market sentiment raises challenges. Keep a close eye on the $680-$700 resistance for signs of either a breakout or a rejection, as these outcomes will influence the next steps for this leading cryptocurrency.
