Bitcoin Price Fluctuations Showcase Weekly Hammer Candles, Rarely Observed in BTC's Timeline
Recent weeks have seen significant volatility in Bitcoin prices, with dramatic swings recorded in a short span of time. This article examines the formation of hammer candles in BTC's trading history.


Key Takeaways
- Weekly hammer candles occur when the lower or upper wick constitutes 90% of the total price range.
- Recently, Bitcoin exhibited notable volatility with swings of 23% and 16% within a two-week period.
The past weeks have seen significant fluctuations for Bitcoin (BTC), reflecting extreme volatility in the market. Over the previous two weeks, Bitcoin exhibited an open-high, lower-close candlestick pattern with considerable percentage differences.
In the week starting February 24, Bitcoin dipped to $78,167 before reaching a high of $96,515, resulting in a 23% swing. The week following that, starting March 3, noted a low of $81,444 with a high of $94,415, translating to a 16% swing.
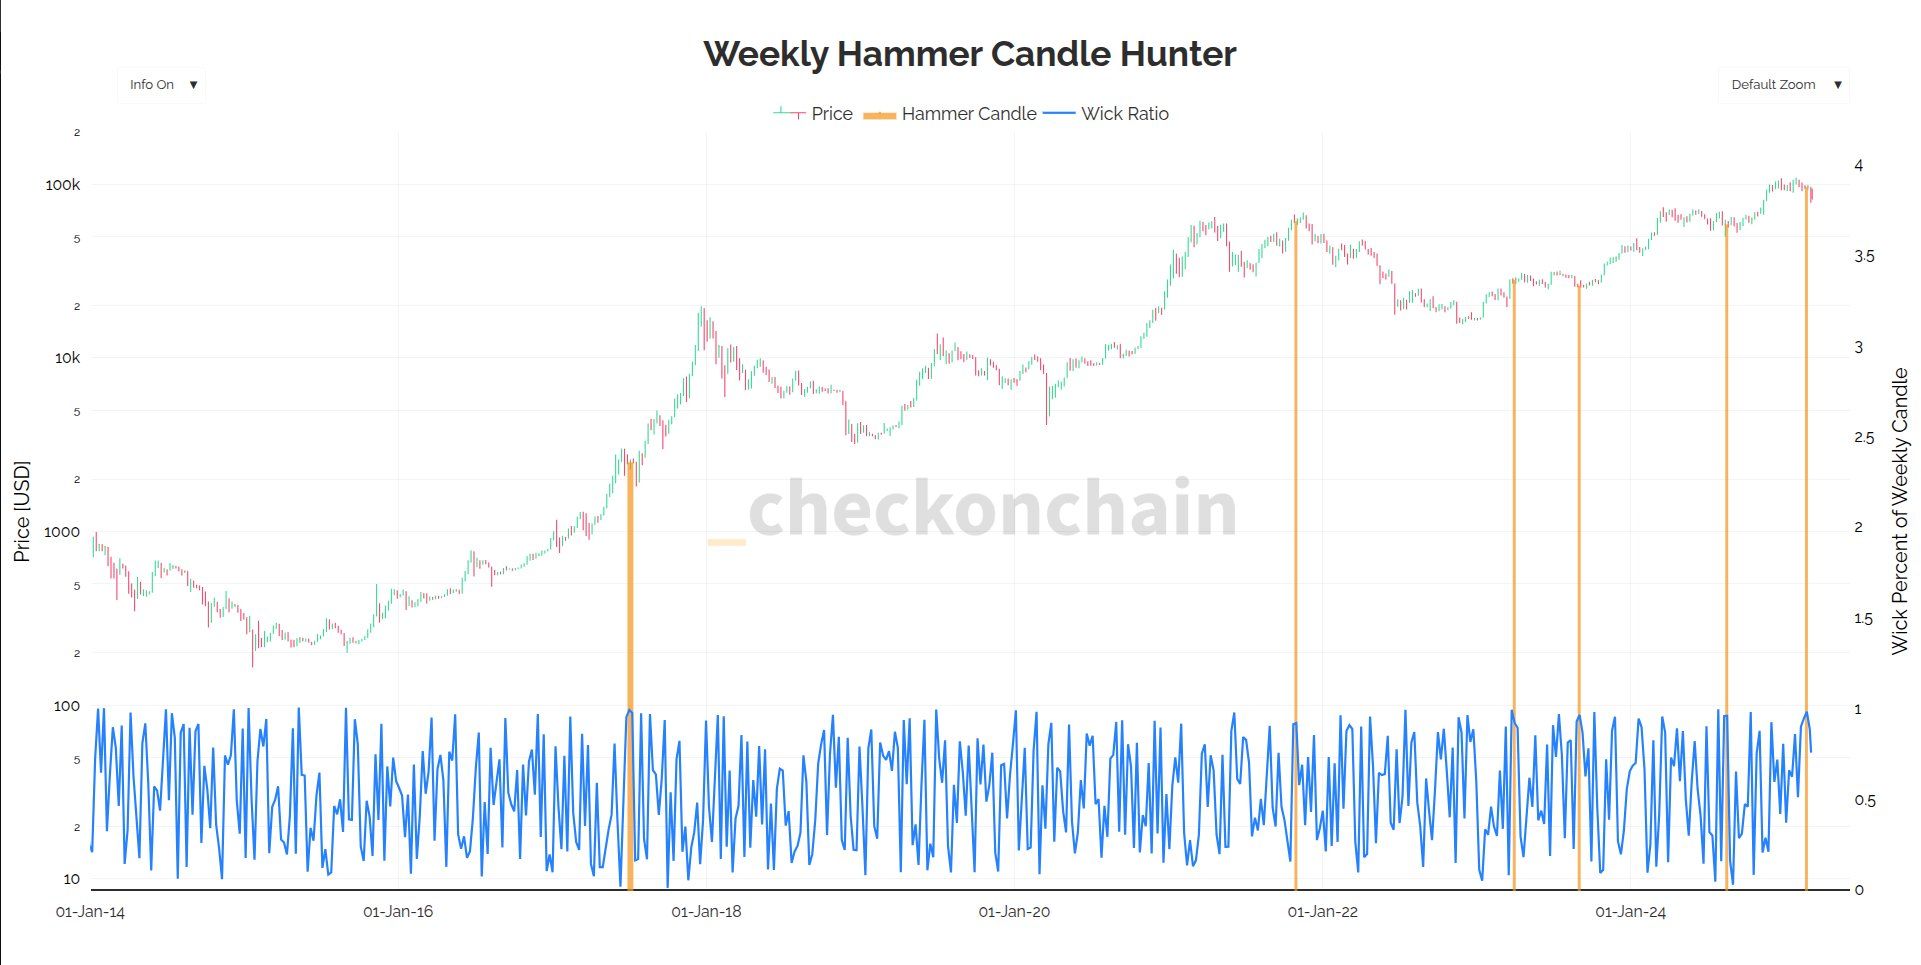
These large candlestick formations are recognized as hammer candles. Analyst Checkmate defines these patterns as having the lower or upper wick making up 90% of the total price range, showing a small body with a long wick.
Checkmate’s analysis indicates that Bitcoin has formed a weekly hammer candle with a 90% lower wick only five times throughout its history. These occurrences took place during the bullish phase of 2017, near the peak of the bull market in late 2021 around $69,000, twice in 2023 following the crisis of Silicon Valley Bank and again after the summer downturn, plus once more in 2024 during another summer lag.
While the data doesn’t suggest a clear cyclical pattern for Bitcoin, the correction during the 2017 bull market stands out, hinting that such formations may signal significant turning points in price trends.
Disclaimer: Portions of this article were generated using AI tools and have been reviewed for accuracy. For more details, refer to CoinDesk’s AI Policy.
