Key Insights
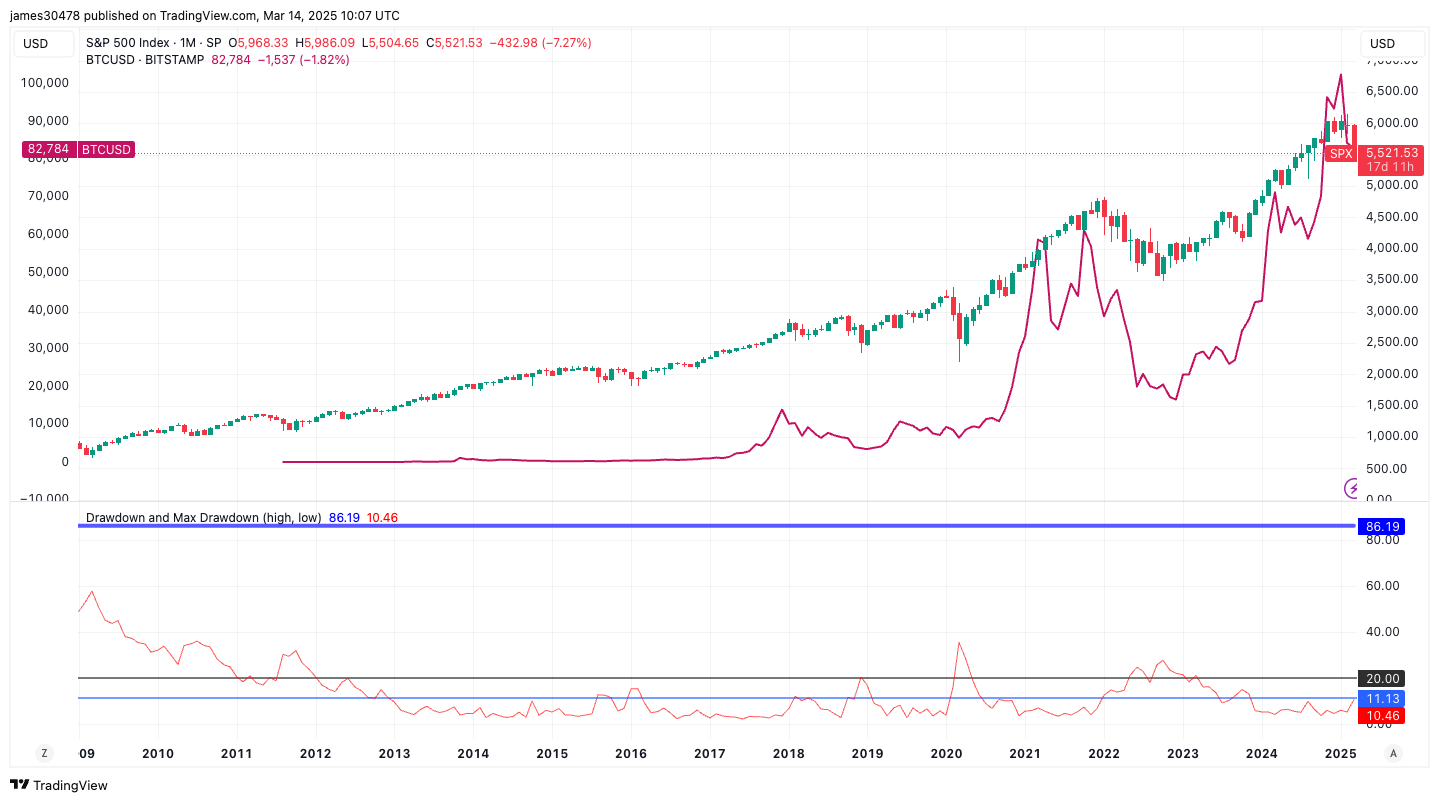
- The S&P 500 has entered a correction, marking a 10% decline from its peak, with notable 20% corrections observed in previous years such as 2009, 2019, 2020, and 2022.
- Bitcoin has experienced a 30% drop from its peak, aligning with typical behavior during past bullish corrections, such as the one in August 2024 when market conditions reflected a yen carry trade unwind.
Historical Context
The S&P 500 defining a correction involves a 10% fall from its highest point. An additional 10% decrease could lead to a bear market. However, panic may not be warranted. Since Bitcoin’s inception in 2009, the S&P 500 has endured numerous significant corrections:
- Following the 2008 financial crisis, the index fell nearly 60%.
- In 2019, during Bitcoin’s downturn, the S&P 500 dropped 20%, while Bitcoin itself fell as much as 85%.
- The COVID-19 crash in March 2020 saw a 40% drop in the index, and Bitcoin lost 60%.
- In 2022, the index corrected by 25% and Bitcoin hit a cycle low of $15,000.
Current Market Analysis
Typically, a 10% correction is an expected occurrence for the S&P 500. Currently, Bitcoin is receding 30% from its all-time height during this market shift. Looking at prior bullish corrections, significant declines are standard, with the latest 30% correction notable in August 2024.
Note: Historical data illustrates the resilience of Bitcoin amid market fluctuations, indicating patterns over the decade that continue to influence current investment strategies.
