S&P 500 Surpasses 200-Day Moving Average, Boosting Bitcoin Prospects
Recent technical breakouts in both equities and cryptocurrency markets indicate a potential bullish trend.


Recent Market Insights
Key indicators suggest that the stock market’s correction phase may be concluding, which could positively influence Bitcoin’s (BTC) performance. The S&P 500 index has risen by 1.7% this Monday, marking a significant uptick after a downturn that saw prices drop 10% in recent months.
For the first time since March 10, the S&P 500 has exceeded its 200-day moving average, a metric calculated from an average of closing prices during the past 200 trading days. This average is often utilized to ascertain market trends and potential turning points.
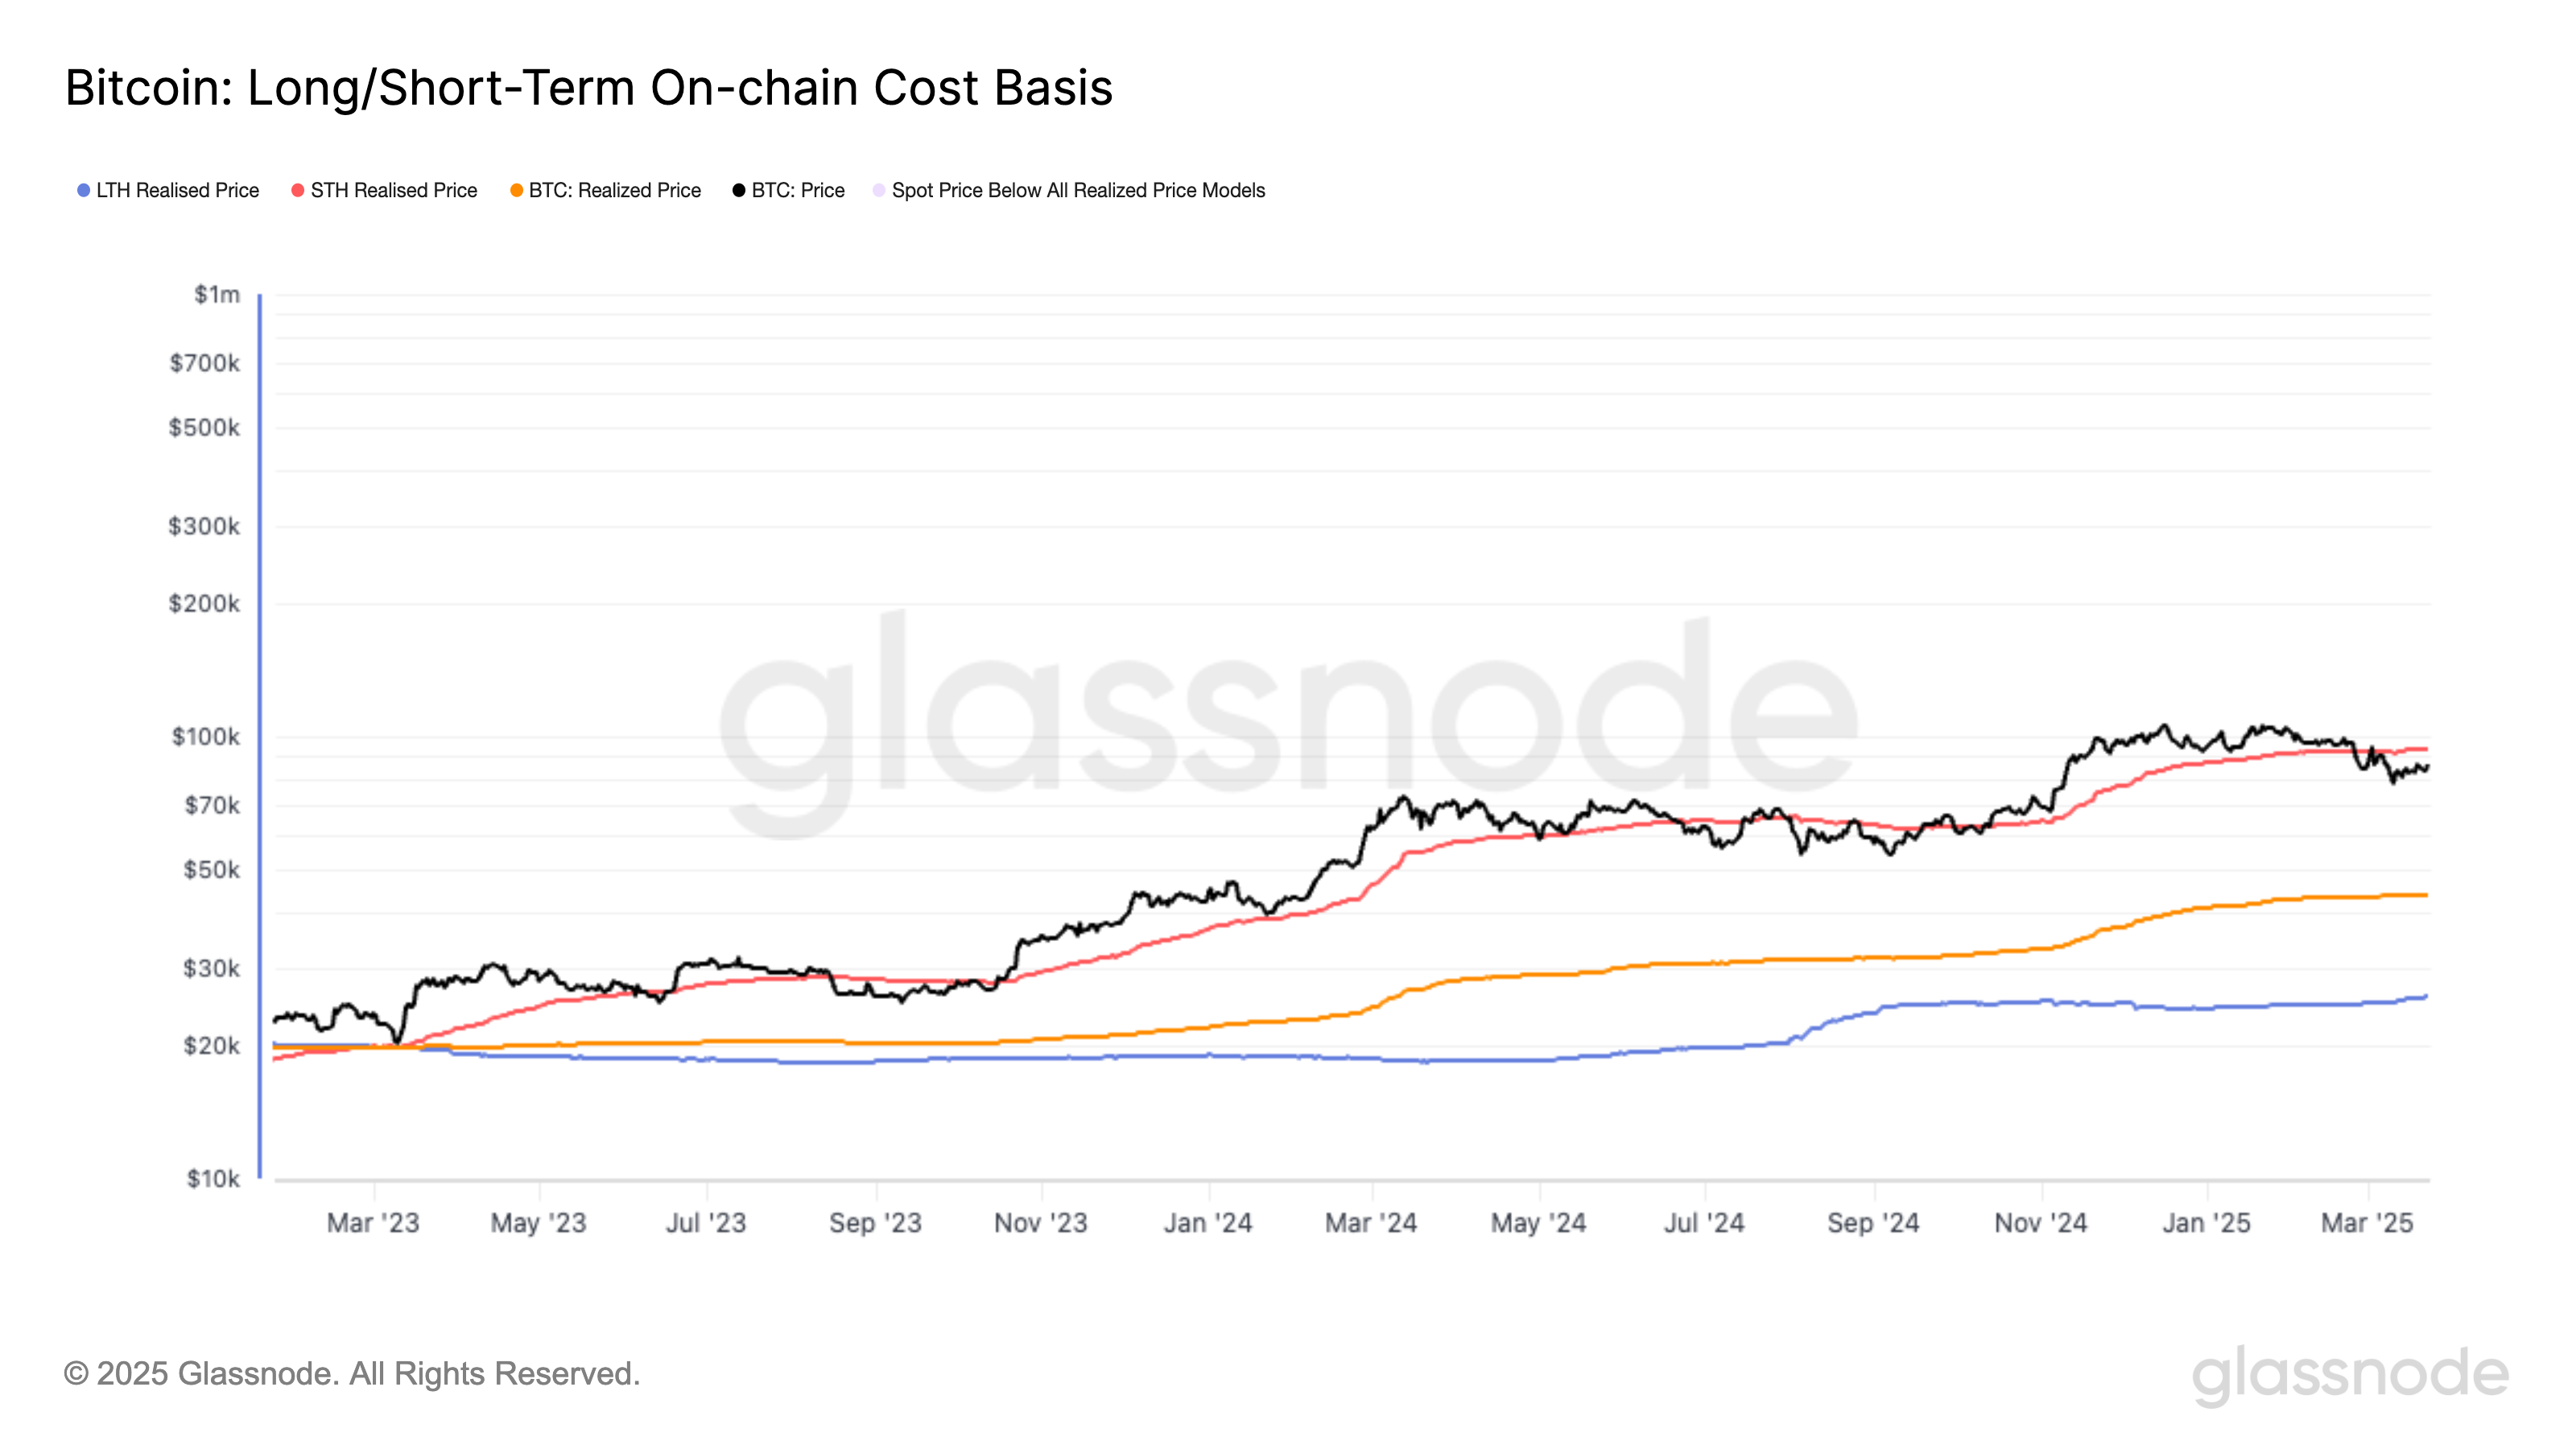
It’s reported that Bitcoin is trading above $88,000 after overcoming its own 200 DMA at $85,046. Analysts highlight a critical resistance level for Bitcoin at $93,245, corresponding to the realized price for short-term holders, indicated as the average acquisition cost of coins held outside exchange reserves for less than 155 days. These coins are regarded as the most ready to be transacted.
Long/Short Term On Chain Cost Basis (Glassnode)
Summary of Noteworthy Updates:
- The recovery in equities might signal an impending bullish market trajectory.
- Bitcoin’s movements reveal an upward trend, potentially paralleling gains in the S&P 500.
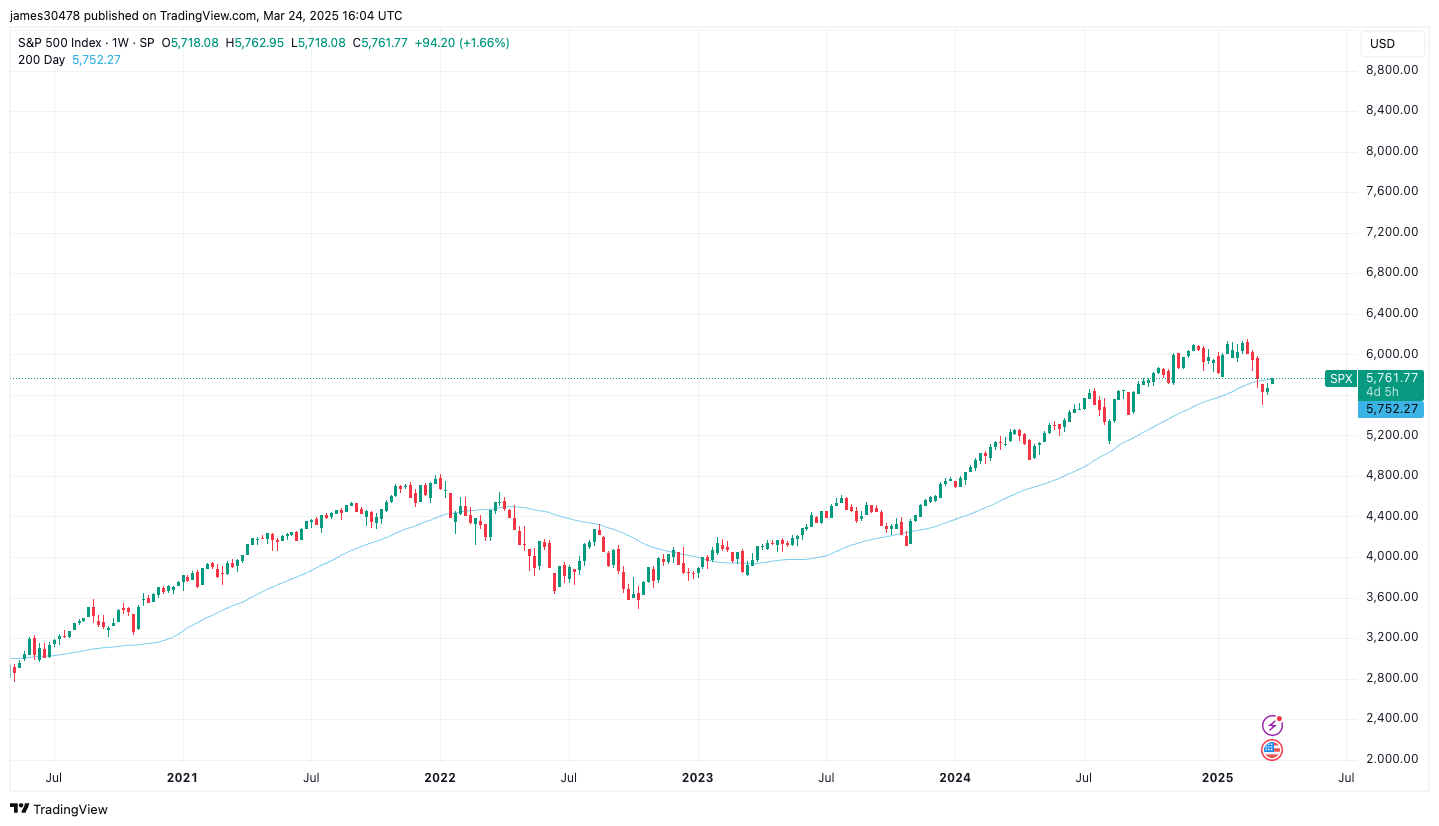 S&P 500 crosses 200DMA (TradingView)
Disclaimer
Parts of this article were generated with assistance from AI tools and checked by human editors to ensure accuracy and adherence to standards.
