
XRP's 'Rising Wedge' Pattern Suggests Potential Price Drop: Analyzing Trends
XRP is showing signs of price decline as it breaks from a rising wedge pattern, indicating a bearish trend.


XRP appears to be facing considerable challenges as its price chart suggests a bearish trend following the breakdown from a rising wedge pattern.
- The currency’s price has dropped below the Ichimoku Cloud, reinforcing a negative outlook.
- To counter this downturn, bulls must surpass Tuesday’s peak at $2.18.
Summary of Findings:
- The price trend for XRP indicates weakness, particularly after a move below the lower trendline of the wedge.
- Technical analysis suggests XRP might revert to the initial support level of $1.60.
XRP’s immediate prospects look bleak.
Image illustrating the bearish trend in XRP’s price chart.
During early trading hours on Wednesday, XRP fell below the wedge, indicating a loss of upward momentum and control reverting to sell-side pressure. Furthermore, the cryptocurrency has now breached the Ichimoku Cloud on the hourly chart, which serves as a key momentum indicator.
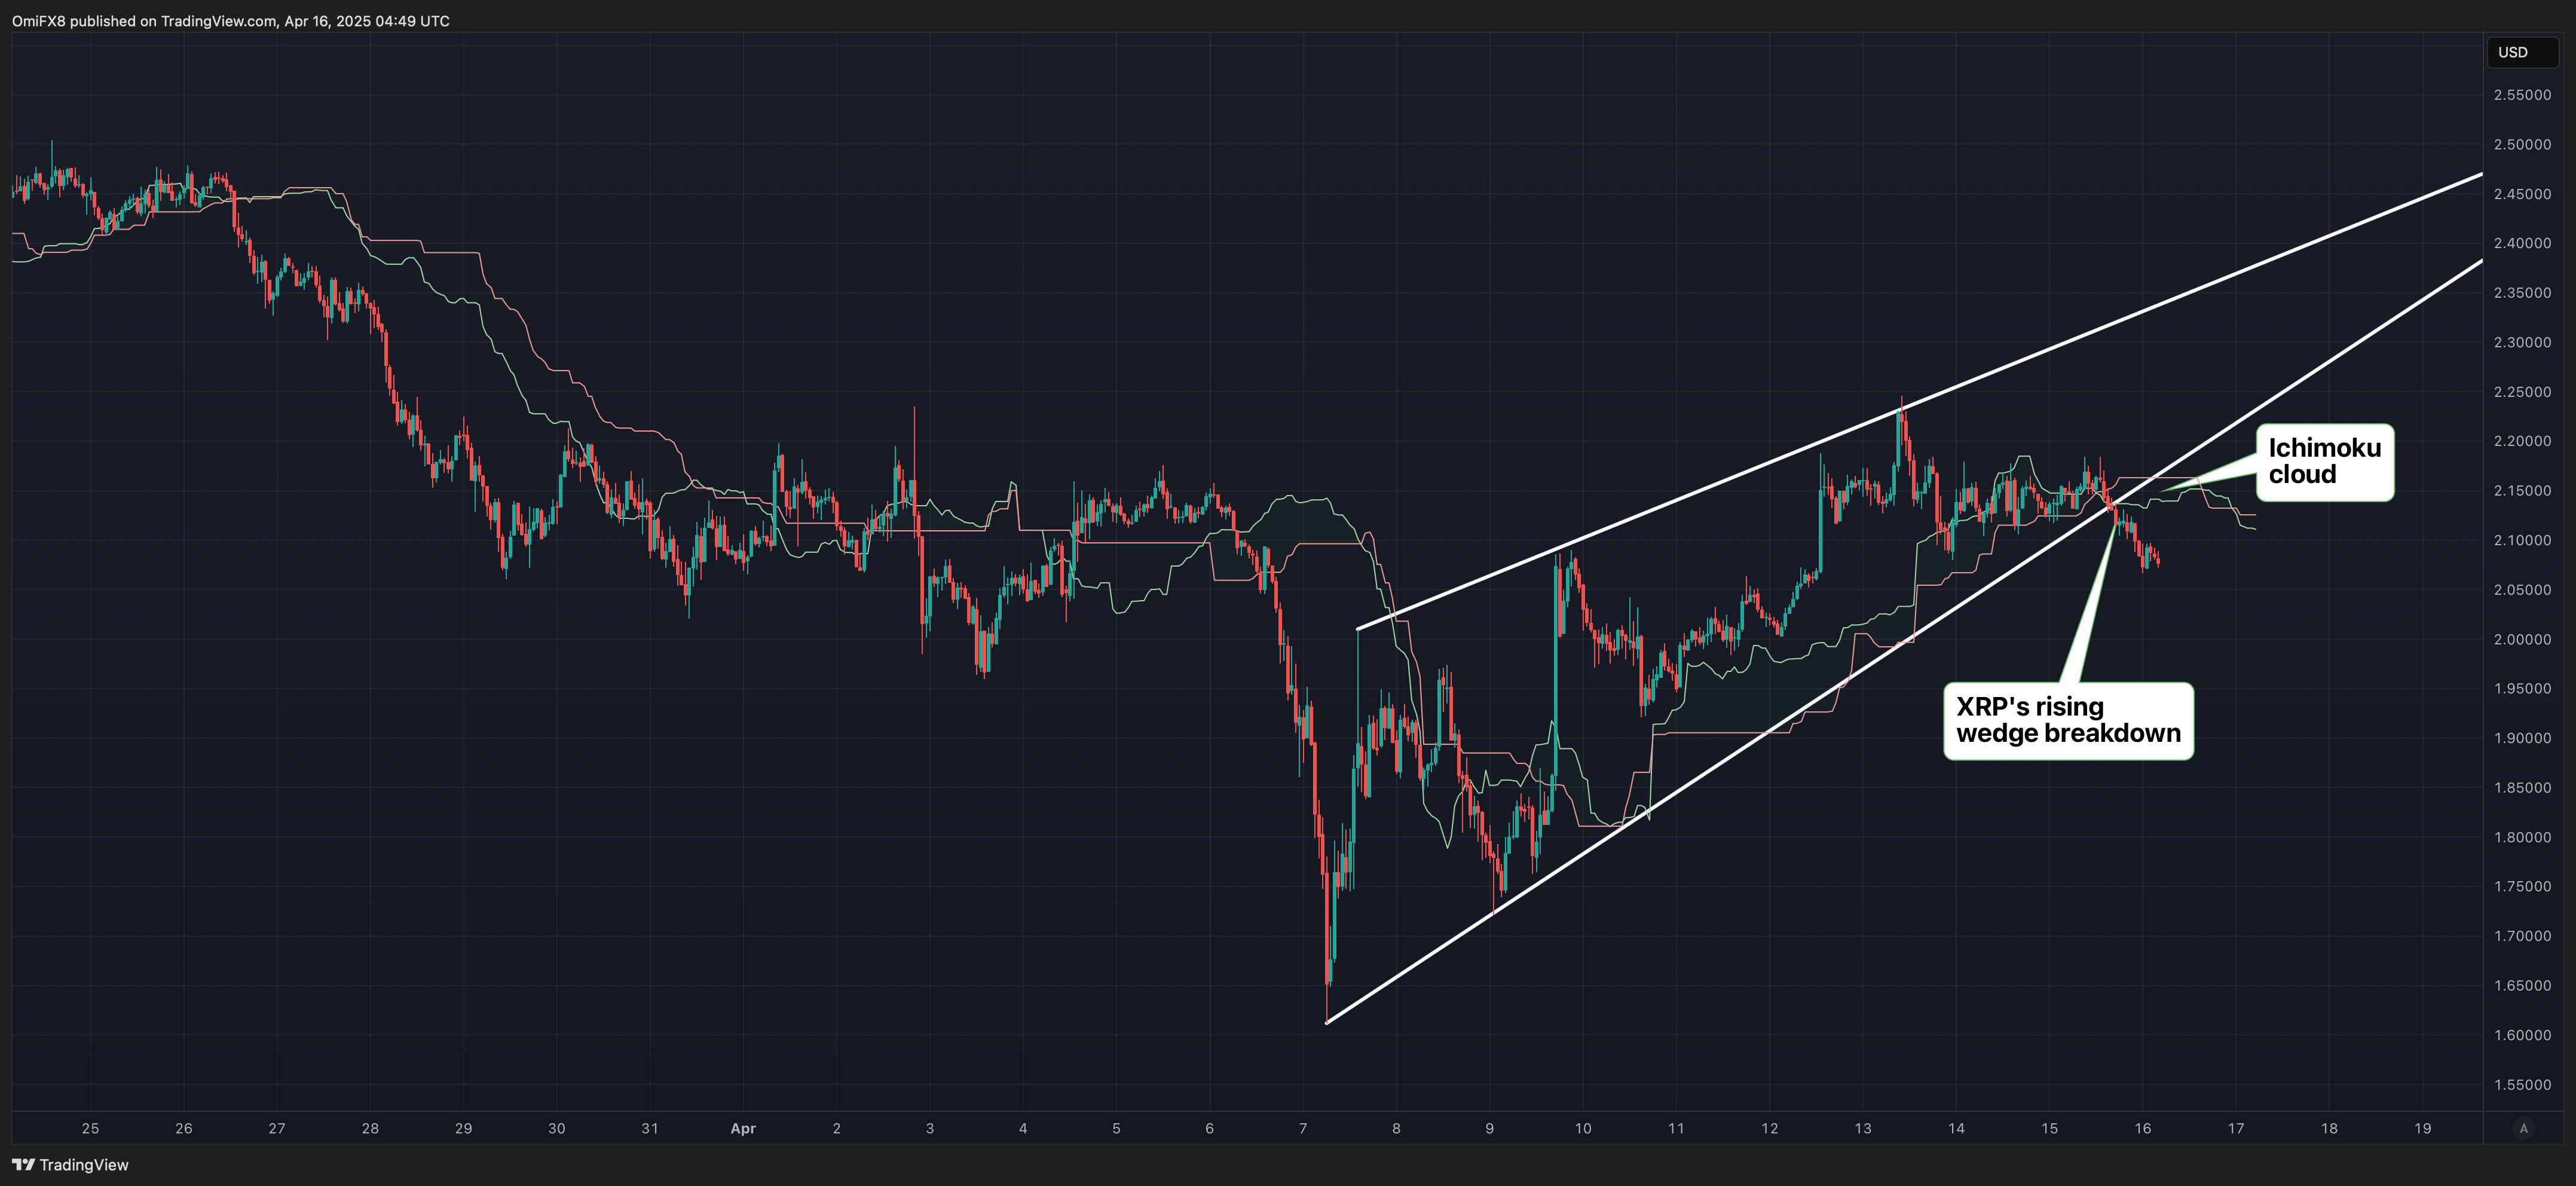 XRP’s hourly chart
 illustrating current trends.
XRP’s hourly chart
XRP’s hourly chart illustrating current trends.
The level at $2.18 remains critical for bulls who aim to revert this bearish outlook.
