


Key Points:
- Bitcoin’s recent price action has reignited focus on the support level of $88,800.
- Meanwhile, XRP inches closer to a bearish technical pattern known as the ‘death cross’, as its price dips below the 50-day moving average.
This technical analysis has been prepared by a CoinDesk analyst.
Bitcoin’s price trajectory over the weekend has highlighted the significance of the $88,800 level, with XRP, oriented towards payment solutions, potentially confirming the unsettling pattern of a ‘death cross’.
BTC dropped by 1.5% on Sunday (UTC time), slipping below a trendline joining the lows from April 9 and 20, based on charts from TradingView.
The failure of this upward trendline indicates that the rebound rally originating from lows under $75,000 might have concluded, showcasing signs of impending declines. Prices dipping below the Ichimoku cloud, a momentum tracker on the hourly chart, further supports this outlook.
Conversely, $88,800 may represent a vital support point, having previously halted upward movements on March 24 and April 2, implying potential challenge if revisited.
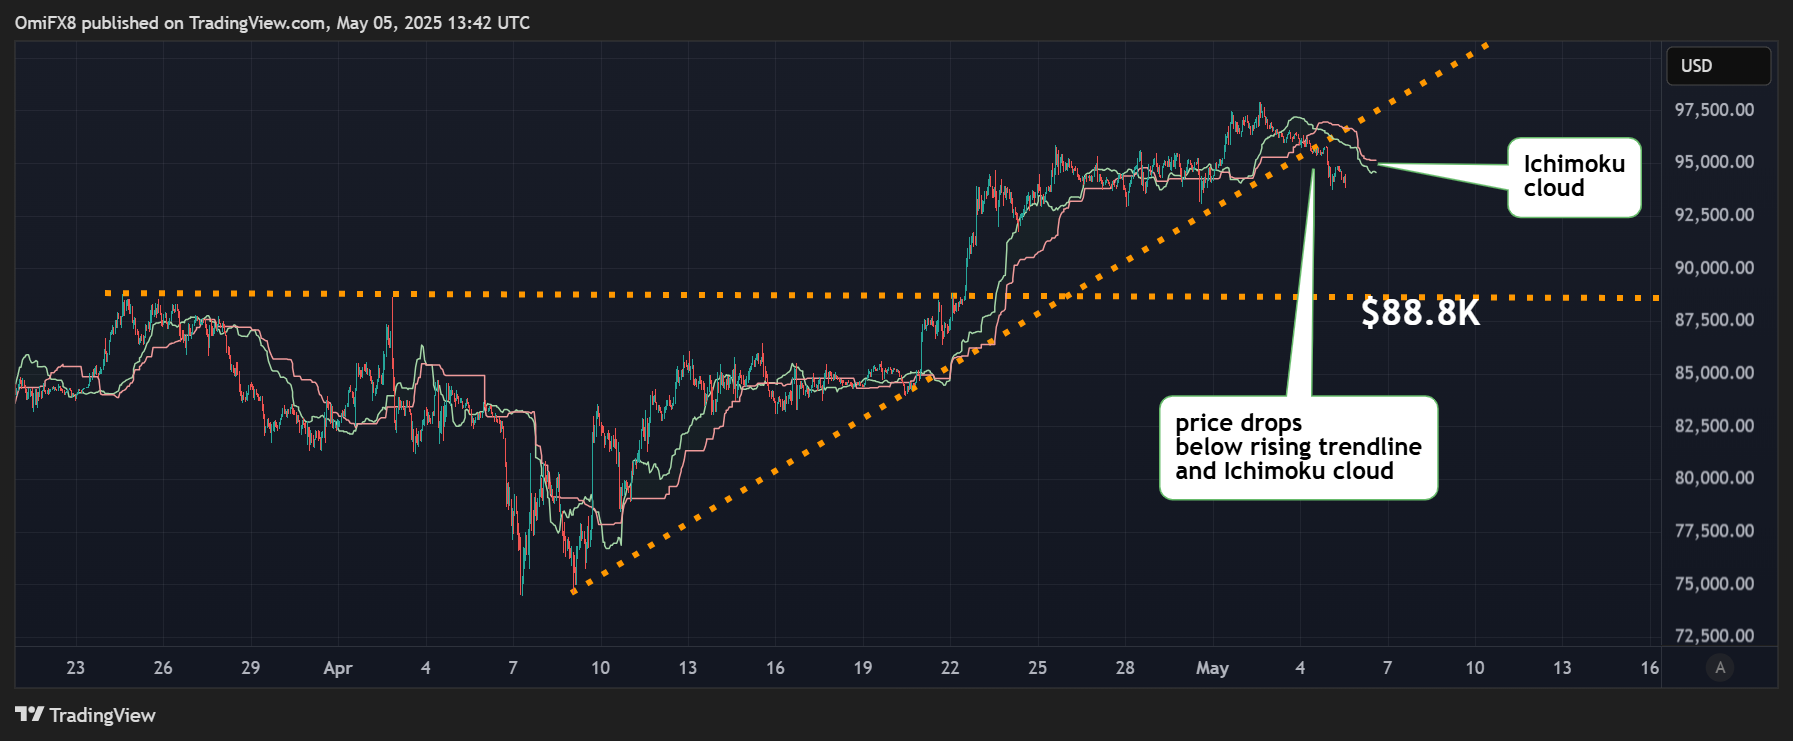 BTC’s Hourly Chart. (TradingView/CoinDesk)
The bearish setup on the hourly chart may face abandonment if prices recover above the Ichimoku cloud, which could revive the bullish attitude towards a rise to $100K.
XRP’s ‘Death Cross’
XRP’s recovery from low price levels on April 7 seems to have lost momentum as well, with prices retreating beneath the 50-day Simple Moving Average (SMA).
Crucially, the 50-day SMA appears poised to cross under the 200-day SMA, signaling a death cross, which is a long-standing bearish indicator.
The ominous approach of this pattern, in light of the overall downward trend seen since mid-January, raises concerns about further sell-offs. It’s important to note that the death cross’s success rate in predicting price movements has been inconsistent in both crypto and conventional markets.
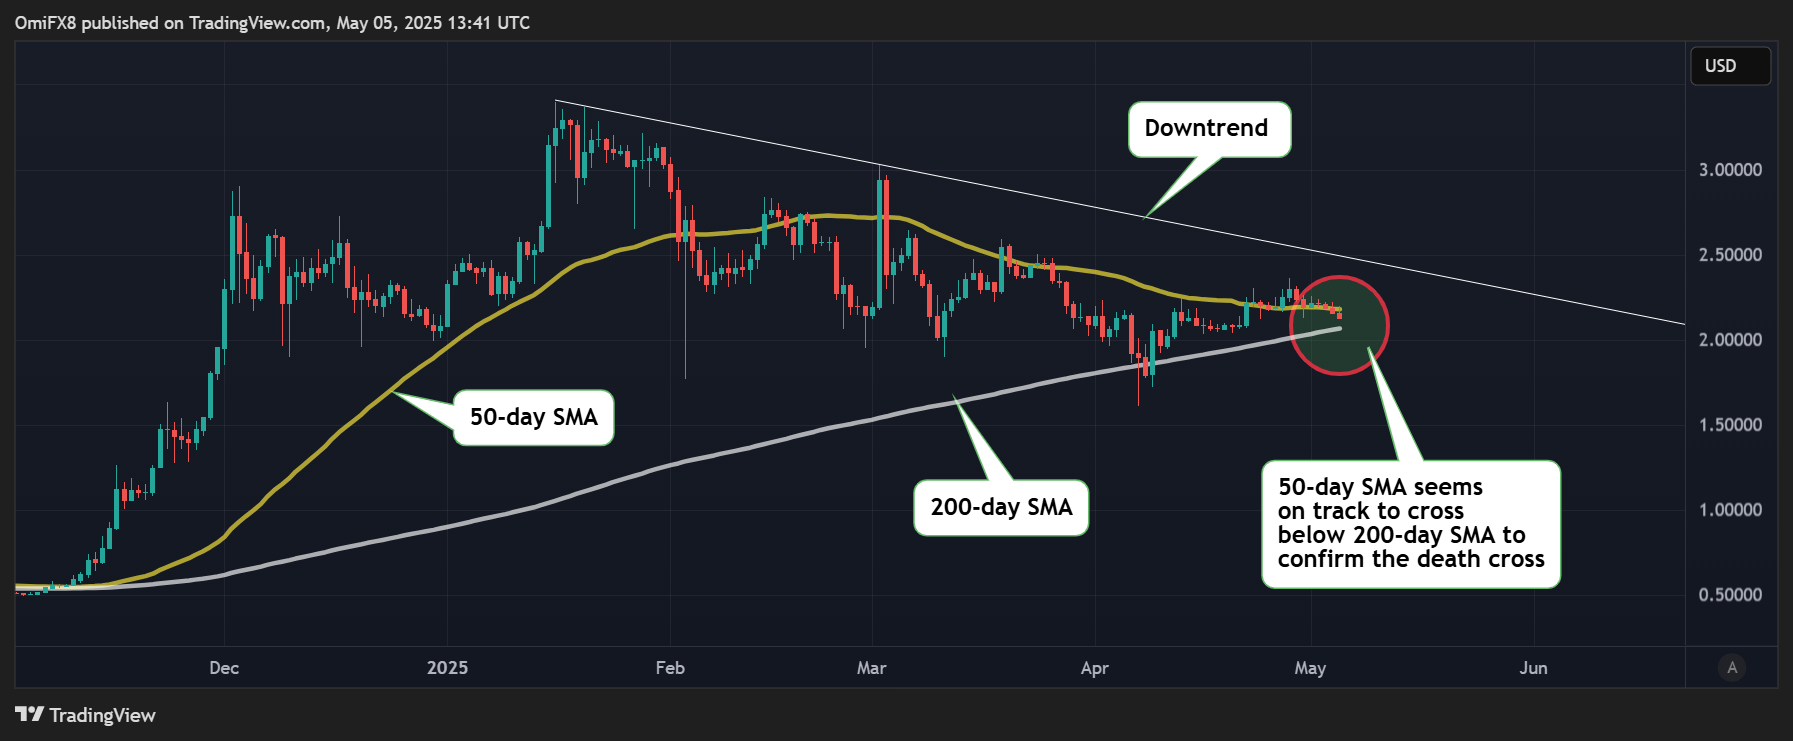 XRP’s Daily Chart. (TradingView/CoinDesk)
