Bitcoin Momentum Indicator Turns Bullish, Fostering $140K-$200K Price Outlook
A crucial momentum indicator has shifted positively, potentially leading to significant Bitcoin price increases.
What to Know:
- A key momentum indicator, the MACD histogram, has turned bullish, aligning with forecasts of a Bitcoin rally to $150,000-$200,000.
- Bitcoin’s MACD crossing above zero indicates renewed bullish momentum, mirroring patterns from early 2023 and mid-2024.
This is a daily technical analysis by an analyst on CoinDesk.
The Moving Average Convergence Divergence (MACD) histogram indicates the difference between the MACD line and its signal line. When the MACD histogram shifts positively, it signals a transition from bearish to bullish momentum, interpreted as a buy signal by many traders.
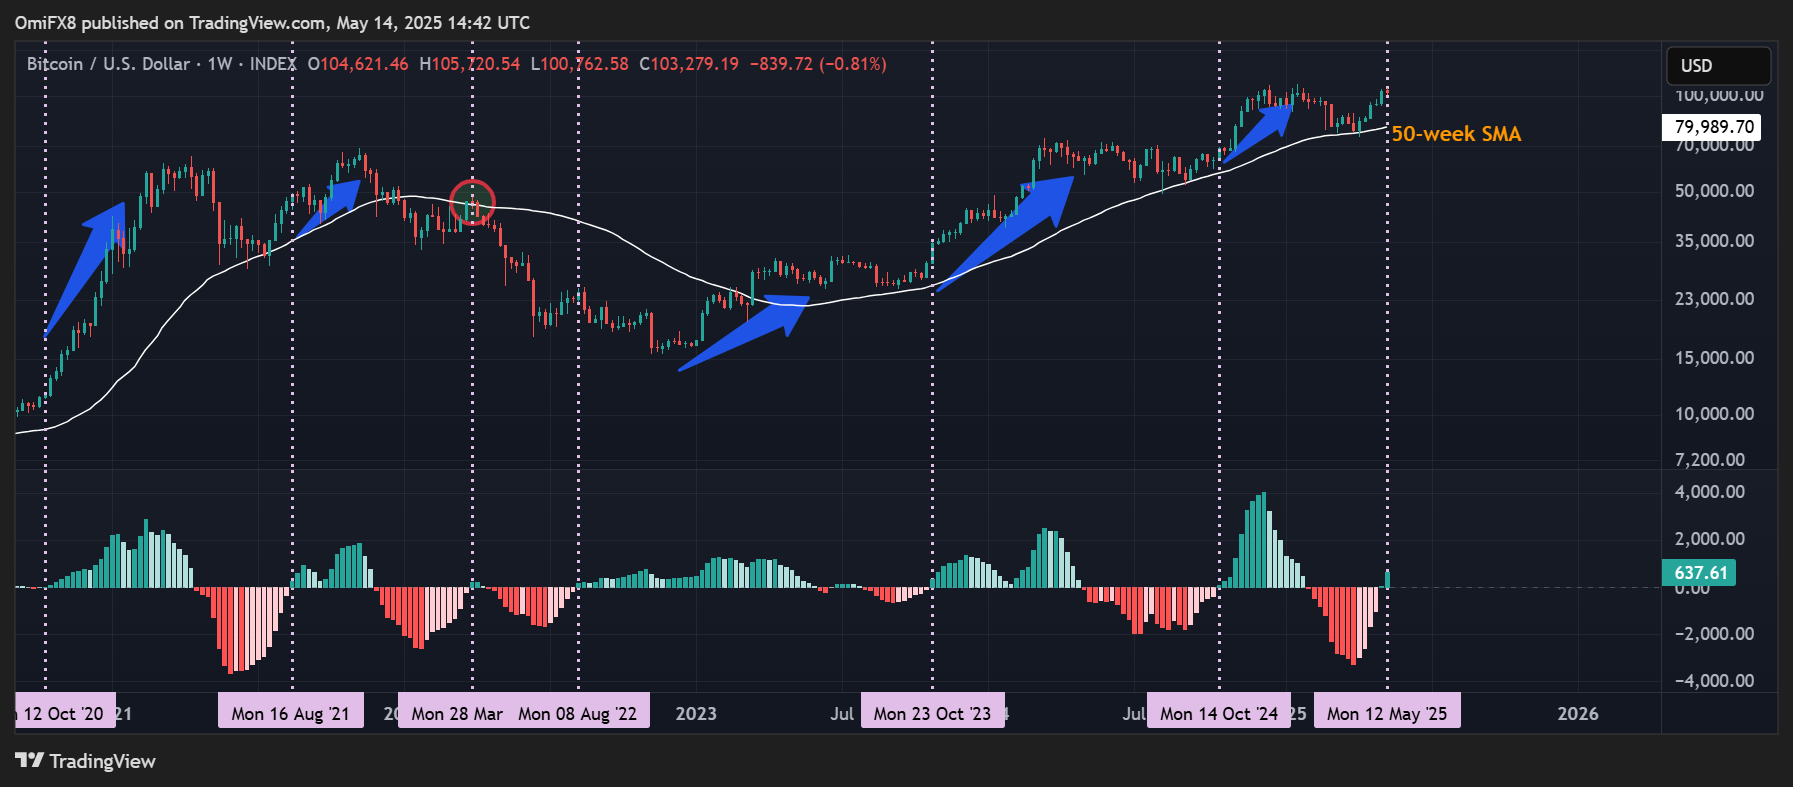
BTC’s weekly MACD histogram
BTC’s weekly chart with the MACD histogram.
This recent bullish indicator coincides with Bitcoin’s rebound from the 50-week simple moving average, akin to patterns observed in prior bullish phases. The MACD’s positive shift has historically preceded major price rallies, suggesting a possible strong upward move ahead.
Analysts project that Bitcoin might elevate to between $150K-$200K, driven by institutional demand, as noted by research shared with CoinDesk.
