


Overview
Bitcoin (BTC) and MicroStrategy (MSTR) have flashed concurrent bullish signals, suggesting a significant potential uptrend in the market. Other indicators also support this improvement, although market corrections could occur. Here’s what to know:
- Both Bitcoin and MSTR show bullish patterns that could lead to a trend reversal favoring buyers.
- Despite the encouraging signals, fluctuations may present opportunities for profit-taking.
Bullish BTC signals
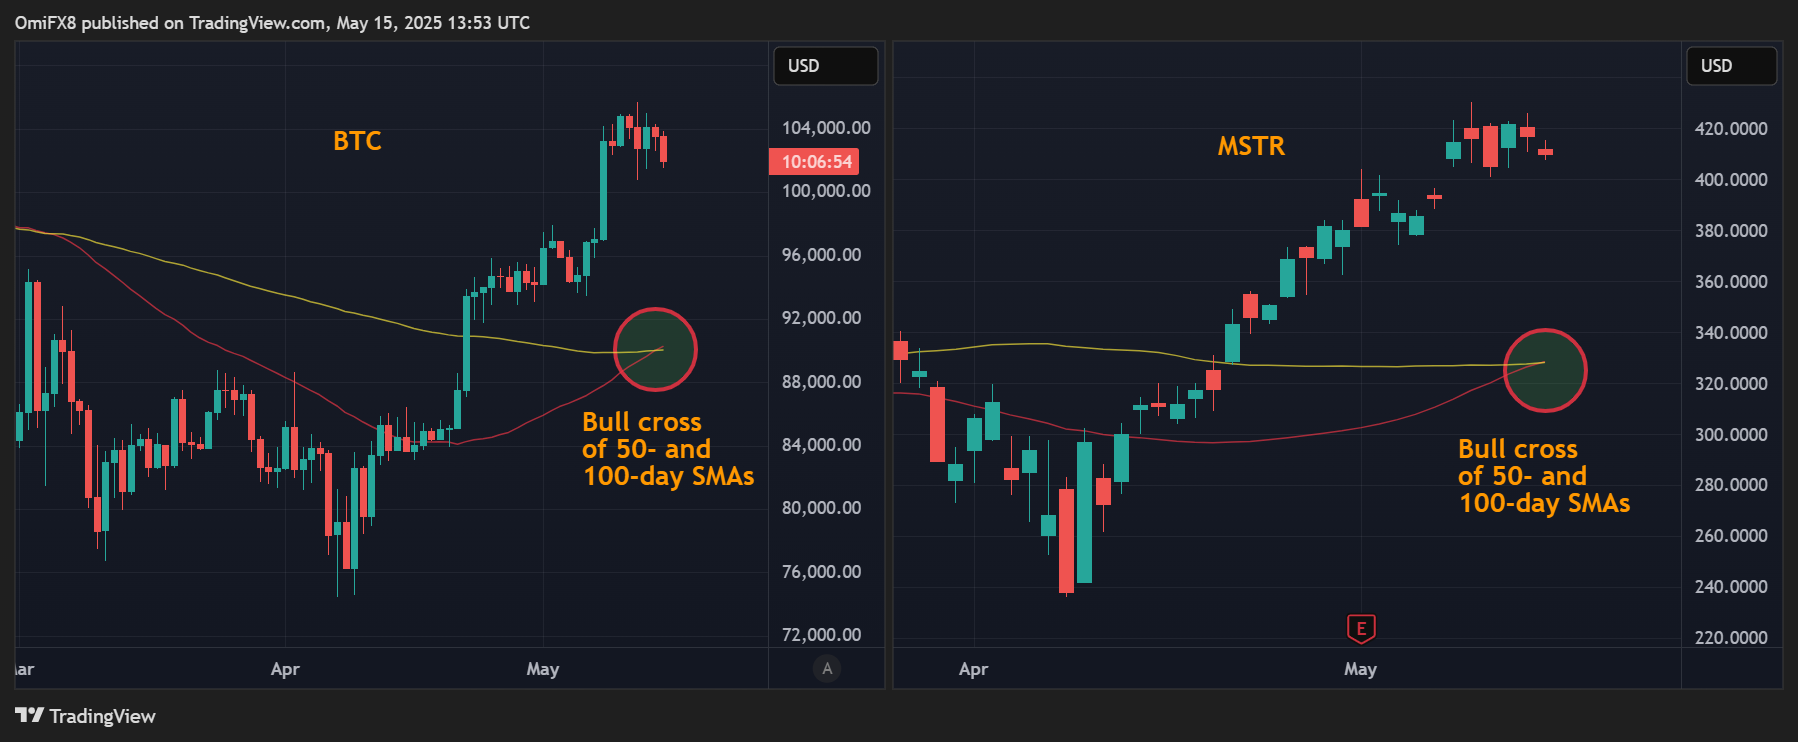
Bullish BTC signals are coming from Bitcoin, Strategy price charts.
Market Analysis
A notable indicator of this potential is the crossing of the 50-day and 100-day Simple Moving Averages (SMA) for both Bitcoin and MSTR, a technical pattern signaling a bullish crossover. This suggests that short-term price movements may start to outperform long-term trends, possibly indicating the emergence of a new bull market.
 BTC and MSTR’s daily charts
BTC and MSTR Daily Charts. (TradingView/CoinDesk)
BTC and MSTR’s daily charts
BTC and MSTR Daily Charts. (TradingView/CoinDesk)
Current evaluations align with indicators such as the MACD, hinting that upward movement may be more likely than not. However, a temporary drop below $100,000 might still be in the cards as significant market players exhibit cautious behavior.
 BTC’s hourly price chart
. (TradingView/CoinDesk)
BTC’s hourly price chart
BTC’s hourly price chart. (TradingView/CoinDesk)
Recent analyses reveal that Bitcoin’s price currently fluctuates between $101,000 and $107,000. A downward shift could trigger increased selling, potentially leading to support levels around $98,000.
