Shiba Inu's Price Surges Before Sharp Decline Amid Whale Activity
An exploration of Shiba Inu's recent price fluctuations and the impact of whale trading patterns that suggest imminent bearish trends.


Shiba Inu’s price swings demonstrate quick gains followed by sharp downturns as on-chain data indicates whales are pulling back, suggesting short-term bearish pressure.
Key Takeaways:
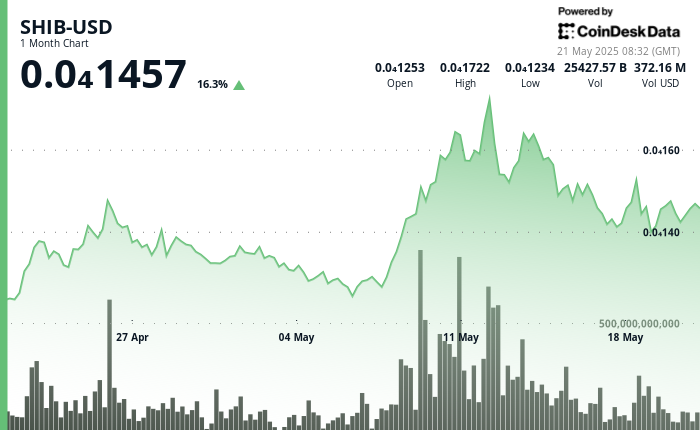
- Shiba Inu (SHIB) surged 3.18% on significant volume but pulled back to $0.00001492 before a 1.9% dip in the final trading hour.
- Over 25.74 trillion SHIB tokens are currently held in the essential support/resistance zone of $0.000014-$0.000015 by 34,170 addresses.
- Despite a remarkable 106,040% spike in the burn rate within 24 hours, SHIB is struggling below a major descending trendline resistance.
Shiba Inu has exhibited conflicting signals in the market recently. While initially showing bullish momentum backed by heavy volume, the token faced intense selling pressure soon after.
According to technical analysis, SHIB is consolidating below crucial resistance levels, with traders watching the price range of $0.00001450-$0.00001600 for breakout signals. On-chain metrics reveal a worrying trend, signifying a 311% decline in whale netflows and a 68% fall in active addresses since December.
The current market structure indicates the potential for continued price oscillation likely to herald a significant move, with necessary confirmation requiring a breakthrough above resistance around $0.00002044.
Should the price rise sharply, it may encounter significant selling pressure as over 80% of investors are currently at a loss with only 17% in profit.
Analysts remain split on SHIB’s imminent future; while some perceive hints of bullish moves, others caution against fading fundamentals.
Technical Analysis Highlights:
- SHIB saw strong volume support at $0.00001417 during peak trading hours, sustaining buying momentum.
- Significant volume spikes were reported from 04:00 to 06:00, surpassing $700 million, validating the initial bullish wave.
- The trading hour ended with a swift 1.77% drop from the peak as traders took profits.
- A bearish EMA stack has emerged, with the price struggling to reclaim the 50-day moving average.
- An hourly chart reveals a descending channel pattern characterized by lower highs and lows indicating short-term bearish sentiment.
- A notable surge exceeding 110 billion in trading volume coincided with a critical breakdown below essential support levels.
