Bitcoin's 50-Day Average Breaks New Records Amid Price Adjustments
Bitcoin's 50-day simple moving average has reached an all-time high, signaling bullish trends, yet the shrinking gap between the price and the average hints at a potential correction.


What You Need to Know:
- Bitcoin’s 50-day simple moving average (SMA) reached a record high, indicating a bullish outlook in the market.
- However, the decreasing gap between Bitcoin’s price and the 50-day SMA suggests a likely price correction.
- Recent metrics show that holders are starting to take profits, which aligns with the caution reflected in the price-to-SMA spread.
The widely monitored 50-day simple moving average of Bitcoin’s BTC price is sending mixed messages:
- The measure skyrocketed into six figures for the first time, signaling a stronger market sentiment around the leading cryptocurrency by market cap. Similarly, the price has fallen to $105,000, tightening its distance from the 50-day SMA that might hint at a price correction of at least 10%.
The SMA has exceeded its previous record of approximately $99,300 noted on January 31, as per data from TradingView. Analysts use this average as a market trend indicator and a potential area for buying and selling pressure.
Interestingly, this spike in the average comes just weeks after the spot price reached an all-time peak of over $111,000 on May 22, likely fueled by significant inflows into spot ETFs and possibly a wider move away from U.S. assets.
Despite those gains, momentum has faded, with current prices consolidating around $105,000, tightening the margin over the 50-day SMA. This indicates a weakening buyer momentum, heightening chances of a pullback.
The cautious sentiment indicated by the narrowing price-to-SMA spread coincides with on-chain data which reveals increased profit-taking activities among holders.
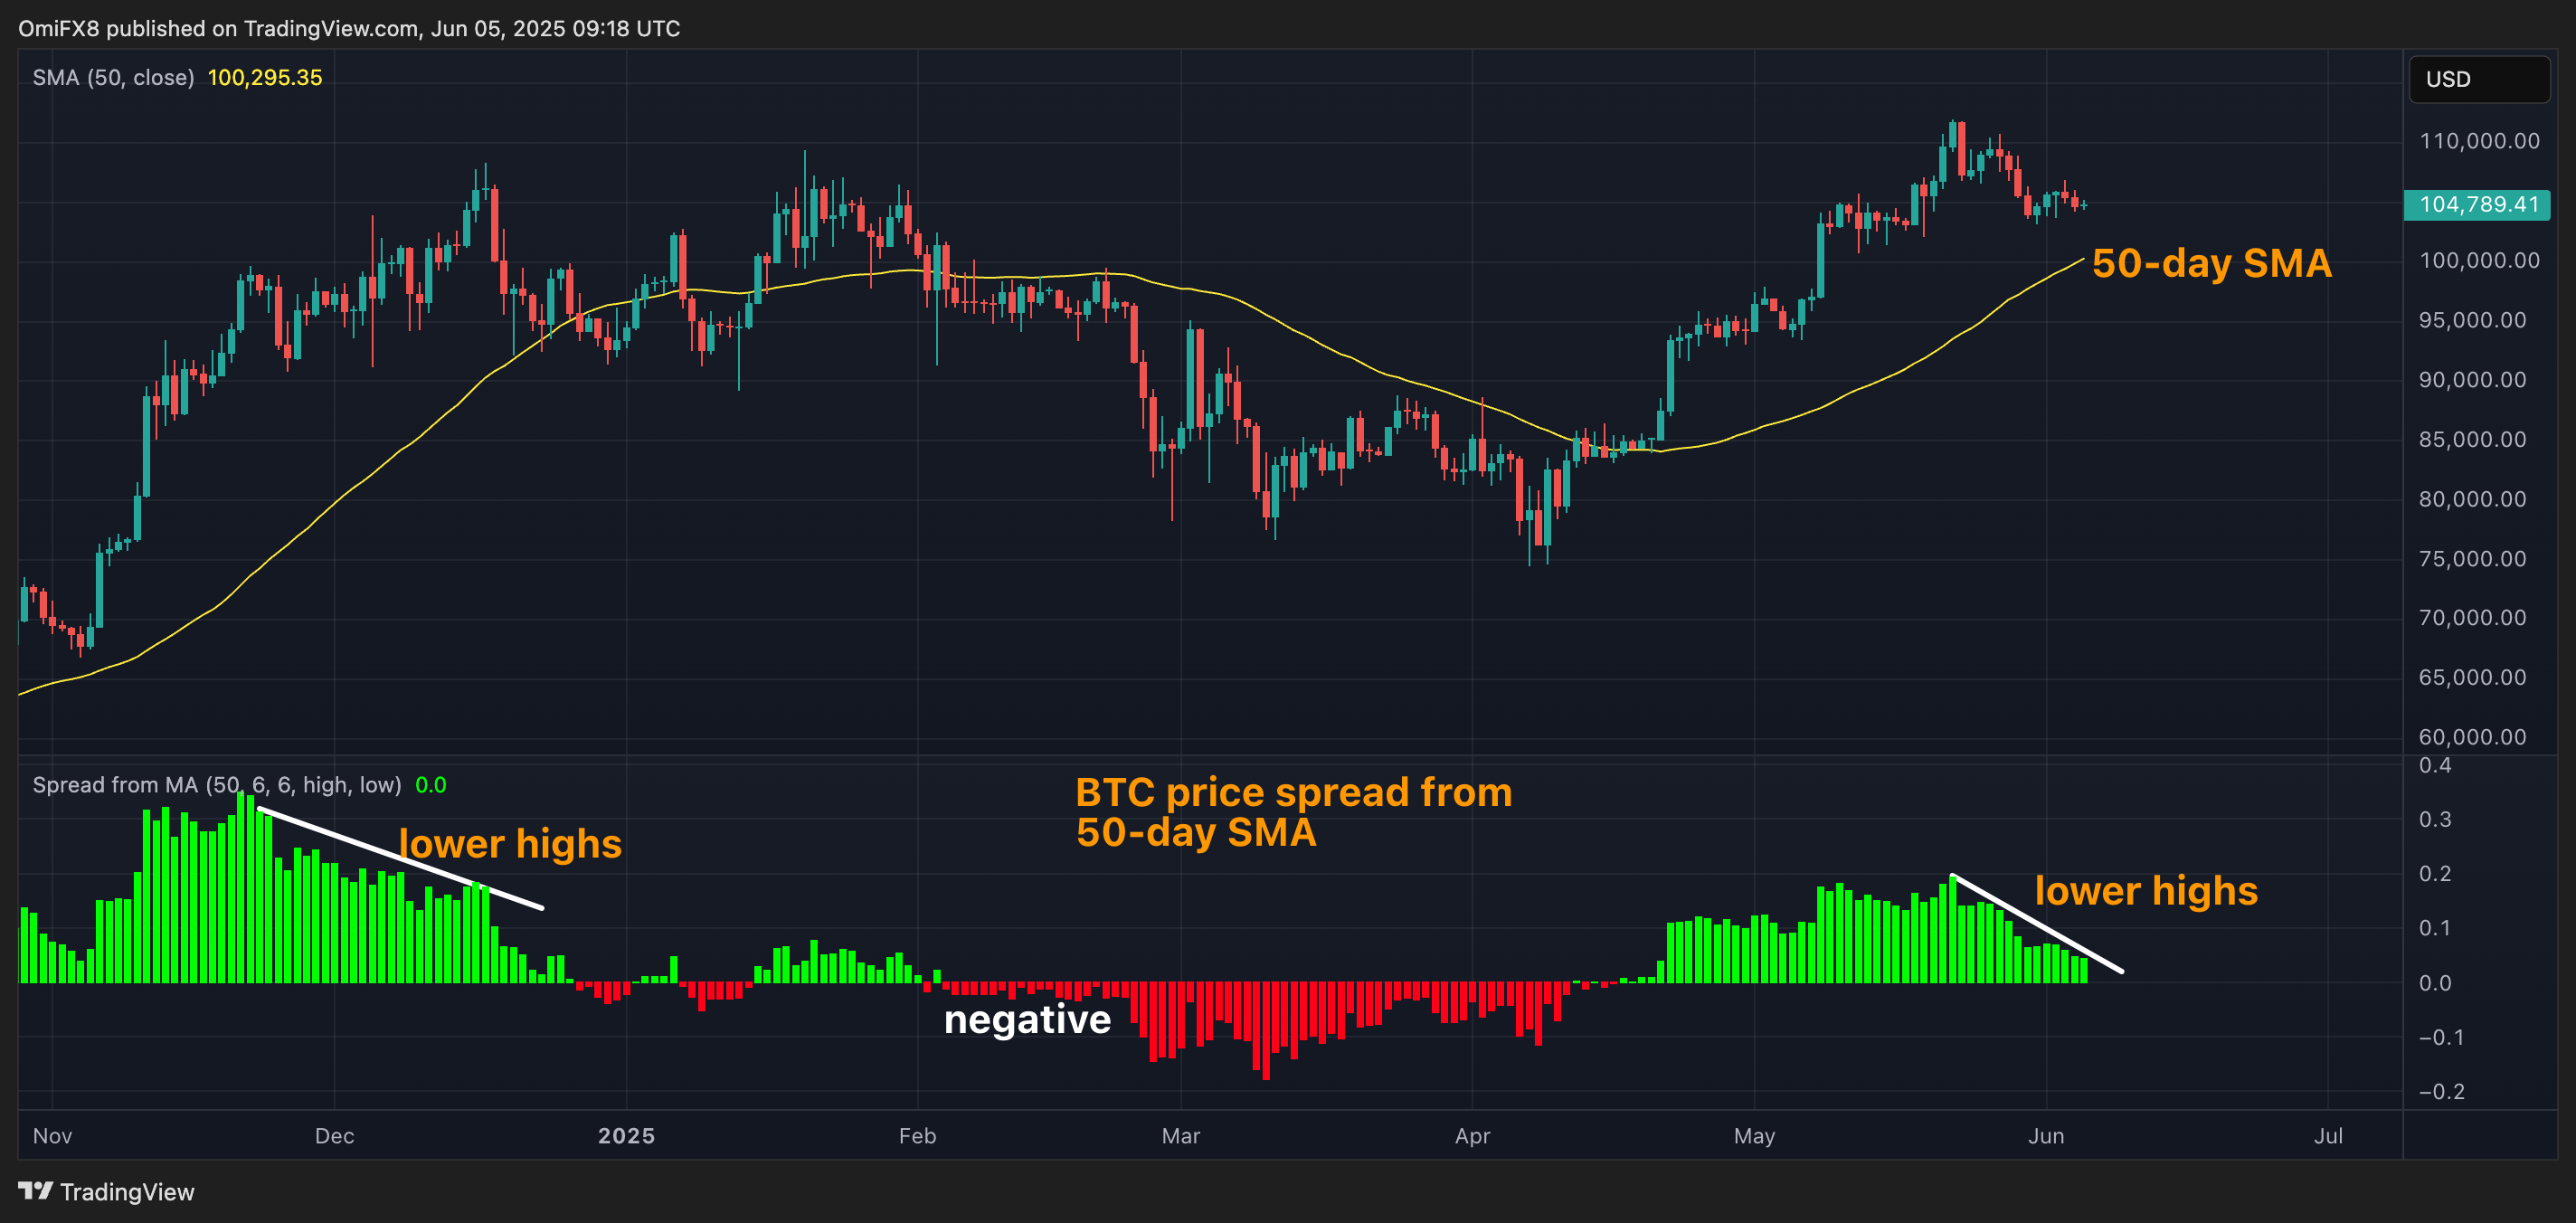
The lower section of the daily chart illustrates the divide between the spot price and the 50-day SMA where positive trends indicate strengthening buyer momentum, while negative measures suggest the opposite. The distance has shown signs of tightening since May 22, pointing to a potential downturn. Should a correction occur, the 50-day SMA is poised to offer support at $100,295.
A similar scenario was witnessed back in December, when the uptrend above $100,000 exhausted. This contraction eventually turned negative in February, leading to weeks of selling activity driving prices down to $75,000.
