


Overview of BNB Price Changes
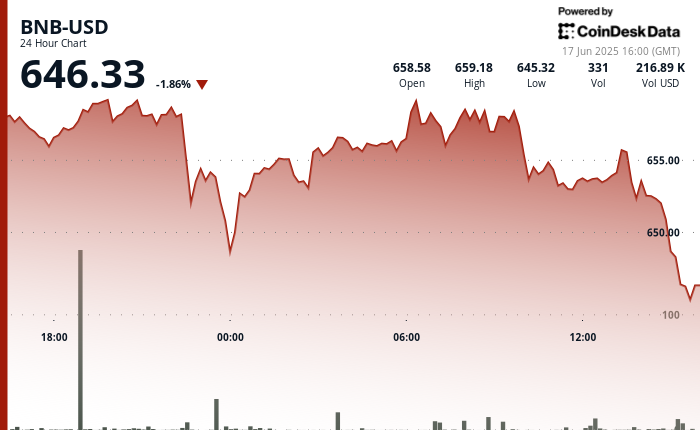
BNB, the digital asset of BNB Chain, has seen a 1.7% decline in the last 24 hours, fluctuating between $659 and $646. This movement has come in the wake of rising market uncertainty as tensions escalate in the region of Israel and Iran. Additionally, U.S. President Donald Trump has convened the National Security Council in response to the situation.
BNB Price Chart
Key Insights
- The price action has shown BNB trading just below a critical resistance level, with $647 marking a current support point, according to technical analysis from CoinDesk Research.
- The fundamentals of BNB Chain remain robust, having processed over $100 billion in decentralized exchange (DEX) volumes last month.
- The market is closely monitoring upcoming announcements from the Federal Open Market Committee (FOMC), which may signal shifts in interest rates and liquidity, particularly affecting risk-sensitive assets like cryptocurrencies.
Technical Analysis
- A significant support level has developed at $647, verified by volume surging to 82,311 tokens, indicating high trading activity.
- Resistance levels lie between $658 and $659, with the price facing rejections in this range.
- Short-term analysis shows potential for a local resistance around $655.70 to $655.80. If bearish sentiment persists, further declines could occur.
Note: Parts of this analysis involve AI-generated content along with editorial review for accuracy.
