Shiba Inu Investors Accumulate 10 Trillion Tokens as Prices Show Signs of Recovery
Whale activity resulted in a significant price rebound for SHIB, marking a robust accumulation phase amid a stabilizing crypto market.


Key Takeaways:
- Shiba Inu (SHIB) whales acquired 10.4 trillion tokens, exceeding $110 million, marking the largest daily buy in five months.
- The price of SHIB surged 17% from a previous low, as the crypto market stabilized following geopolitical tensions.
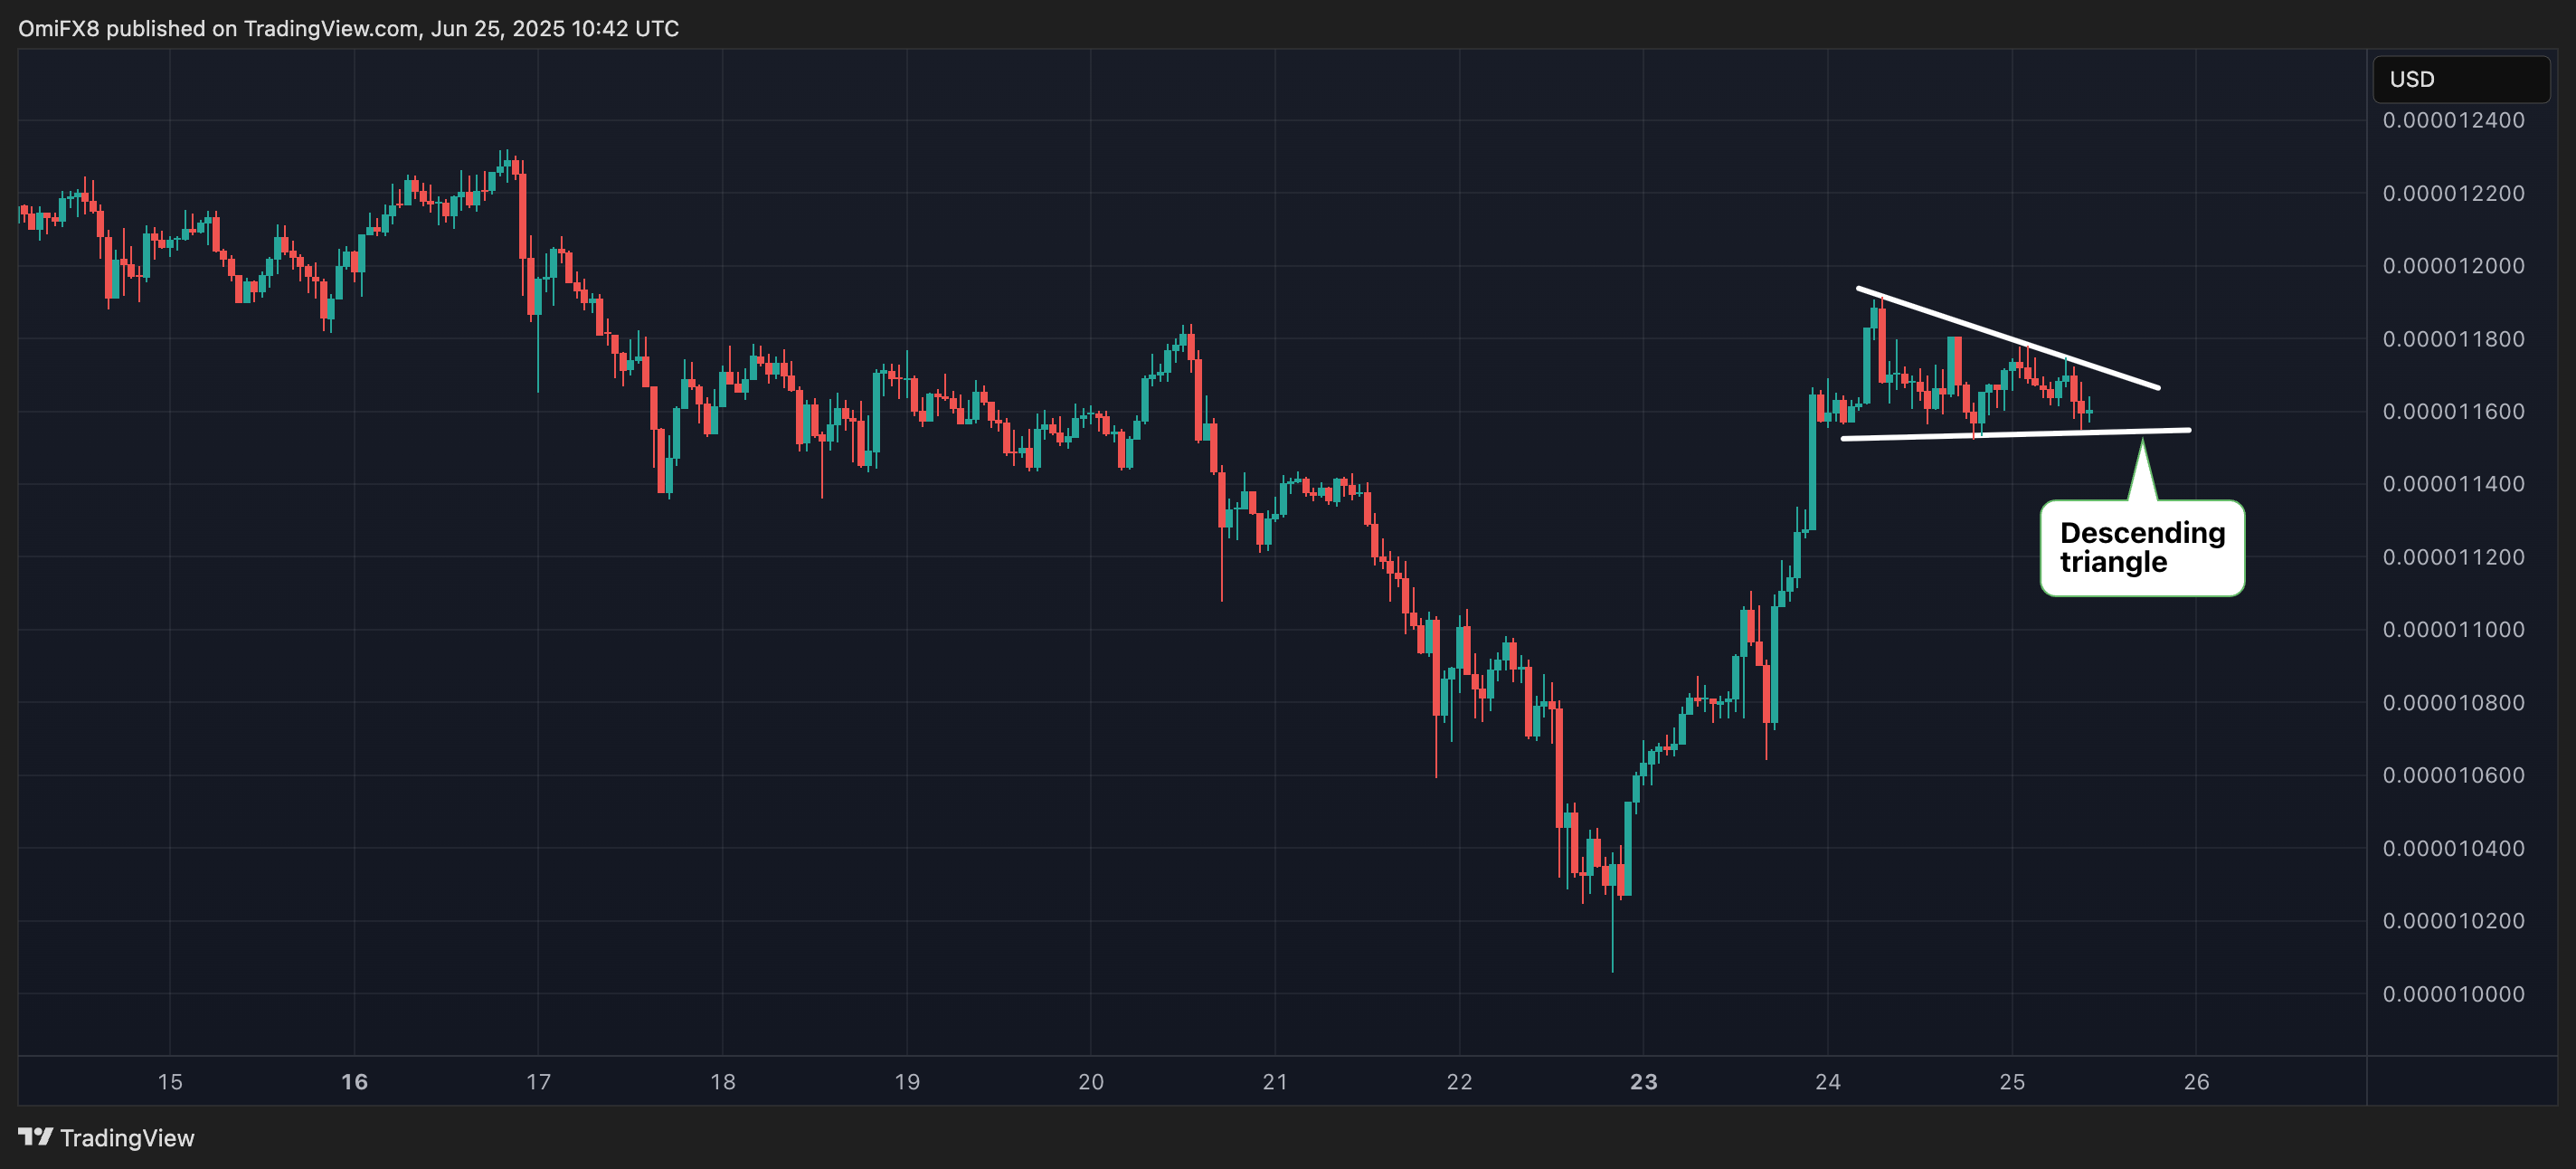
- Price patterns indicate potential for further gains if the $0.00001175 resistance is breached, despite recent consolidation within a descending triangle.
Overview: SHIB whales capitalized on a significant dip this past week, with prices falling to a 16-month minimum of $0.00001005. Recent activity shows that major investors accumulated 10.4 trillion SHIB tokens, valued at over $110 million.
This surge in whale purchases has contributed to SHIB’s recovery, reflected in a 17% price increase from the 16-month low reached on Sunday. Overall market conditions have shown signs of stabilizing post-initial reactions to tensions in the Middle East, with BTC trading around $106,000 after dipping below $100K.
Market analytics indicate that SHIB maintains a positive posture, with repeated higher lows suggesting an uptrend. Recent data shows substantial support forming at $0.00001158 during the trading period from June 24, 09:00 to June 25, 08:00, with volumes reaching 439 billion, far exceeding the daily average.
This behavior hints at a promising upside momentum if $0.00001175 resistance is decisively overcome. Currently, SHIB is trading at approximately $0.00001162 across major trading platforms.
AI Insights:
- Persistent higher lows point to an accumulation trend and possible upward movement if $0.00001175 is surpassed.
- In the hour leading up to June 25, SHIB increased slightly from $0.00001169 to $0.00001171, a gain of 0.2%.
- Notable trading activity occurred between 07:25 and 07:27, reaching 12.36 billion SHIB as prices touched $0.00001175.
- The upward movement has paused amid the establishment of a descending triangle, where a breakout would signify a bullish recovery while a breakdown would indicate a potential downward trend.
