
Analysis of Bitcoin's Potential Resistance Levels: Is It $115K or $223K?
This article explores the possible resistance thresholds for Bitcoin, based on technical analysis and historical growth patterns.


Analysis of Bitcoin’s Potential Resistance Levels: Is It $115K or $223K?
The examination of both linear and log-scaled price charts unveils potential resistance points for Bitcoin (BTC).
Key Insights:
- A trendline that links the highs from 2017 and 2021 points to a resistance level around $115,300 when viewed on a linear scale.
- Conversely, a log-scaled analysis suggests a significantly more robust resistance at approximately $223,000, which is in line with Bitcoin’s historical growth trajectory.
Daily Market Overview
The Bitcoin market appears largely positive, with prices remaining above $100,000 for almost two months, excluding just one day. Analysts predict resistance could fall between $140,000 to over $200,000.
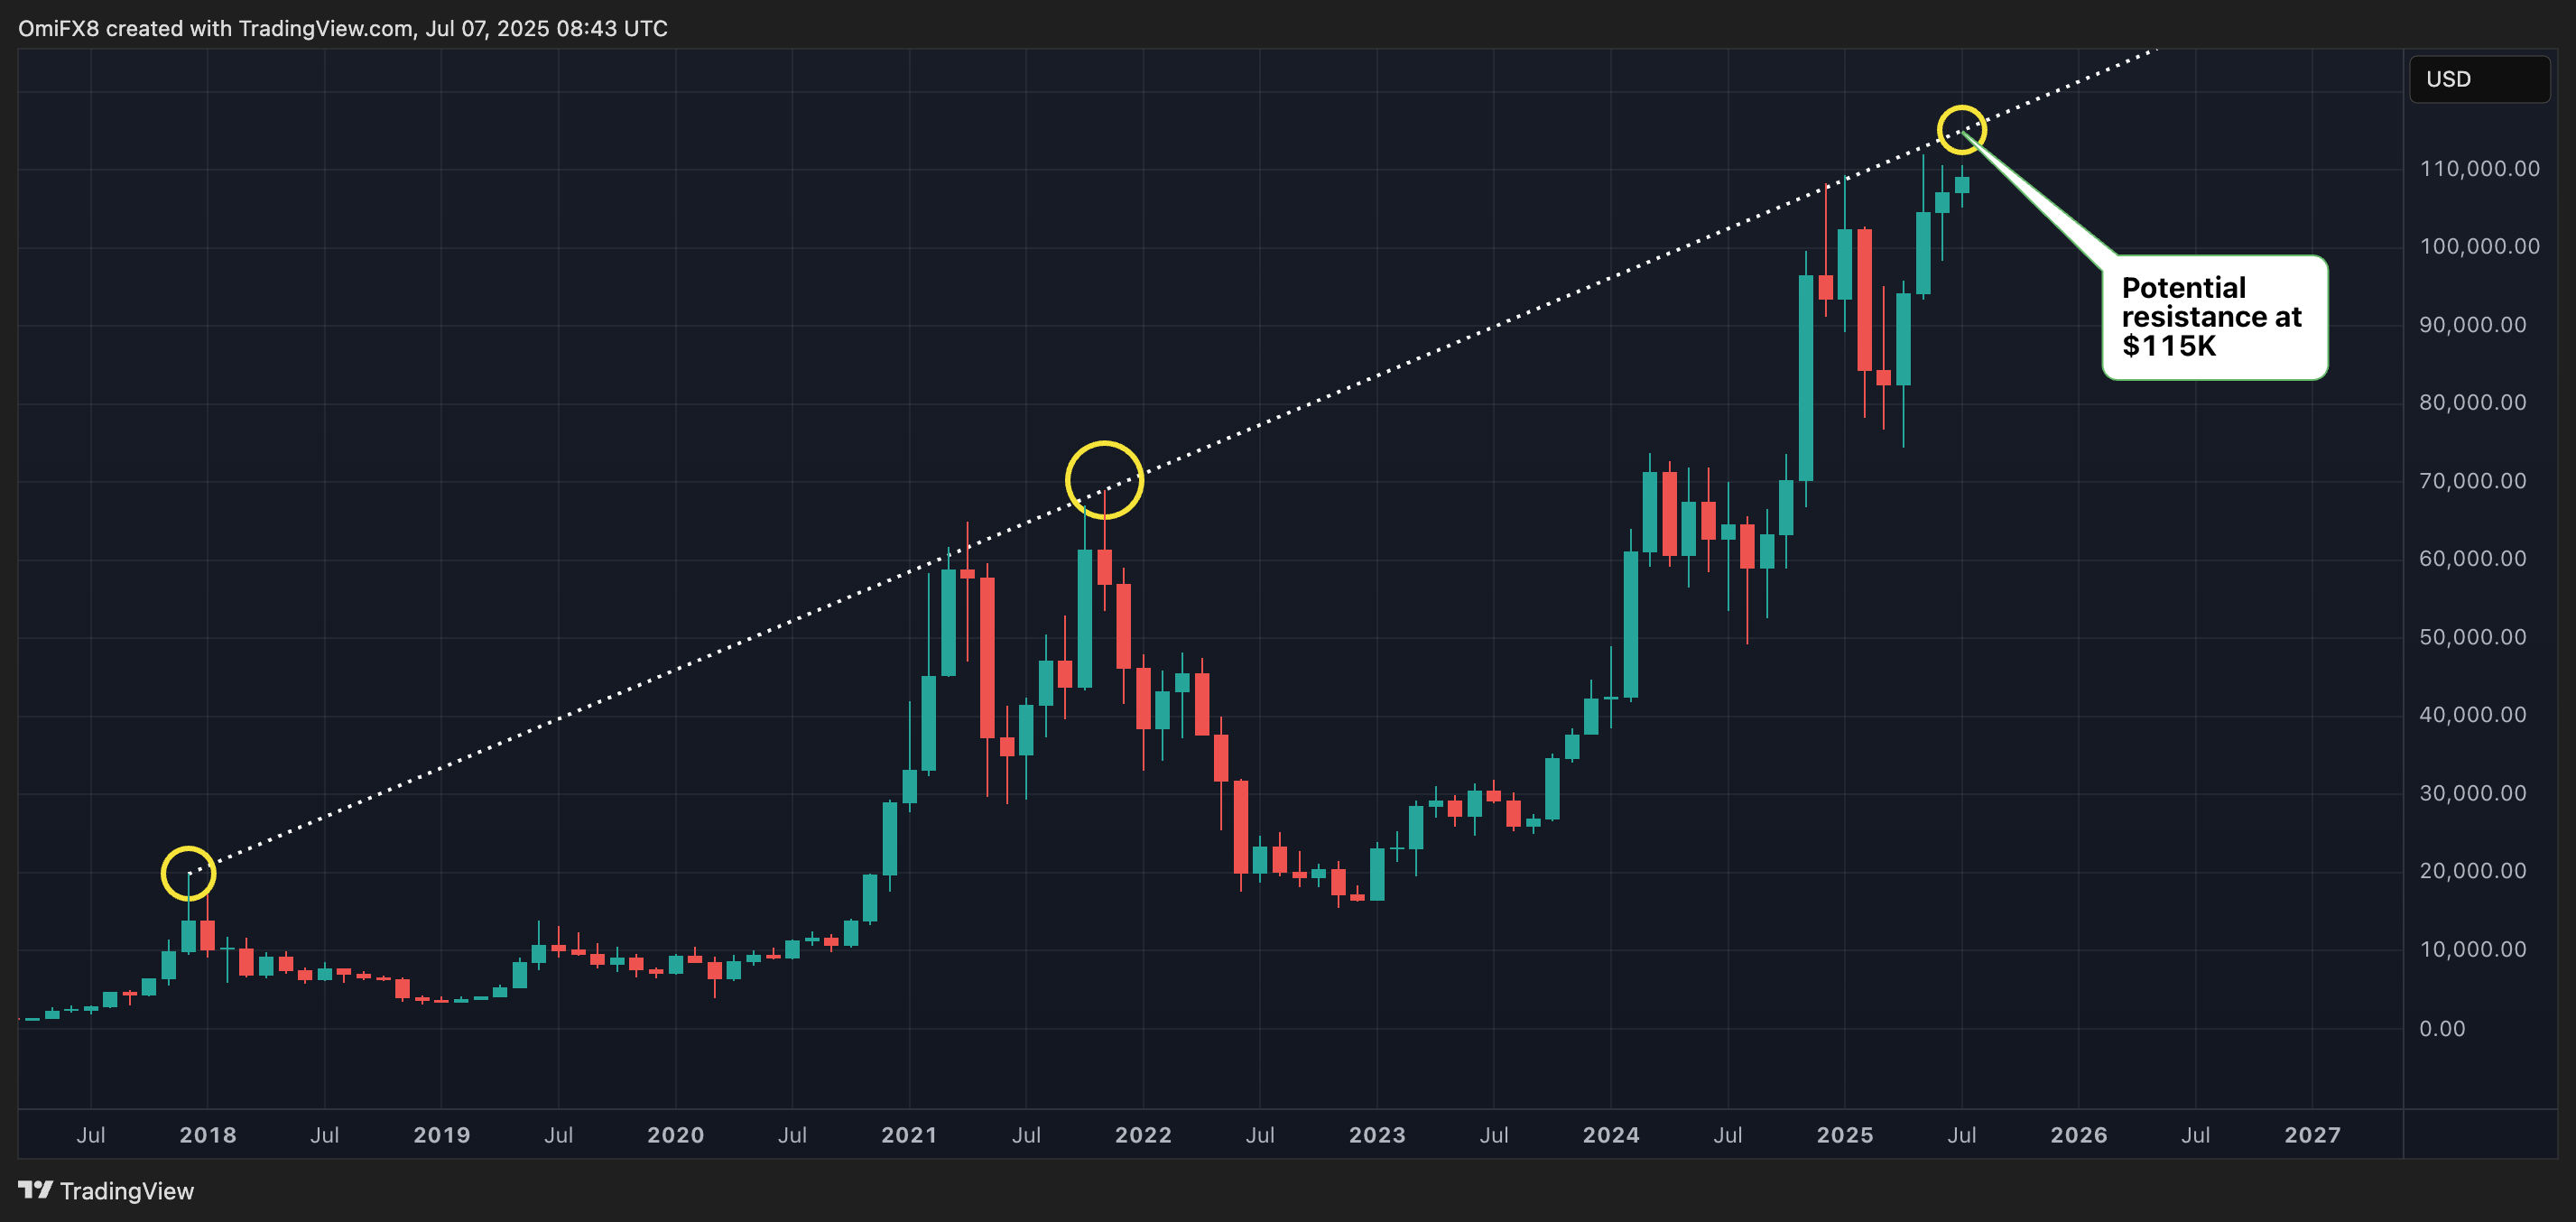 Identifying BTC’s bull market resistance.
Description: Identifying BTC’s bull market resistance. (ianproc64/Pixabay)
Using trendlines that link significant highs and lows on price charts provides visual indicators about trading momentum, allowing traders to spot support and resistance boundaries.
Connecting the $20,000 peak from 2017 to the nearly $70,000 high of 2021, the trendline indicates resistance at about $115,300, according to TradingView data.
Additional Resistance Insights
The initial chart utilized is linear-scaled, appropriate for observing short-term price shifts. However, relying on the log-scaled chart results in more credible resistance levels, reflecting Bitcoin’s exponential growth pattern during bull markets.
By connecting the highs from both the 2017 and 2021 periods on a log-scaled chart, we can see that resistance aligns closely with about $223,000, highlighting significant potential price movements.
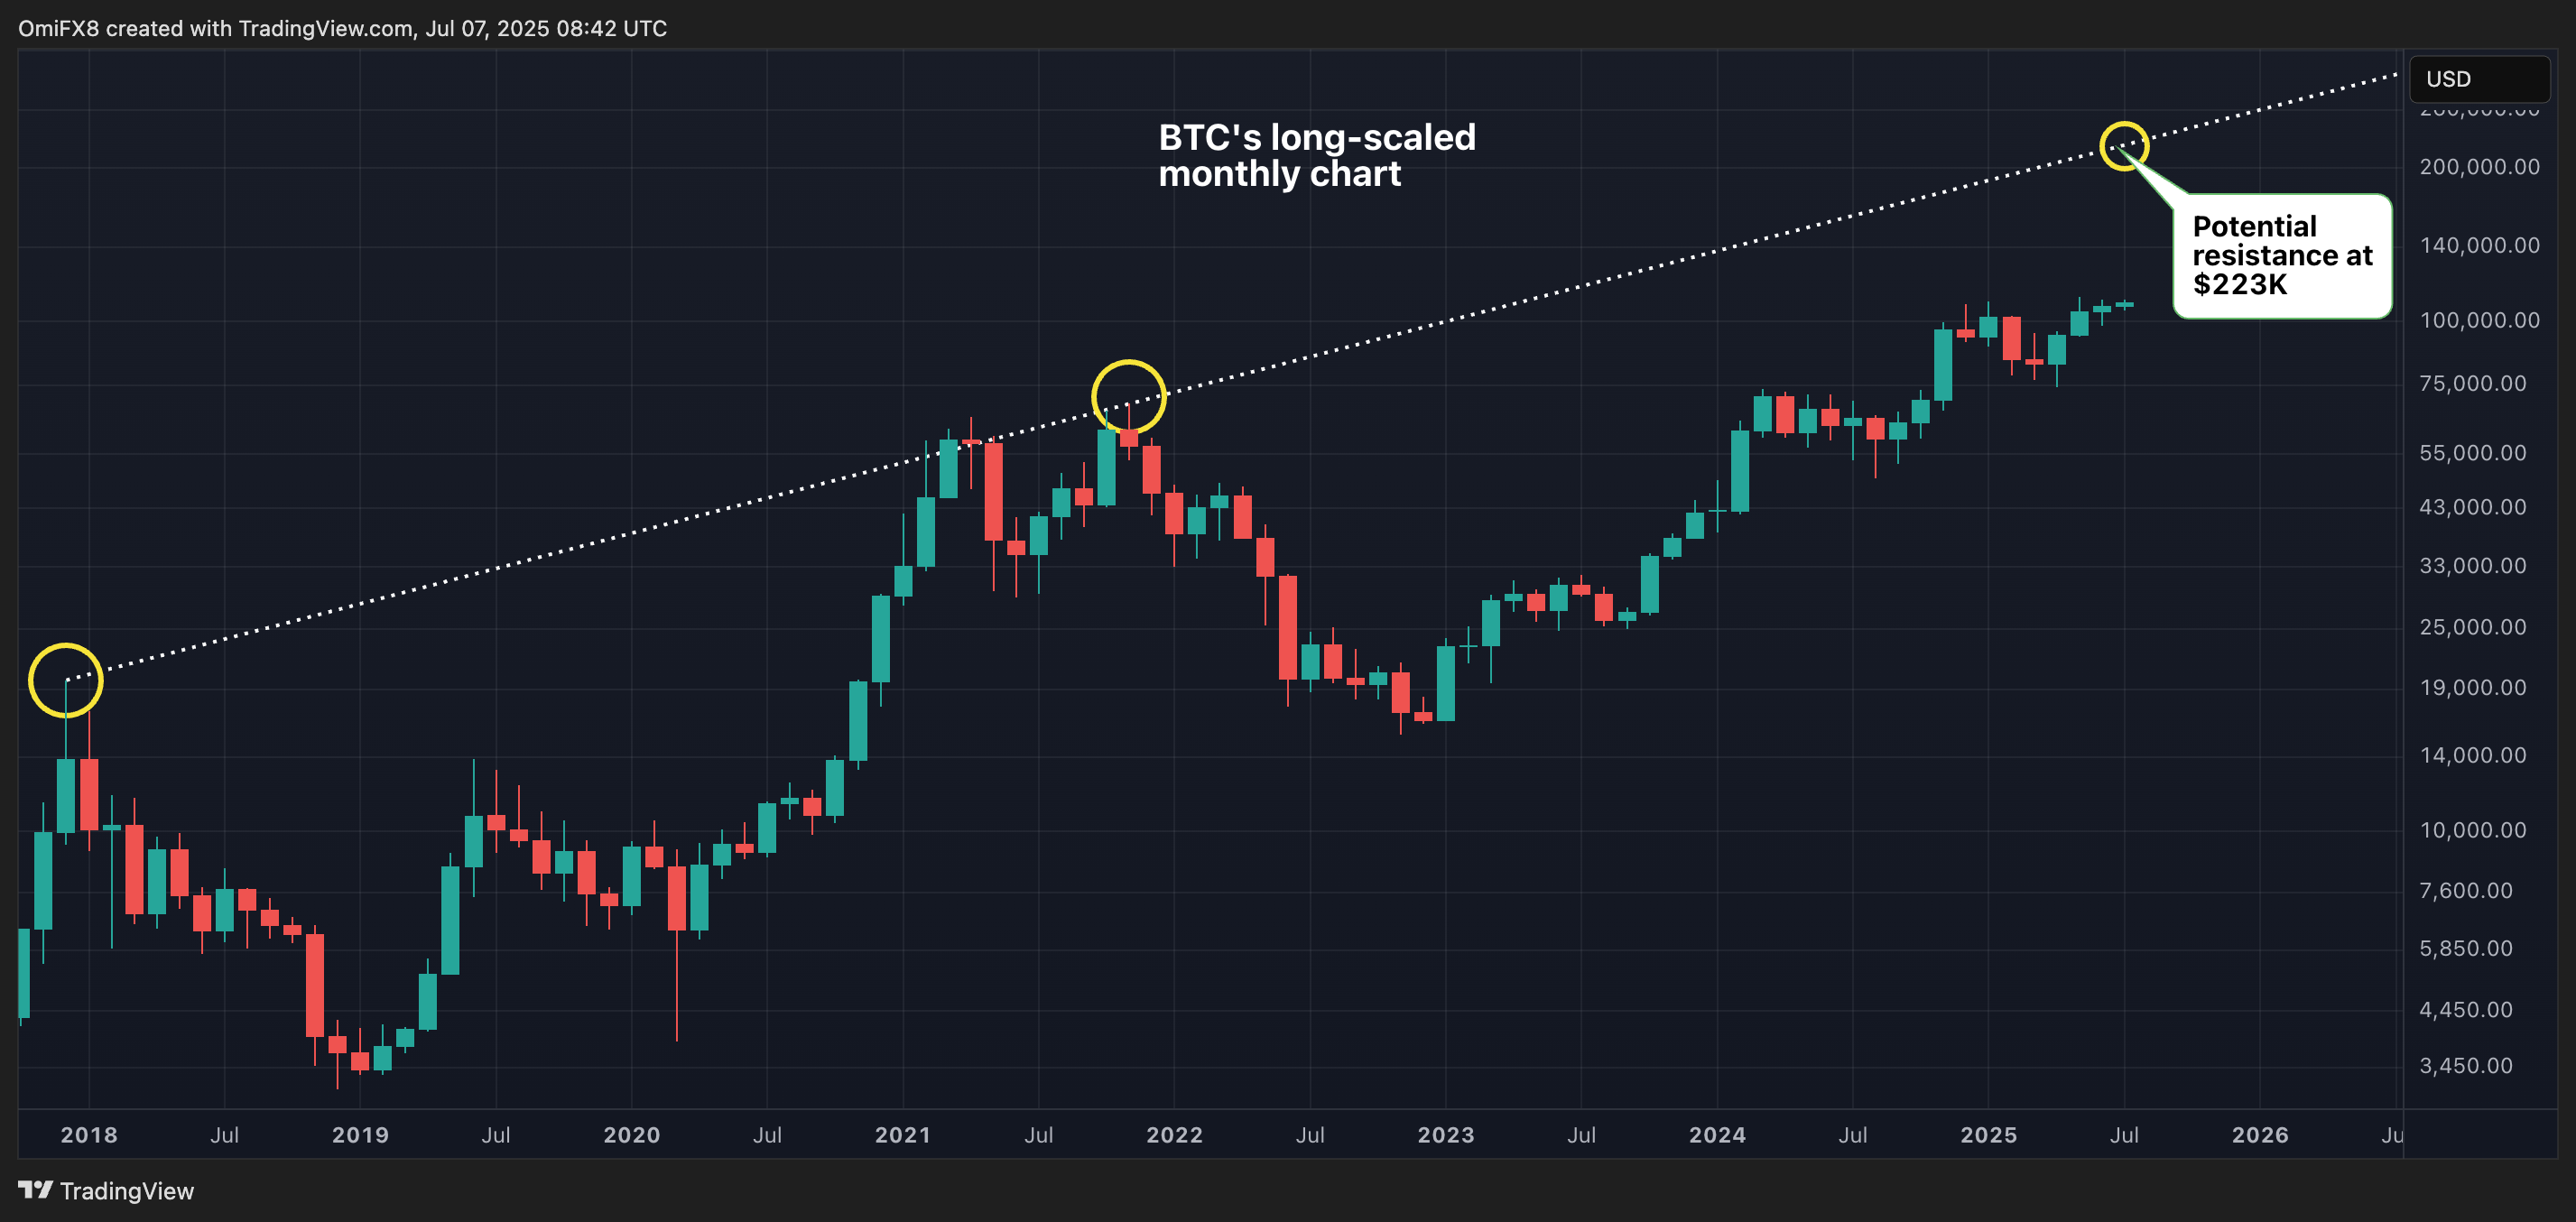 BTC’s log-scaled monthly chart.
Description: BTC’s log-scaled monthly chart. (CoinDesk/TradingView)
This log-scaled trendline provides higher reliability as it adjusts for large percentage changes, making resistance levels more relevant and actionable for traders.
