Solana Surpasses All Chains in Monthly Active Users, Data from Artemis Reveals
In June 2025, Solana matched the combined monthly active user counts of all Layer 1 and Layer 2 chains while leading in network revenue for three consecutive quarters.


Solana Surpasses All Chains in Monthly Active Users, Data from Artemis Reveals
Solana matched the combined monthly active addresses of all Layer 1 and Layer 2 chains in June 2025, and it has also led in network revenue for three quarters in a row.
Key Highlights:
- In Q2 2025, Solana generated over $271 million in network revenue, leading all chains.
- A report from Artemis indicates that in June, Solana had as many monthly active addresses as the total of all other L1 and L2 chains combined.
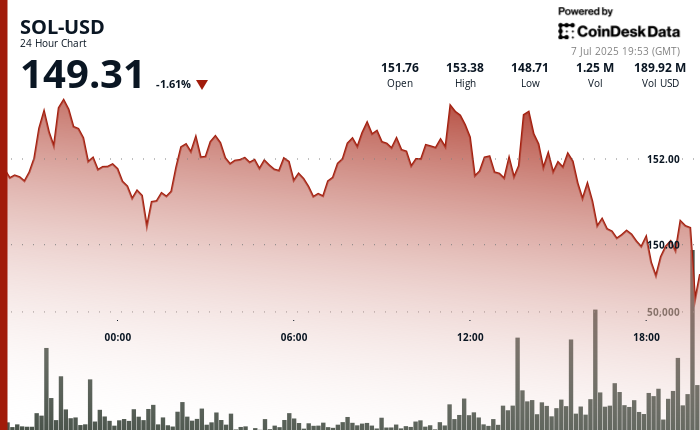
- After a fall to $149, SOL managed to defend this level, showing resilience amid selling pressure.
Solana (SOL) fell 1.45% recently, dropping from $151.41 to $149.21. It traded within a wide amount, peaking at $153.67 before a sudden sell-off that brought it below the critical psychological threshold of $150. Increased trade volumes indicate that buyers emerged at the $149 support level, allowing SOL to recover slightly to $149.31.
Despite the current market’s short-term weakness, recent data underscores Solana’s growing network strength. Data from Artemis shows impressive user growth alongside Solana’s record network revenues, surpassing previous performance benchmarks.
The metrics presented confirm Solana’s strong position within the blockchain sector, especially regarding real user activity and overall transaction volumes. The continuous rise in network revenues reinforces the sustainability of Solana’s pricing model, suggesting that as development continues, the long-term value could stabilize despite potential resistance in the short term.
Technical Analysis Overview:
- SOL plummeted from $151.41 to $149.21 over 24 hours.
- The trading range revealed volatility, with peaks at $153.67.
- Resistance appeared at $153.67 after a notable trading volume.
- A downturn occurred past the $150 threshold, indicating bearish sentiment.
- Final hour observations indicated buyers defended the $149 range.
Disclaimer: The contents were assisted by AI tools and vetted by an editorial team to ensure their accuracy and standards compliance.
