


Overview
On Wednesday, MicroStrategy’s (MSTR) stock plunged to a five-month low of $326, trading approximately 4% beneath the critical 200-Day Moving Average (DMA) at $340. This threshold, often monitored by investors for indications of market shifts, provides insights into long-term trends; typically, stocks exceeding their 200-DMA indicate a bullish pattern.
Market Trends
- MSTR is currently down 30% from its peak of $457 last month and significantly lags behind Bitcoin, which has only dipped 3.5% over the last month.
- Chanos, a noted short-seller, has taken a position against MSTR, betting on Bitcoin’s performance instead, which has already yielded profits, given MSTR’s decline of 21% in the last month.
MSTR/IBIT (TradingView)
Historical Support Levels
Historically, MSTR has found support around the 200-DMA, as seen during previous market downturns in April 2025 and the summer of 2024. This current downward movement will largely depend on Bitcoin’s price behavior moving forward.
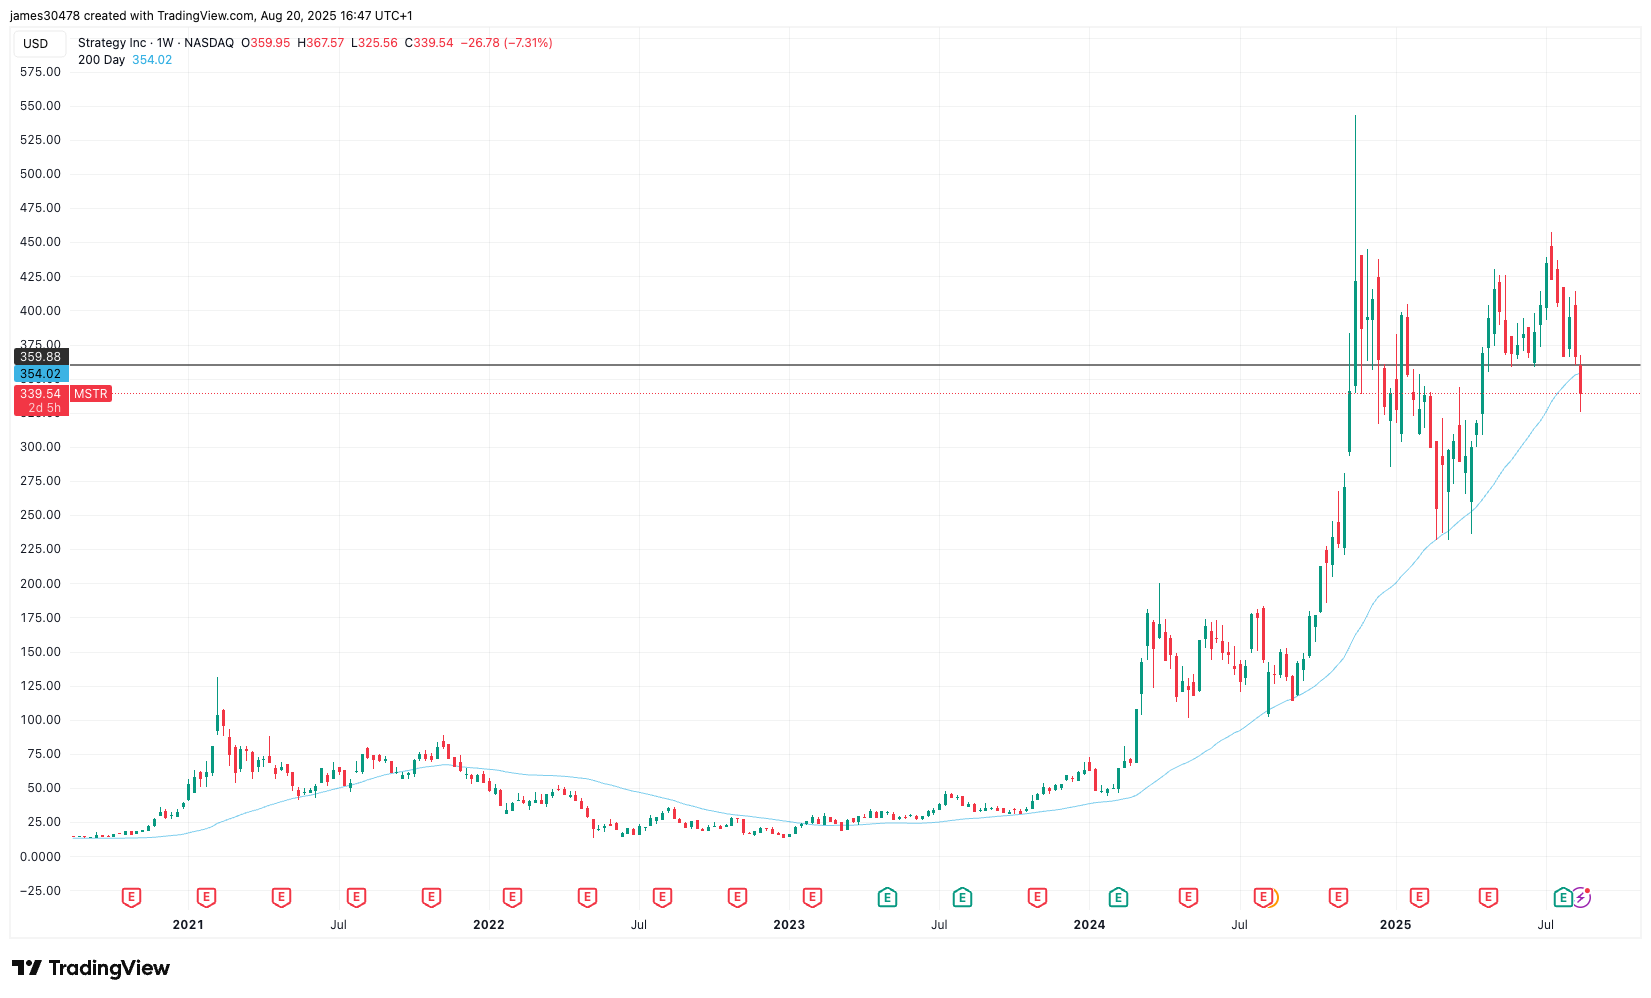 MSTR 200-day moving average (TradingView)
Chanos’s Strategic Position
Jim Chanos recently reiterated his bearish outlook on MSTR, emphasizing his position as a significant wager against the company led by Michael Saylor. The recent movements in the stock have validated Chanos’s approach, particularly as the MSTR/IBIT ratio dives to five-month lows.
Stay informed on the latest market dynamics by subscribing to our newsletter.
