


Key Takeaways
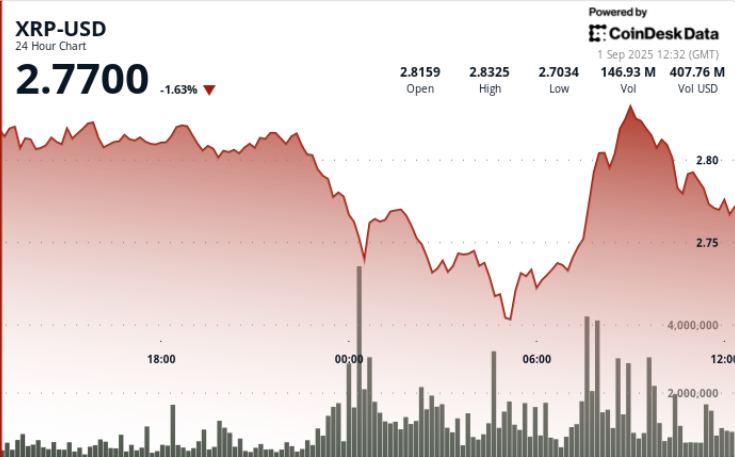
- XRP traded between $2.70 and $2.84 from August 31 to September 1, with whale accumulation countering resistance.
- Institutions accumulated 340 million XRP in two weeks, signifying strong buyer interest despite bearish trends.
- A breakthrough over $2.84 could push prices to $3.00-$3.30, while falling below $2.70 may target $2.50 as support.
Market Context
XRP’s price fluctuated between $2.80 and $2.70 during late August 31 and early September 1 before bouncing back to $2.82 thanks to robust trading volumes. Whales accumulated 340 million XRP over the past fortnight, suggesting significant institutional interest in the asset amidst a generally bearish market.
On-chain trading surged with 164 million tokens exchanged during the rebound on September 1, significantly higher than typical session volumes. September historically tends to be a weaker month for cryptocurrencies, but increasing whale acquisitions are seen as a balancing force against retail sell-offs.
Summary of Price Movements
- The trading range between $2.70 and $2.84 reflects a 0.14 (≈4.9%) movement.
- The steepest decline occurred at 23:00 GMT on August 31, when the price dropped from $2.80 to $2.77, trading at a volume of 76.87 million, nearly tripling daily averages.
- At 07:00 GMT on September 1, a bullish spike propelled prices from $2.73 to $2.82 with a total volume of 164 million, reinforcing support levels at $2.70–$2.73.
- In the last trading hour (10:20-11:19 GMT), prices dipped 0.71% from $2.81 to $2.79 with significant sell-offs demonstrating consistent resistance at around $2.80-$2.81.
Technical Overview
- Support Levels: The $2.70-$2.73 range is solidly defended, supported by whale trades.
- Resistance Levels: The peak point remains at $2.80-$2.84, while the subsequent upside threshold is positioned at $2.87-$3.02.
- Market Momentum Indicators: The RSI is near the mid-40s, indicating a neutral-to-bearish bias. The MACD is in a compression phase, which may indicate potential crossovers with continued buying.
- Formation Patterns: A symmetrical triangle is forming due to compression in volatility, suggesting a breakout towards $3.30 if resistance is surpassed.
Trader Sentiment
- As long as the $2.70-$2.73 support holds, short-term traders may look to retest $2.84.
- Closing above $2.84 opens pathways for levels around $3.00-$3.30.
- Conversely, breaching $2.70 places the next structural support at $2.50.
- A dynamic condition exists between whale accumulation and institutional sell-offs, which will play a significant role in market direction through September.
