


What to Know:
- Holders of Bitcoin for 7 to 10 years control 8.1% of the total supply, the highest since 2019, while those holding for over 10 years now account for 17%.
- Those in the 5 to 7 year bracket are moving their holdings; their share has dropped from 10% to 5% since early 2023.
Analysis
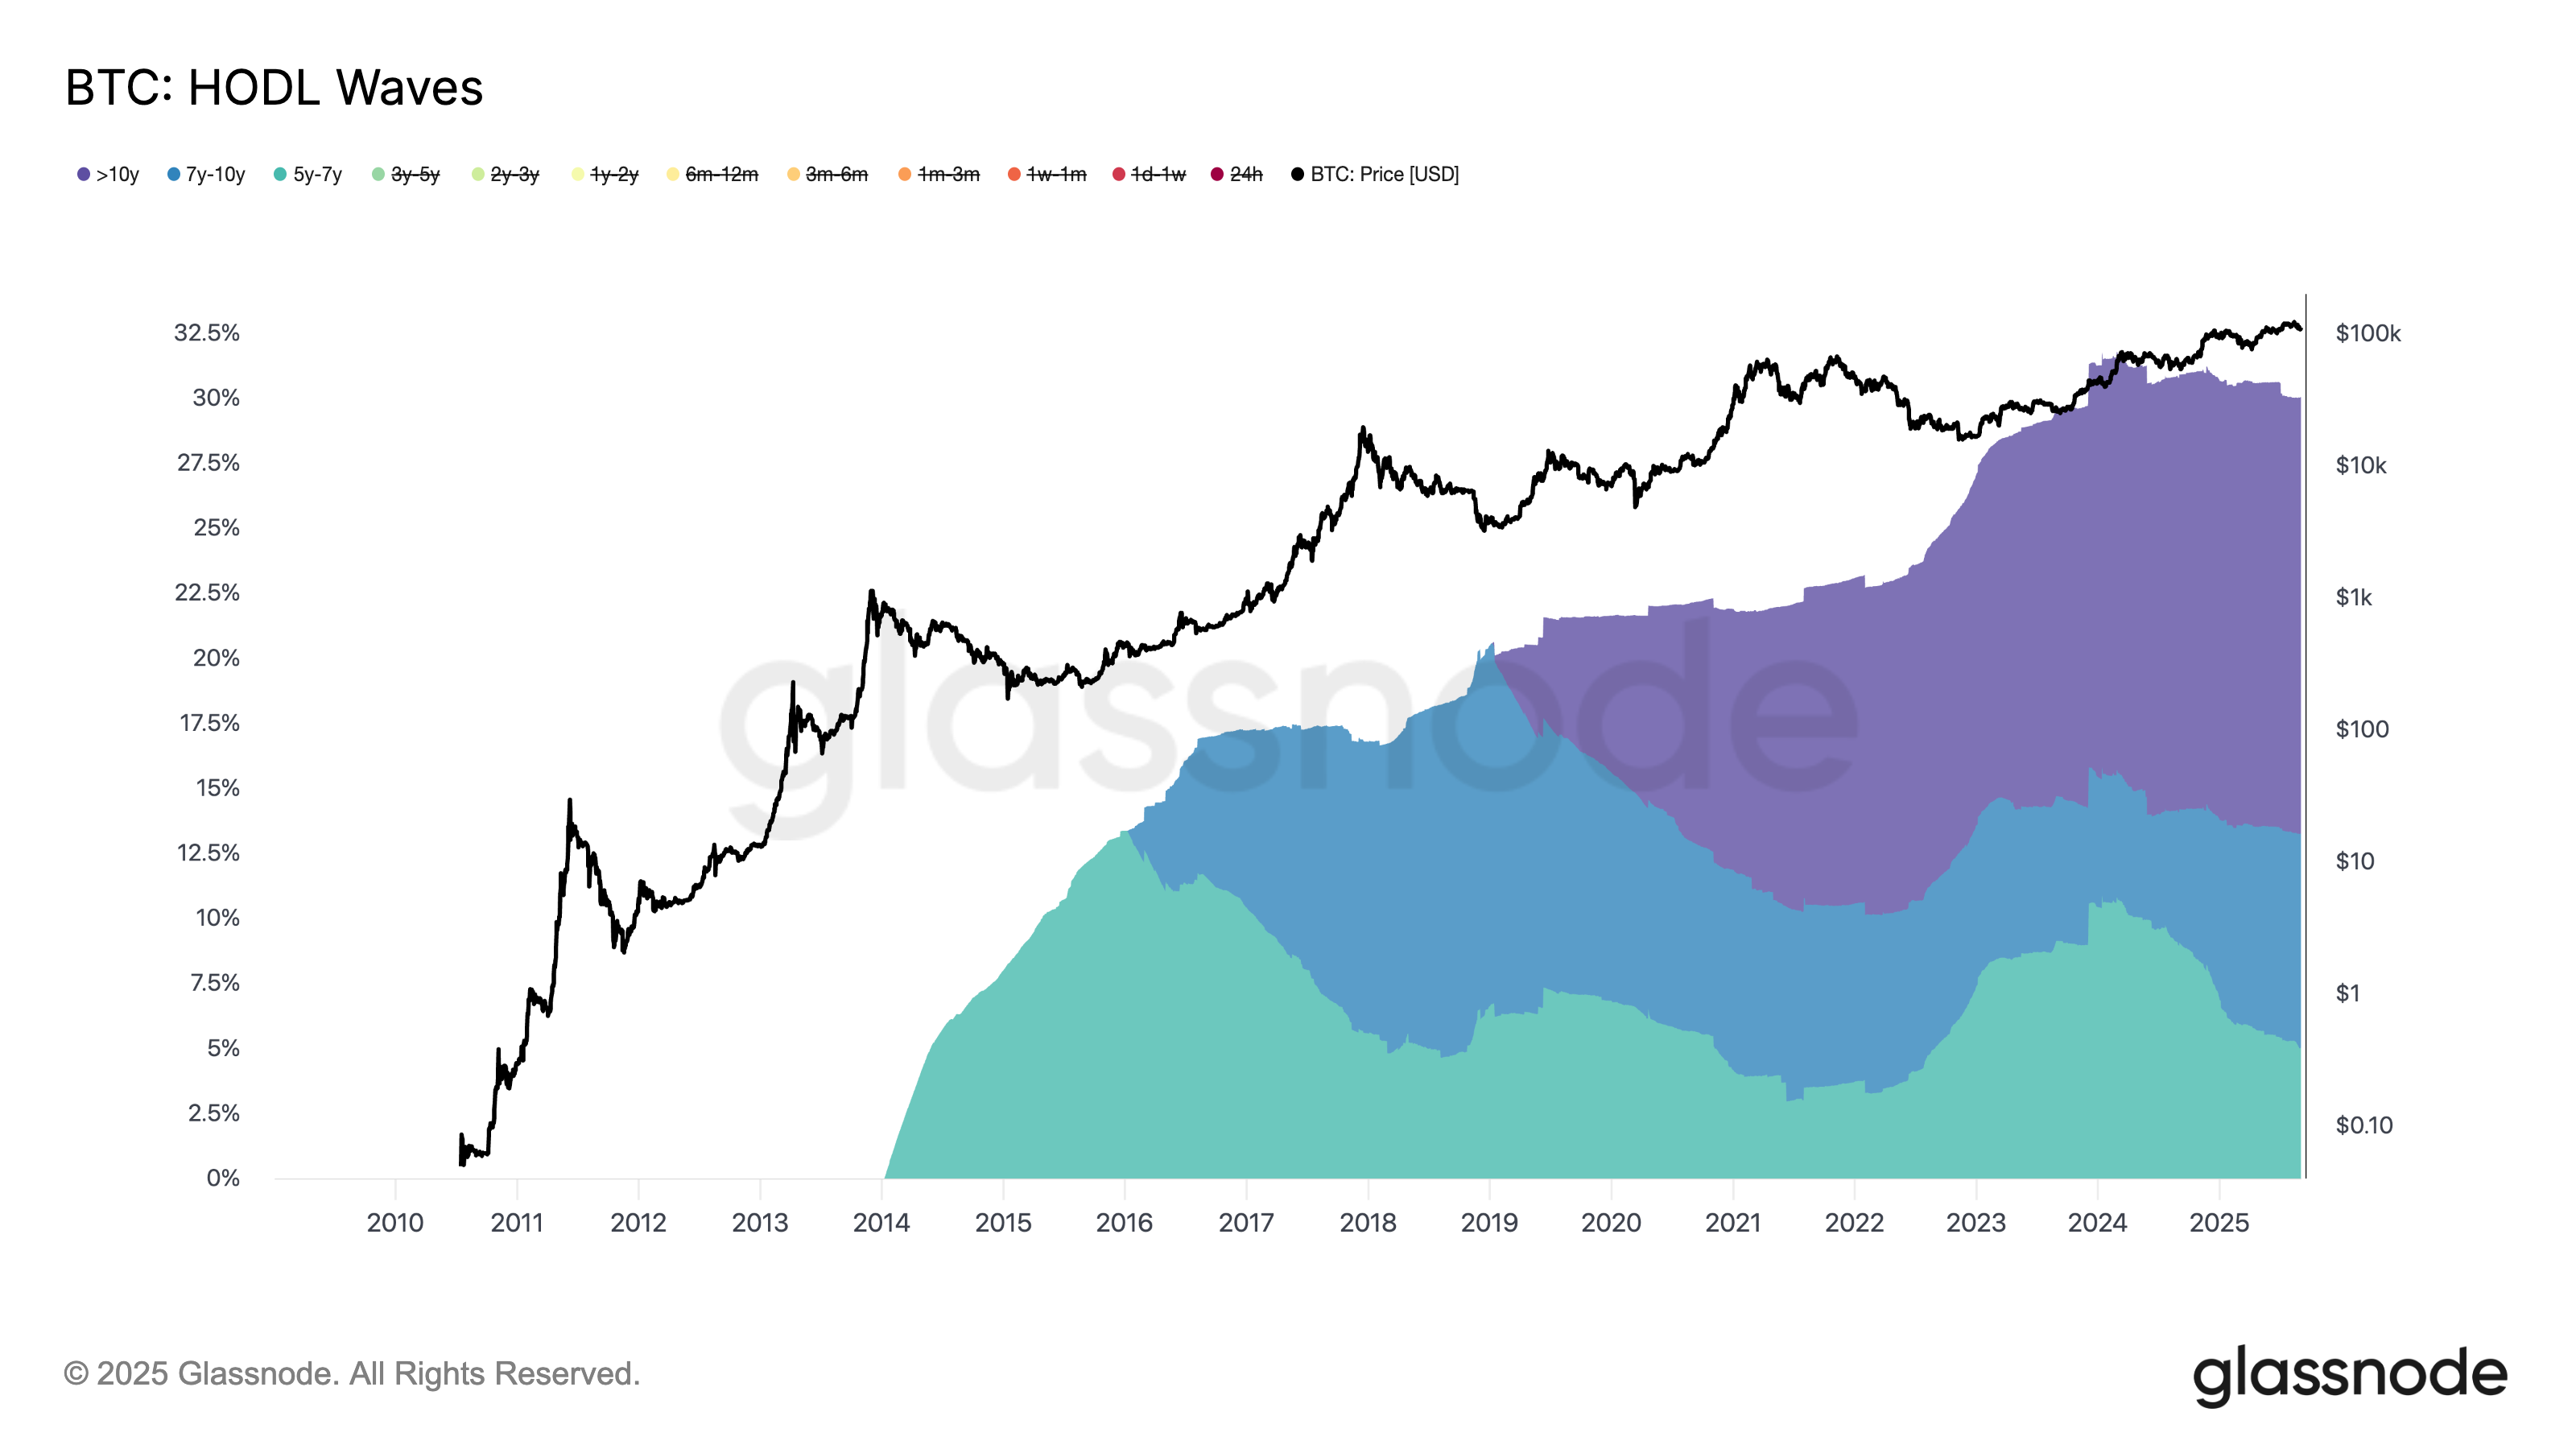
Glassnode’s HODL Waves graph shows how Bitcoin’s distribution varies across different age bands. This distinguishes the percentage of Bitcoin that hasn’t moved within the indicated timeframe.
The current discourse on Bitcoin’s price drop emphasizes the selling activities of OG whales (experienced holders with substantial amounts). While there is some truth to this—evidenced by a Galaxy transaction involving 80,000 BTC—the broader implications reveal a more complicated scenario. Recent Bitcoin trading surpassed $100,000, prompting significant selling from a segment of investors.
Despite these movements, Glassnode’s statistics illustrate that the dominant narrative is misleading. Long-term holders have increased their holdings; 7 to 10 year holders represent 8.1% of the circulating supply, marking their most substantial share since 2019. This trend counters the notion that older wallets are predominantly selling.
Conversely, those accountable for 5 to 7 years of holding saw their shares decrease. Initially representing 10% of total supply as of early 2023, they have now reduced to 5%—many during the market’s downturn from $3,000 during the COVID crash.
In essence, while some OG wallets are offloading assets, the prevailing story of widespread selling seems exaggerated. The data indicates that older cohorts are continuing to increase their market share, even as a portion of mid-term holders cash out.
