


What to Know:
- DOGE experienced a 4% rise in a 24-hour timeframe, with trading volumes considerably surpassing average levels.
- Analysts are divided regarding the future of DOGE, with some expecting a decrease while others predict potential increases.
- Significant support and resistance levels have been identified at $0.214 and $0.223, impacted by institutional trading activity.
Background Information:
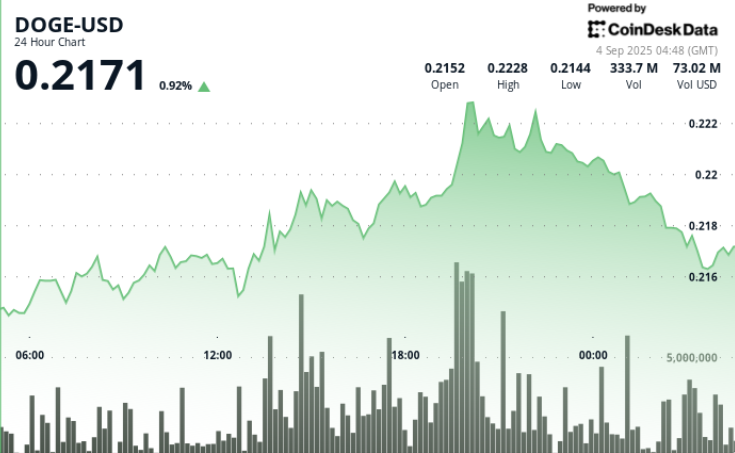
- DOGE increased by 4% from September 3 at 03:00 to September 4 at 02:00, moving from $0.216 to $0.218.
- Trading volumes surged to 416.41M tokens during resistance testing at $0.223, well above the 24-hour average of 244.87M.
- The likelihood of ETF approval rose from 51% to 71% per prediction markets (Polymarket), driving institutional interest.
- Analysts have contrasting views: some caution a potential triangle breakdown towards the $0.17 Fibonacci support, while others see a possible rise towards $1.00–$1.40 based on historical patterns.
Price Action Overview:
- DOGE was traded within a $0.009 range (4.17% volatility) between $0.214 and $0.223.
- A midday surge (from 13:00 to 15:00) saw the price rise from $0.215 to $0.219 alongside volumes over 400M.
- An evening price rejection at $0.223 led to profit-taking and high volume flows.
- The final hour (01:31–02:30) recorded a 0.5% decline from $0.219 to $0.218, with volume intensifying to 16.1M in the last minute.
- The session low was marked at $0.2178 as the $0.218 support faltered under selling pressure.
Technical Analysis:
- Support: $0.214 is confirmed by recurrent institutional bids during overnight trading.
- Resistance: $0.223 established through strong-volume rejections.
- Momentum: Lower highs are forming; escalating volume on declines suggests distribution.
- Patterns: A potential triangle formation under $0.22; a breakdown may aim for $0.17 Fibonacci support.
- Volume: Institutional surges exceeding 400M confirm heightened corporate desk involvement.
Key Trader Focus Areas:
- Monitoring whether $0.218 support holds or if a breakdown could lead to $0.214 → $0.17.
- Institutional flow trends related to ETF speculation, which may stimulate breakout buying if regulatory clarity emerges.
- Broader macroenvironment (Fed interest rate trajectory + treasury adaptation narratives) bolstering risk behavior.
- Whale activities and treasury inflows may indicate whether accumulation is outpacing distribution.
