Crypto/Finance/Market Trends
XRP's Trading Dynamics: A Look at Price Movements
An analysis of XRP's recent price behavior highlights significant whale activity alongside institutional actions, amid ongoing resistance levels.


1 min read
Key Highlights
- XRP fluctuated within a narrow range of $2.81 to $2.87 over a 24-hour span, with notable large wallet accumulation of 340 million XRP despite substantial institutional liquidations.
- Transaction volume on the XRP Ledger experienced a remarkable increase, reaching 2.15 billion XRP on September 1.
- Analysts hold differing opinions regarding XRP’s future, predicting potential highs between $7 and $13 but cautioning against resistance just below critical trendlines.
Market Context
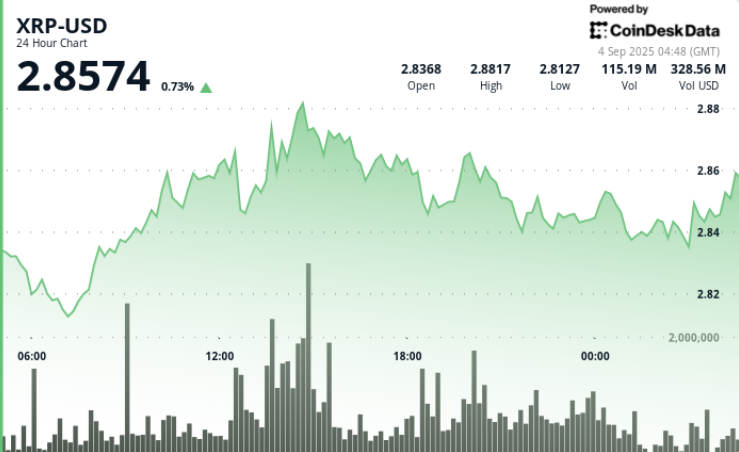
- XRP’s trading during the specified timeframe was constrained within a 2% range from $2.81 to $2.87.
- Over approximately the last two weeks, significant wallet activity led to the accumulation of around 340 million XRP valued at nearly $960 million, coinciding with institutions liquidating up to $1.9 billion since July.
- As an observation, the cumulative transaction volume on September 1 notably surpassed its typical daily figures.
Price Action Observations
- XRP opened at $2.84 and reached a closing value of $2.85, showcasing minor fluctuations amid intra-day volatility.
- Initial values dropped from $2.84 to $2.79, before making a recovery to $2.87 by midday on September 3.
- The $2.82 price point emerged as a reliable support level.
- Resistance appeared near $2.86, highlighting a crucial point for price movements as selling pressure increased.
- A significant moment occurred during final trading, where a spike to $2.873 was swiftly rejected, reflecting continued uncertainty in XRP’s price momentum.
Technical Insights
- Support: The $2.82 zone remains pivotal, with subsequent levels being $2.70 and $2.50.
- Resistance: Levels between $2.86 and $2.88 act as overhead hurdles, with $3.00 serving as a significant psychological barrier.
- Momentum Indicators: Currently, the RSI remains steady in the mid-50s, suggesting a neutral bias but with a slight bullish inclination.
- MACD dynamics indicate a potential bullish crossover in the histogram, contingent on sustained volume levels.
- Price Patterns: The symmetrical triangle consolidation is witnessed below $3.00 with a breakout surpassing $3.30 unlocking higher price potentials.
- Volume Dynamics: Notable session surges (93M–95M vs average of 44M) signal heightened institutional engagement.
