


What You Need to Know:
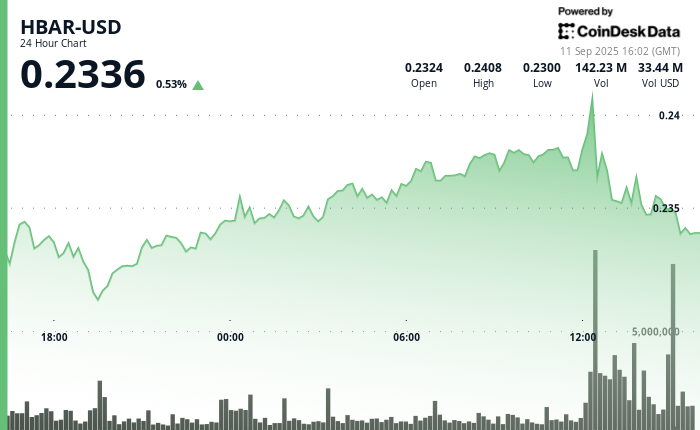
- The HBAR token traded between $0.23 support and $0.24 resistance during a high-volume session, reaching 156.1 million.
- Grayscale has applied to convert its Hedera HBAR Trust into an ETF, with the SEC set to decide by November 12.
- A close above $0.24 might lead to a potential 25% increase towards the $0.25 mark, but selling pressure remains a challenge.
Hedera’s HBAR token experienced significant fluctuations on September 10–11, fluctuating within a narrow 5% band between $0.23 and $0.24. The token dropped to its support level of $0.23 early in the session but rebounded with heavier trading volumes. The average daily trading volume was 35.4 million, which surged to 156.1 million by midday September 11, indicating institutional inflows pushing HBAR back towards the $0.24 ceiling.
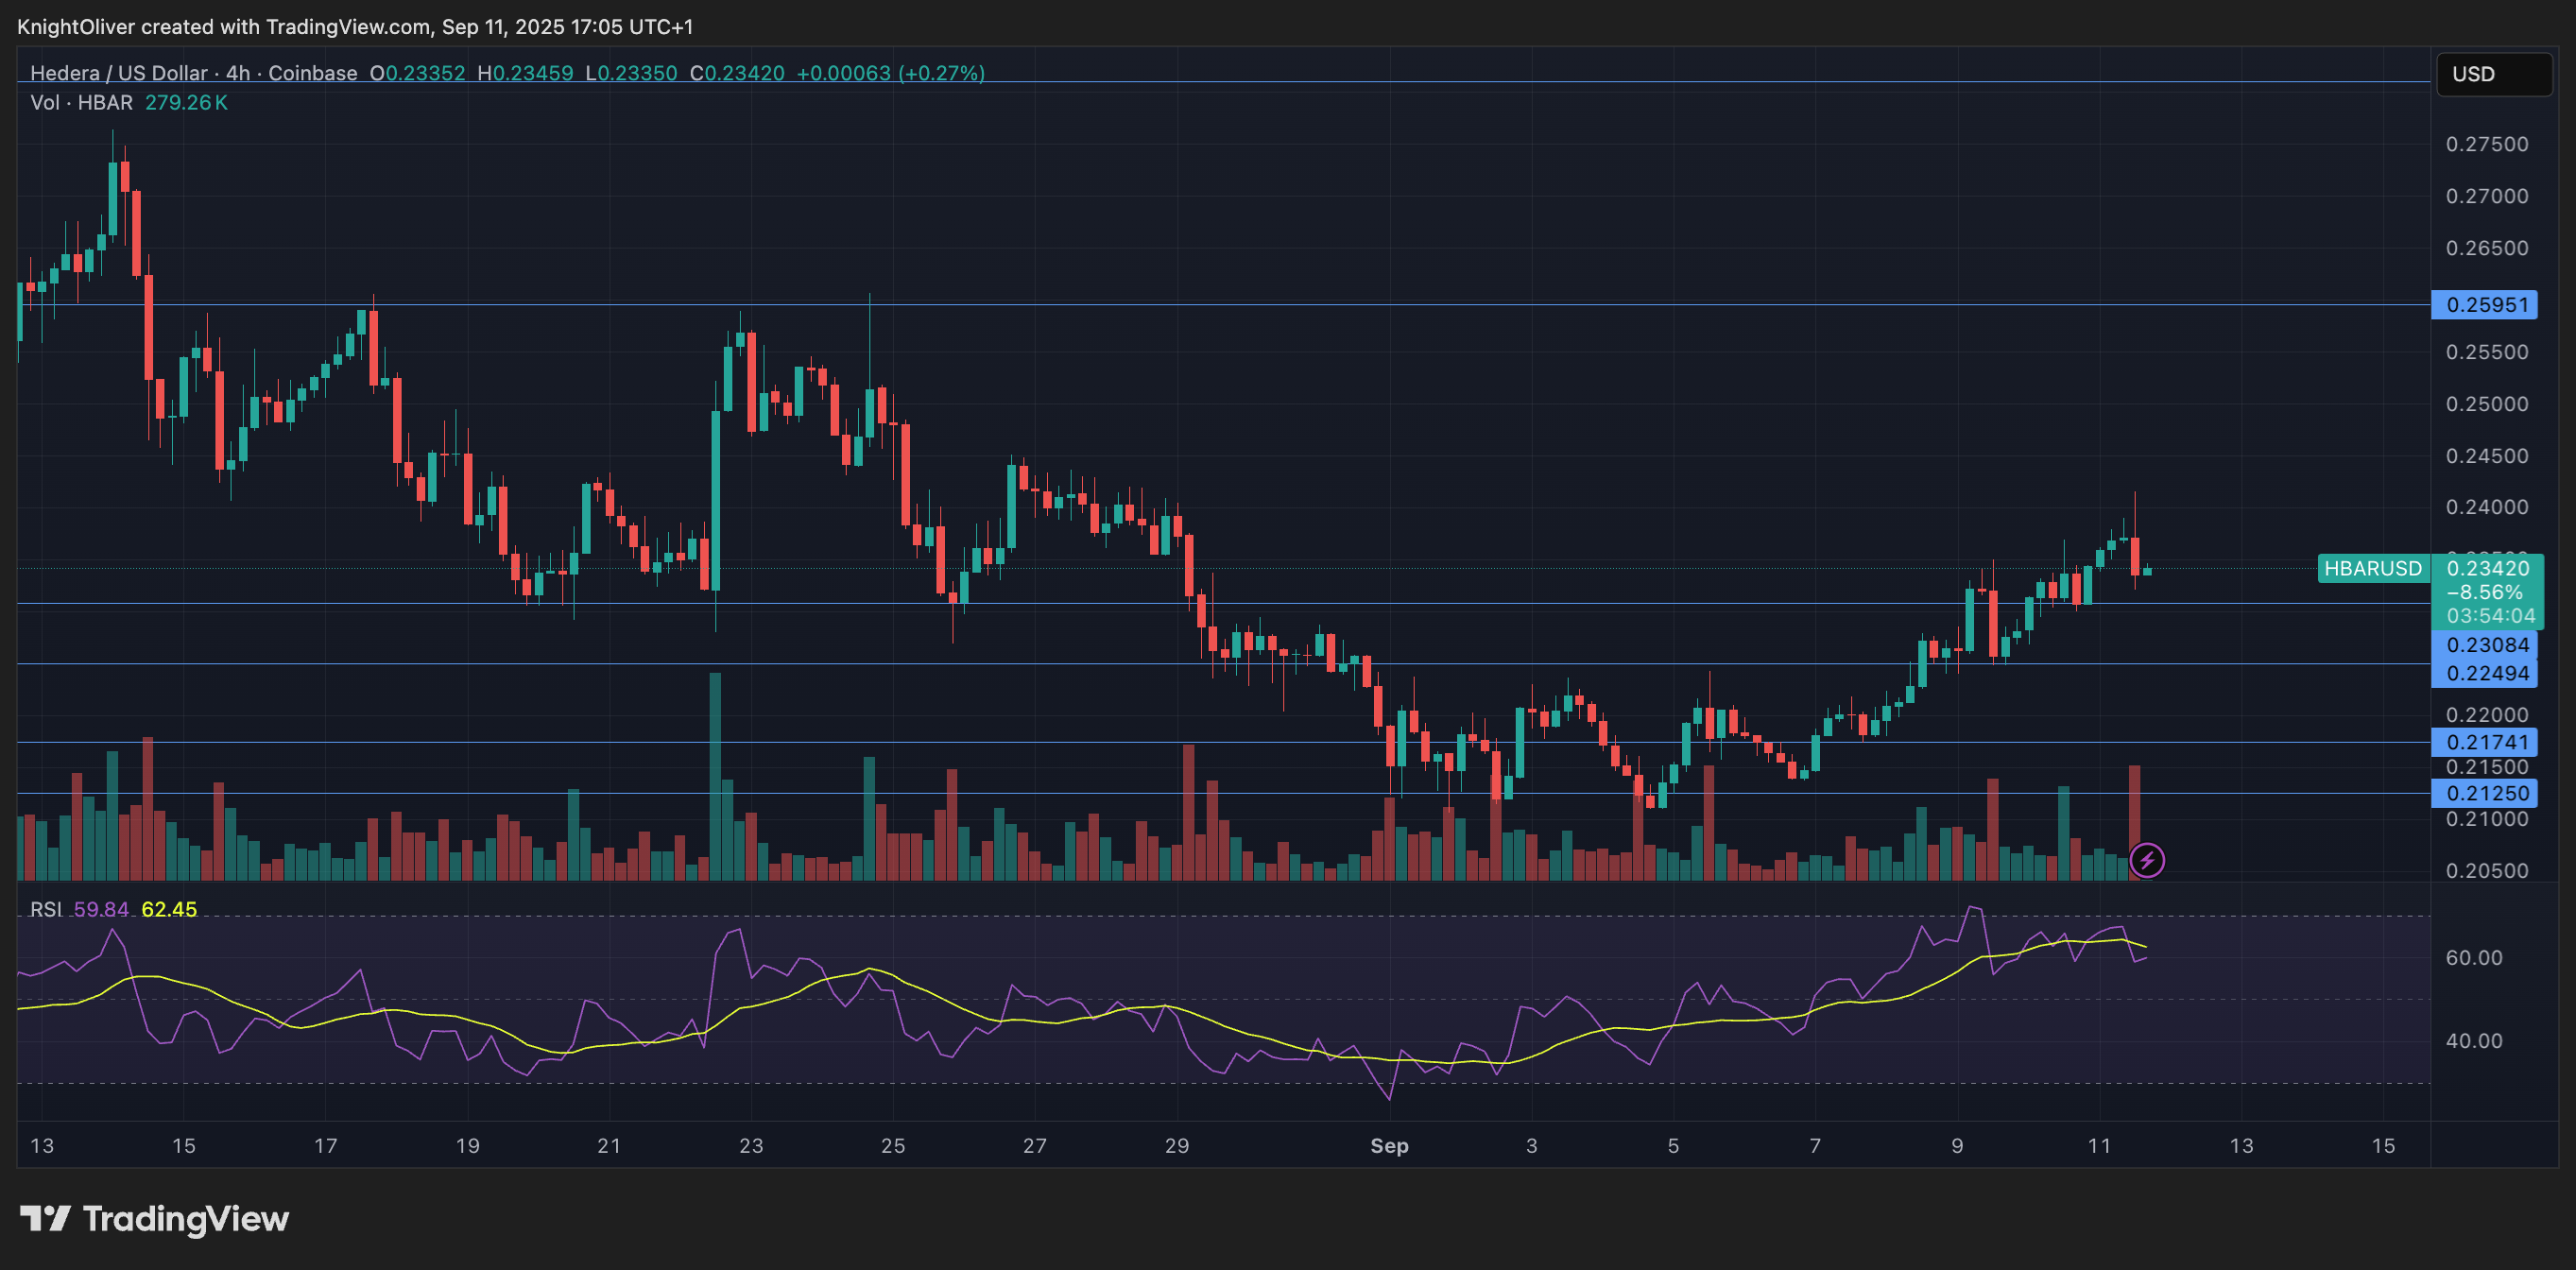
Despite this rally, HBAR faced difficulties breaking through the $0.24 resistance level where substantial selling pressure emerged. This highlights the importance of $0.23 as a solid support and $0.24 as a crucial barrier for further upward movement. Analysts suggest that if HBAR manages to close above $0.24, there is a prospect for a 25% rise towards $0.25, yet the inability to breach resistance keeps the token constrained within the $0.21 to $0.23 range.
The surge in trading activity correlates with recent regulatory developments. On September 9, Grayscale approached the U.S. SEC for permission to convert its Hedera HBAR Trust into an exchange-traded fund (ETF), along with similar applications for Bitcoin Cash and Litecoin. The SEC’s November 12 deadline for a decision marks a critical period for HBAR’s adoption by institutional players.
The ETF application has ignited interest from traditional asset managers looking to diversify into digital assets. With regulatory clarity on the horizon, HBAR’s price movements reflect a dynamic interplay between institutional optimism and technical limitations. Market watchers will be keen to see if the SEC’s upcoming decision can serve as a key catalyst for HBAR to reach higher price levels.
 HBAR/USD Trading Chart
Summary of Technical Indicators:
- Trading range spans $0.011, which represents a 5% spread from $0.23 to $0.24 in a 23-hour duration.
- A robust support level exists at $0.23, demonstrated by a volume reversal hitting 37.8 million.
- Breakout volume surged to 156.1 million during recovery, confirming institutional interest.
- Key resistances trigger notable volume reversals, highlighting selling pressure.
- Final hour volatility on September 11 shows a $0.0072 range within the $0.24 mark.
- A sharp rejection pattern emerged at the $0.24 resistance level during a volume spike.
