Bitcoin Price Analysis: A Key Hurdle Stands Before BTC Reaches New All-Time Highs
A look at Bitcoin's recent breakout and the resistance levels that could define its near future.


Bitcoin has exited the phase of being “trapped between MAs and resistance” and is now in a confirmed breakout, characterized by liquidity sweeps and structural shifts that indicate a strongly bullish trend. Although brief pullbacks may occur, the current market structure favors a continuation towards the $120K–$124K range, where a significant supply block and a cluster of sell-side liquidity are located.
Technical Analysis
The Daily Chart
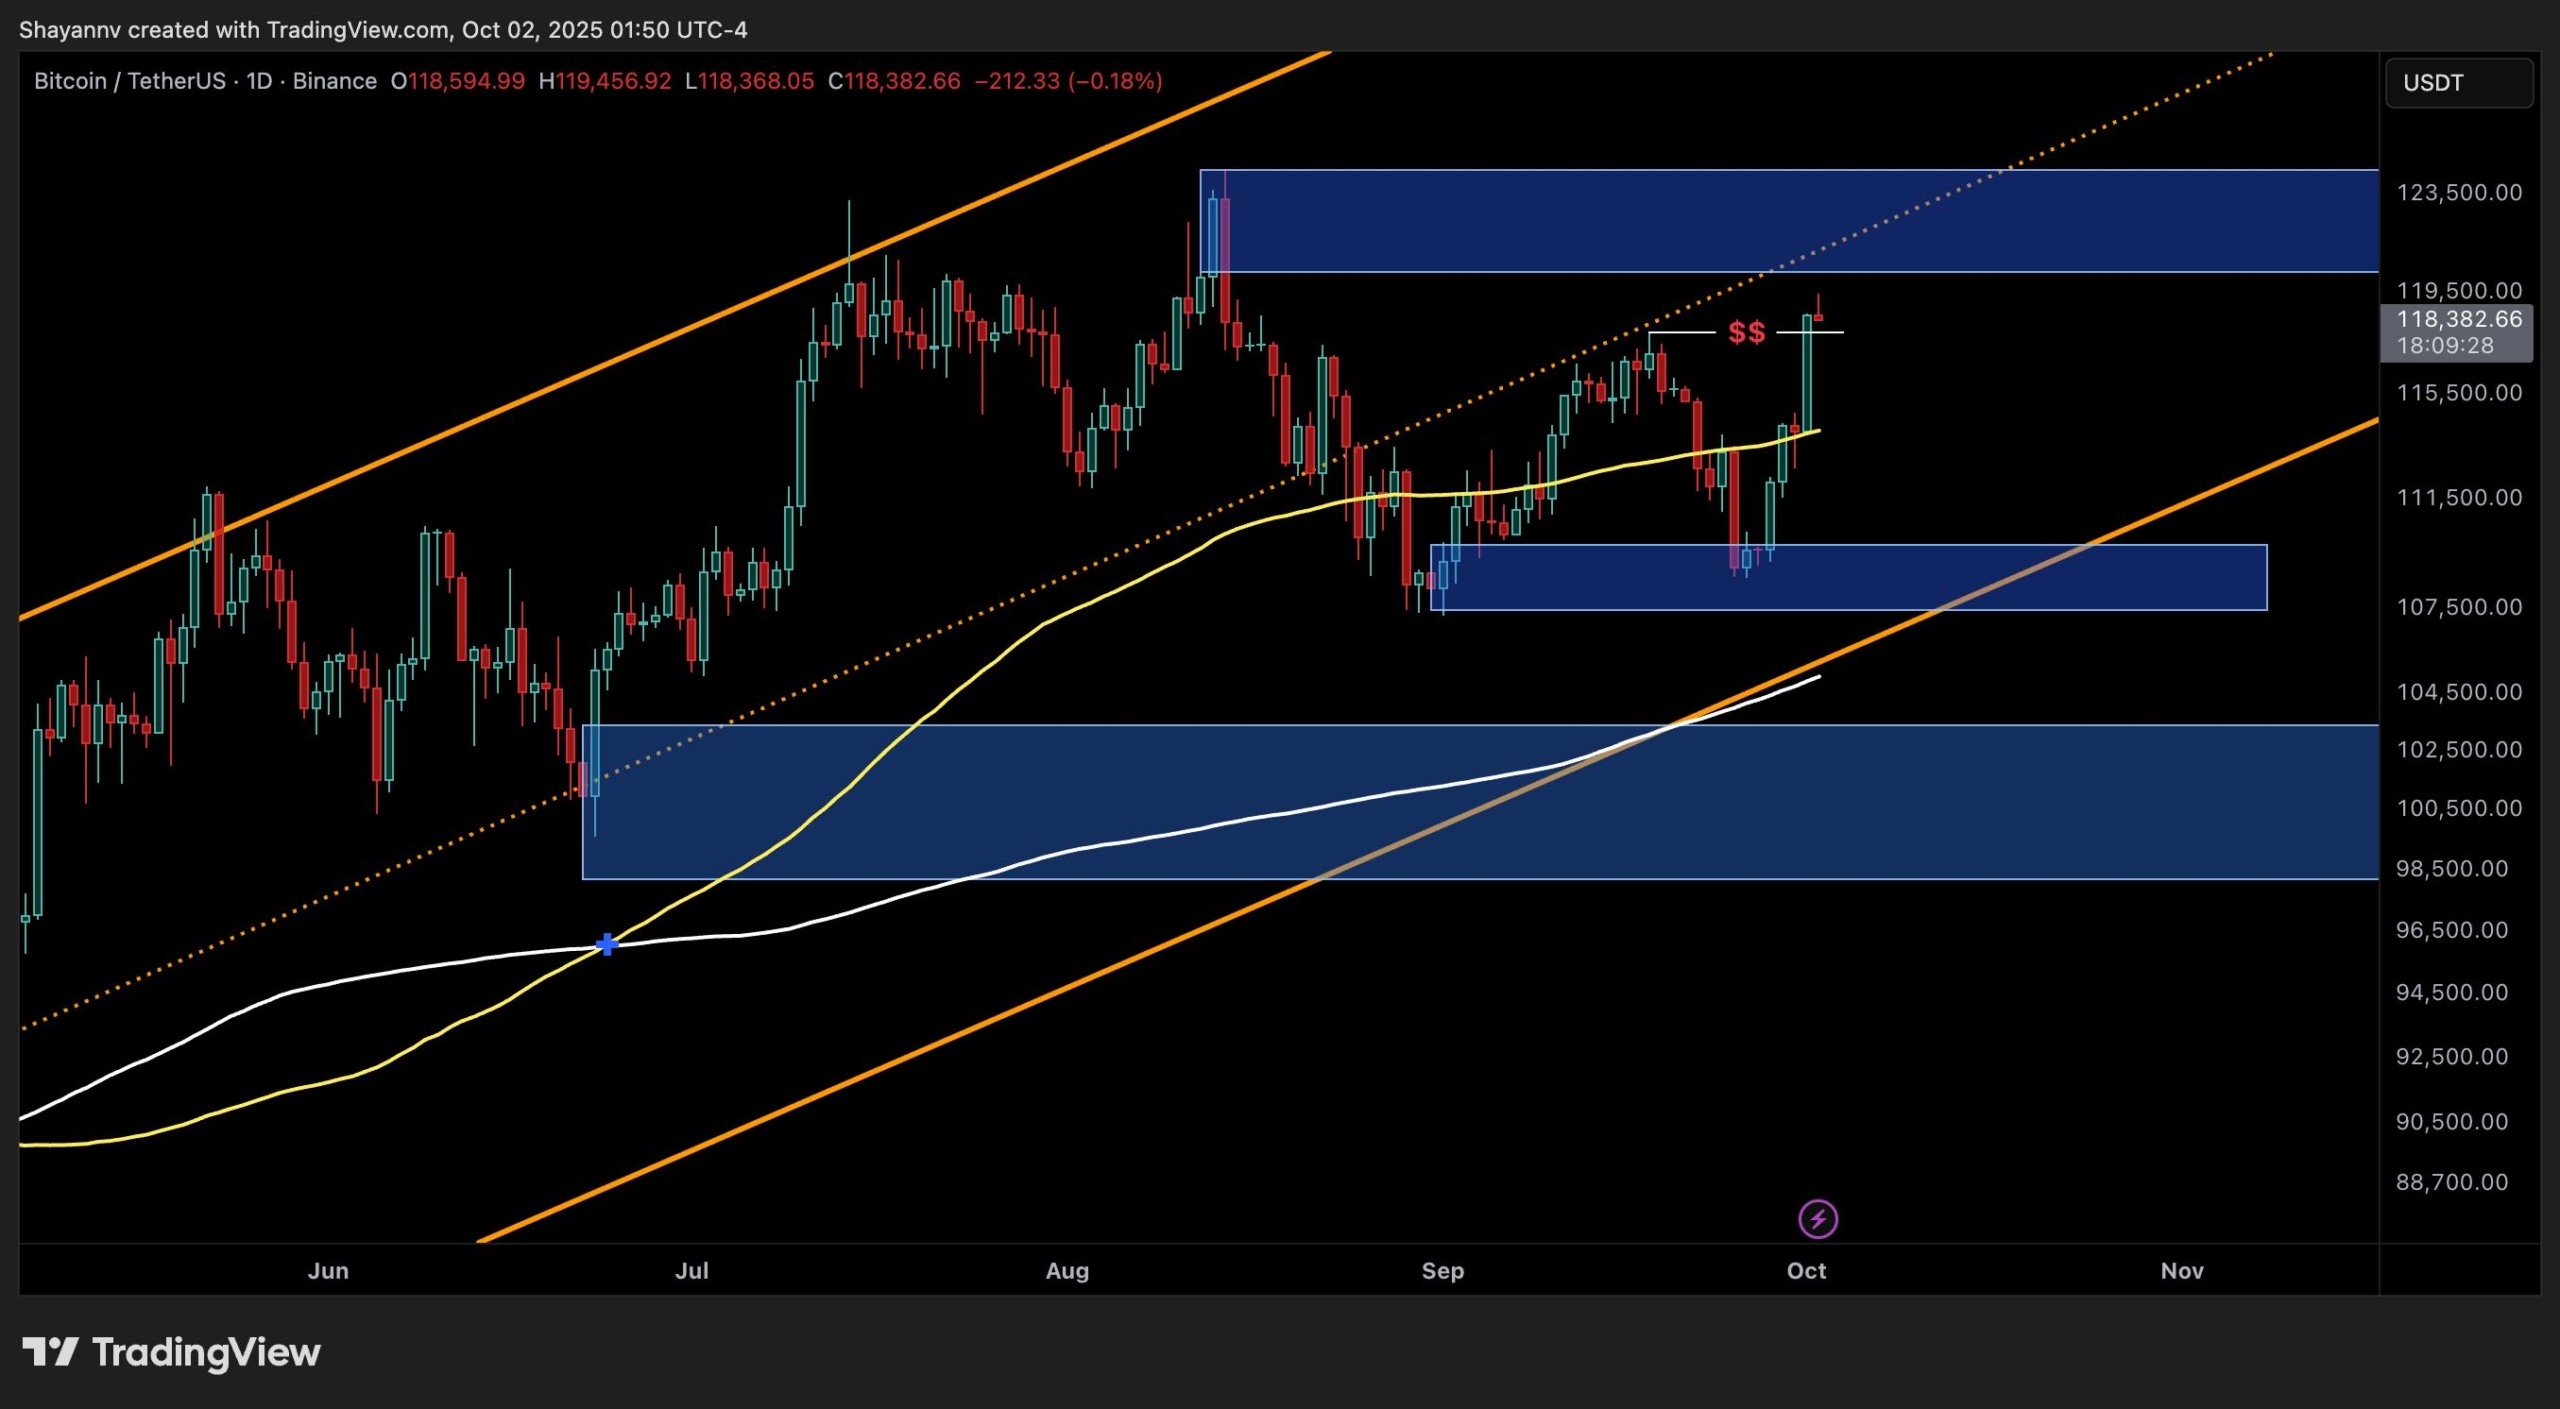
On the daily timeframe, BTC has reclaimed the 100-day moving average at $114K and surged through the midpoint of its consolidation range, entering the $118K zone, just below the crucial $120K–$124K supply block. This zone coincides with a major order block from previous distributions, making it a vital level.
The surge confirms a bullish breakout from the recent major swing high, weakening the larger corrective structure. Although the daily candles indicate some resistance around $118K, the medium-term structure remains optimistic. As long as BTC maintains levels above the $112K–$114K support area, the path ahead shows little resistance towards $120K–$124K.
BTC Daily Chart
The 4-Hour Chart
The 4-hour structure provides a clearer picture of the breakout. After consolidating above $114K, Bitcoin broke through descending resistance, sweeping liquidity above $116K and moving into the $118K liquidity pool.
If a pullback occurs, the $114K–$115K demand block will be the key decision point. Sustained bids at this level could fuel another push into the $120K–$124K supply cluster.
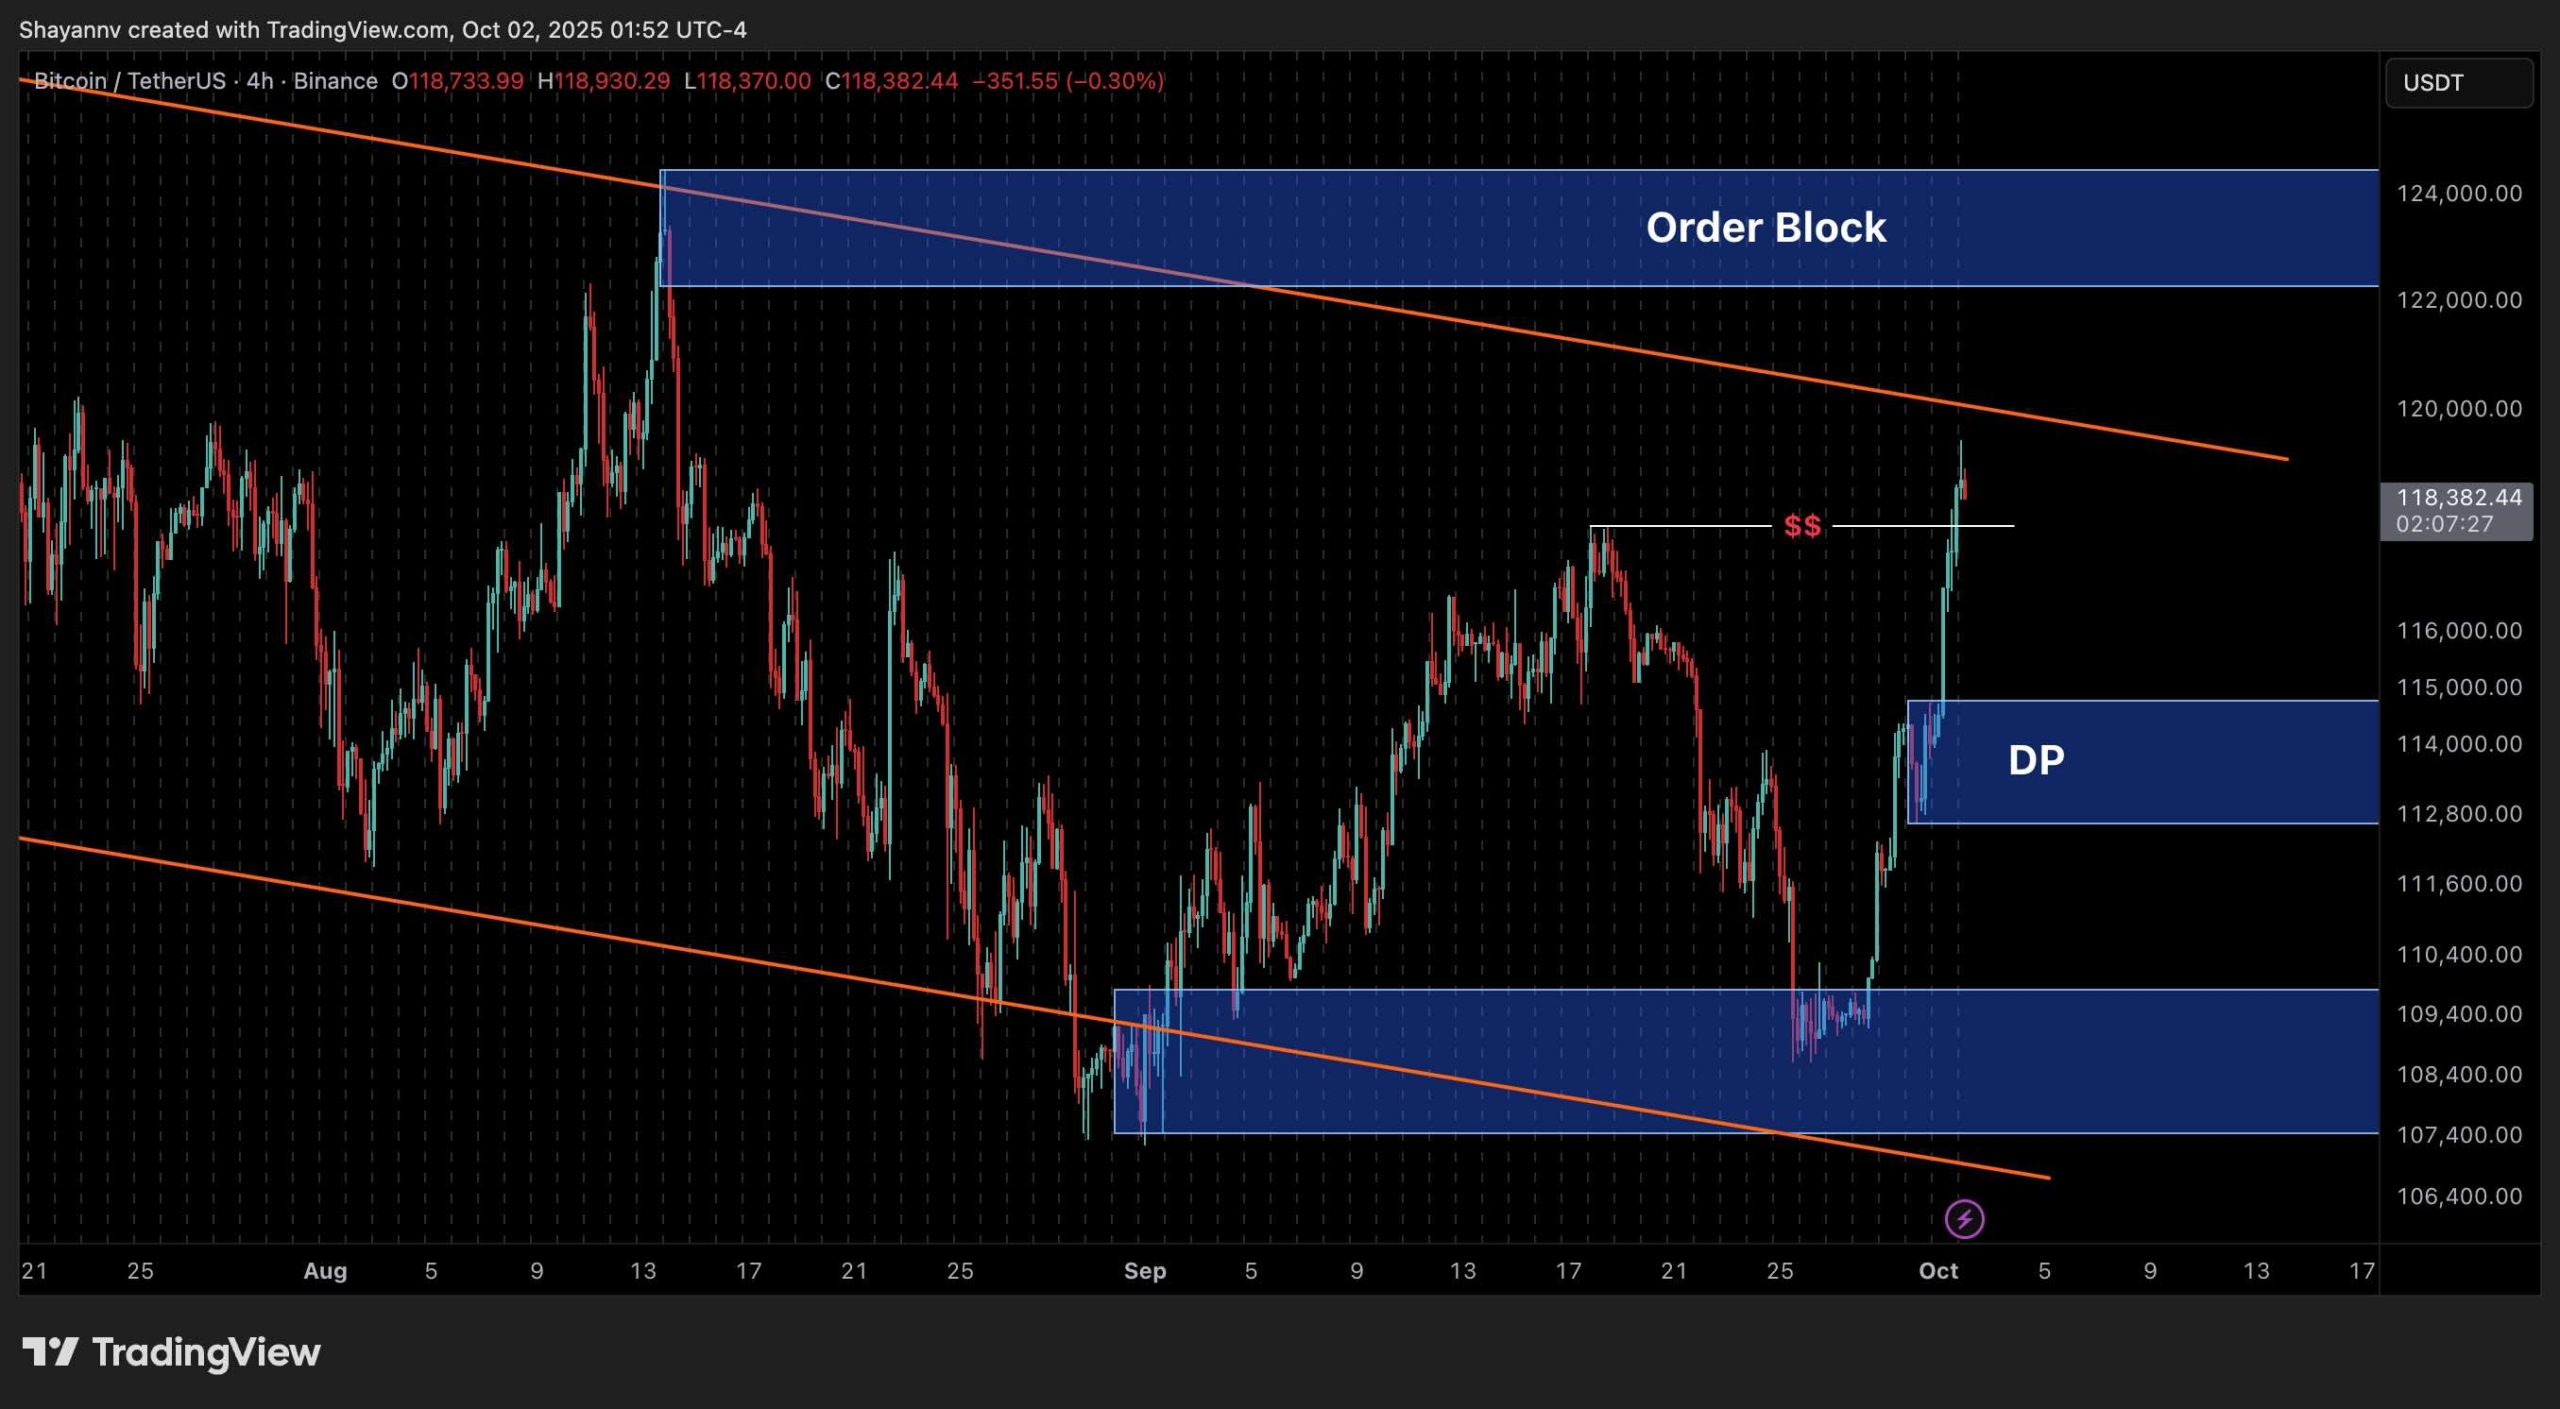 BTC 4 Hour Chart
On-Chain Analysis
The liquidation heatmap further corroborates the technical analysis by highlighting significant liquidity concentrations currently in play. As Bitcoin recovered from the $109K demand zone, it forced many short positions to cover, propelling the price upwards.
The heatmap illustrates a strong liquidity cluster just above the $118K–$120K region, where significant resistance is present. If Bitcoin can maintain momentum above $118K, the likelihood of this liquidity being swept increases, potentially catalyzing an extended rally into the $120K–$124K supply zone.
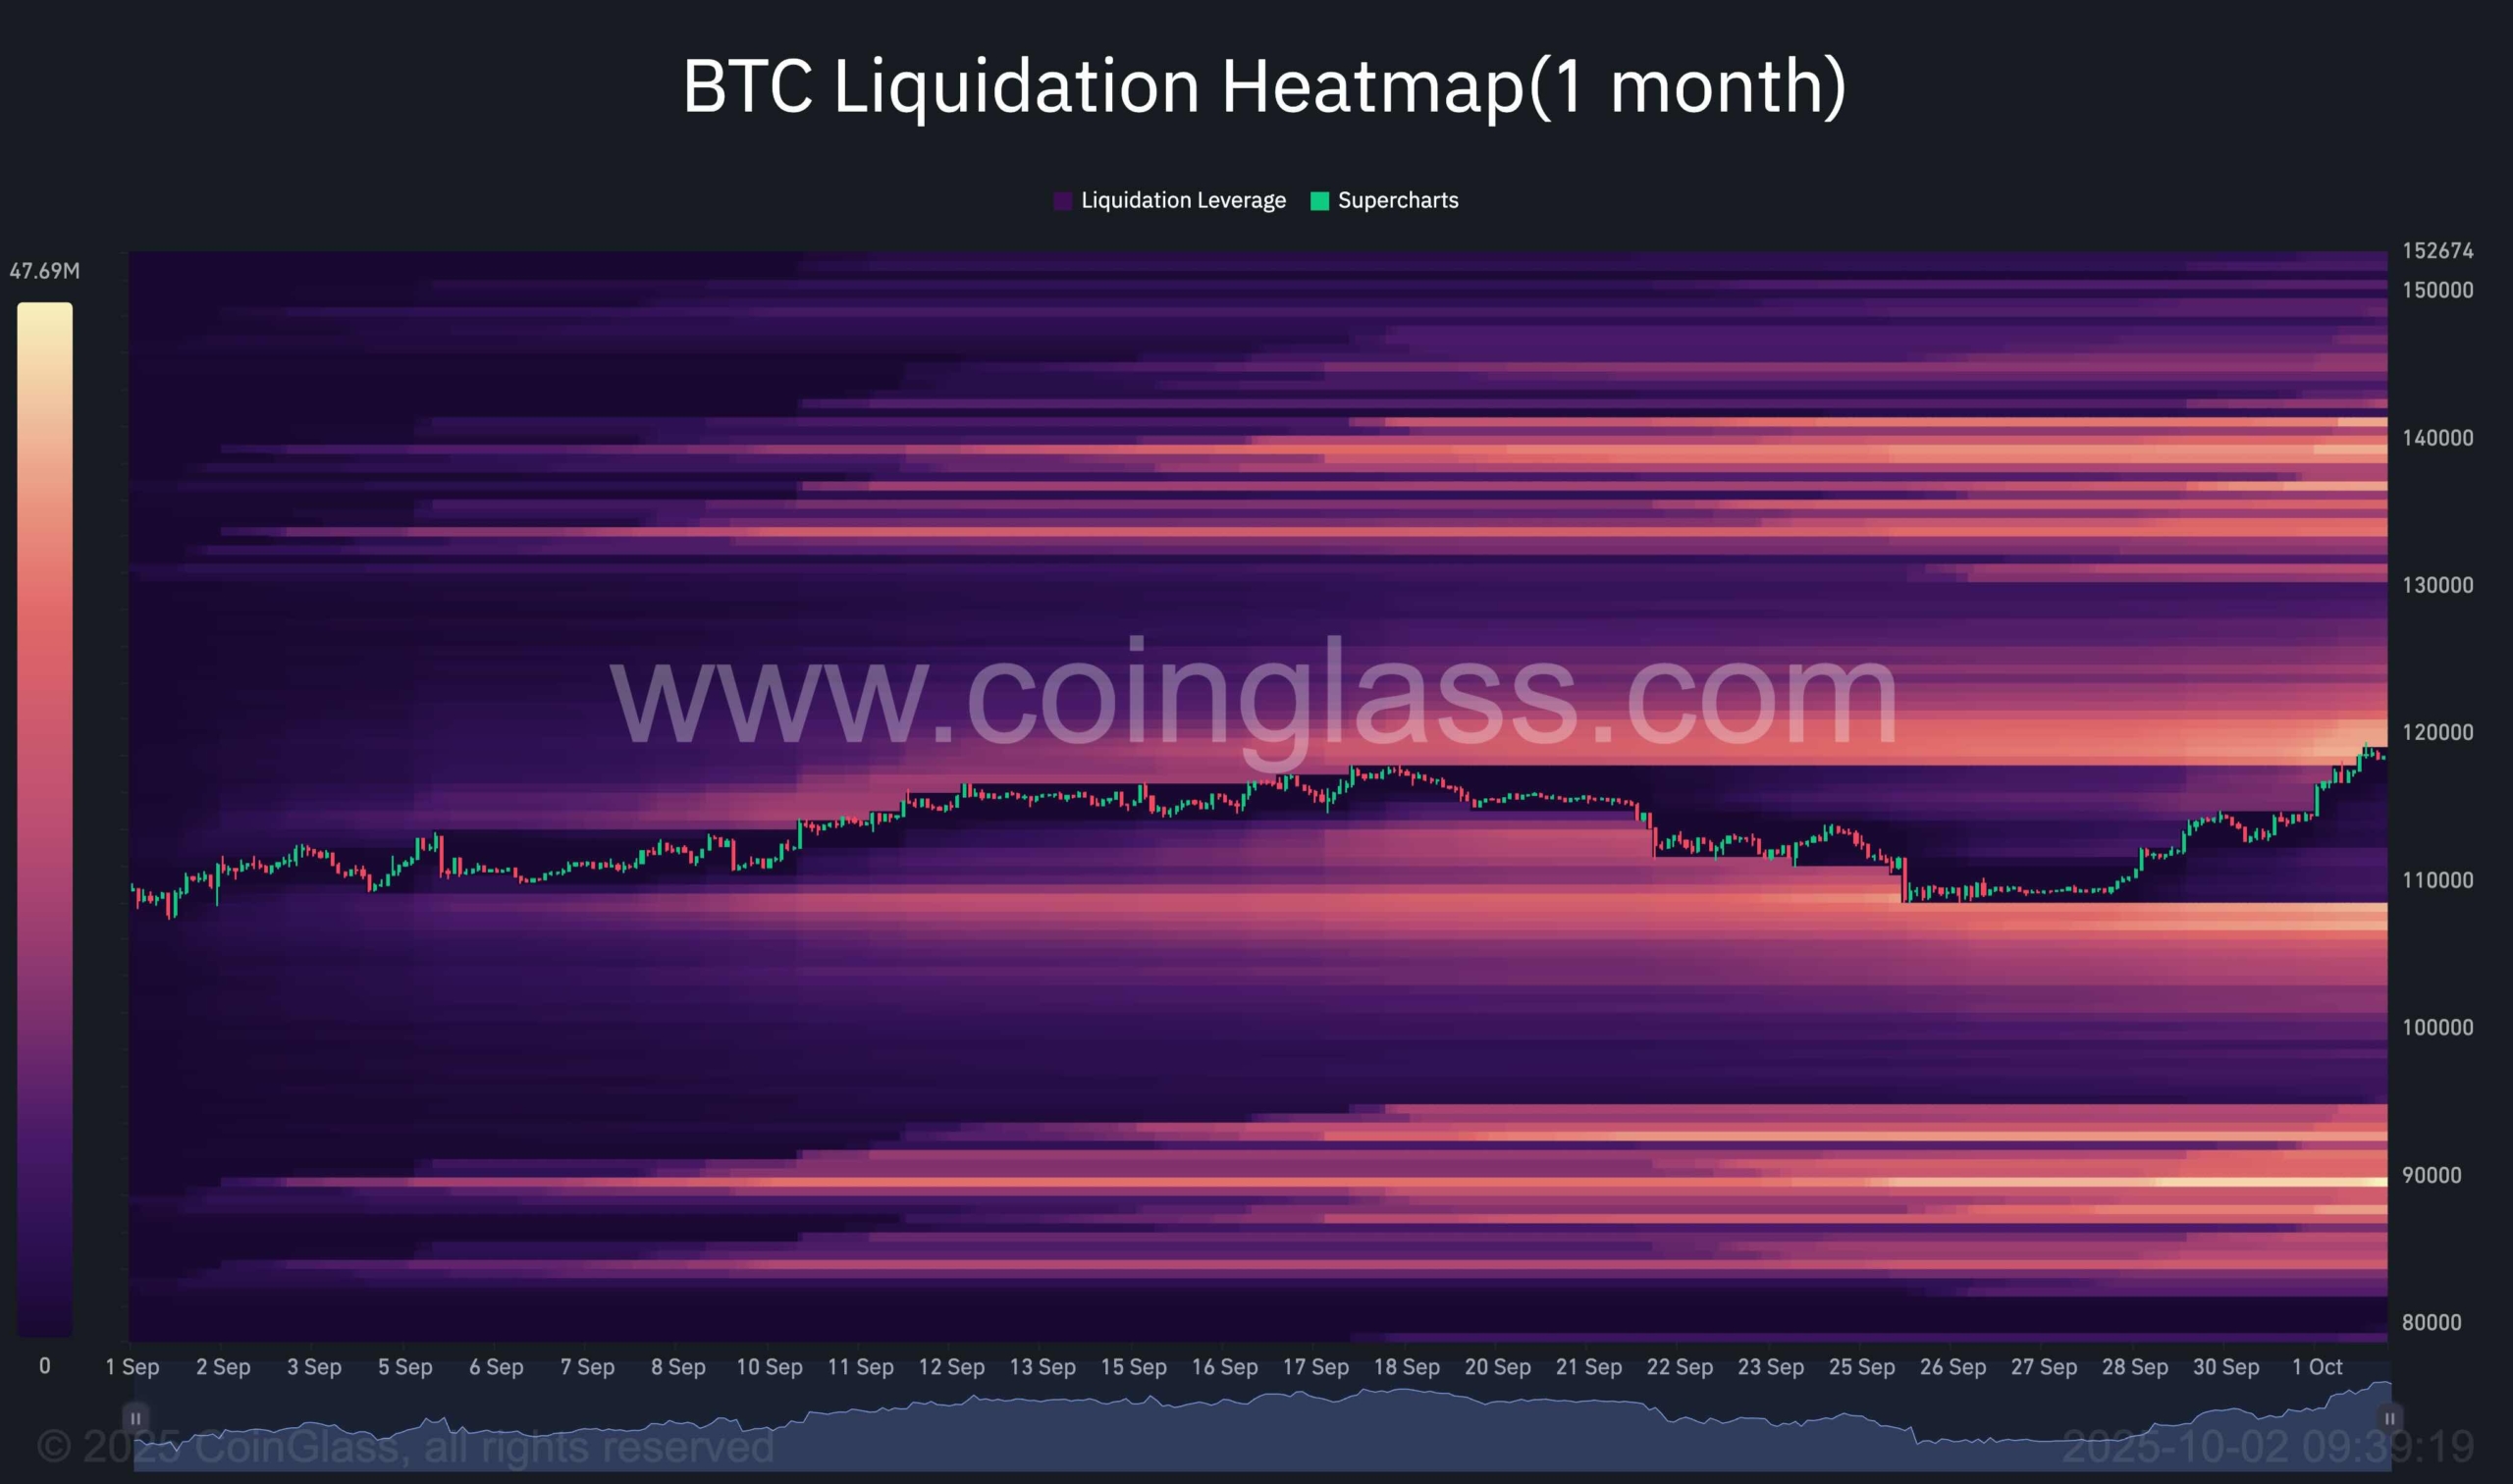 BTC Liquidation Heatmap
In conclusion, the heatmap supports the structural analysis, indicating that Bitcoin is entering a new bullish phase, with short sellers pushed out from lower levels and liquidity accumulating higher, setting the $120K–$124K area as the next critical battleground.
