Will BNB, Solana, and Dogecoin Continue to Climb in October?
The cryptocurrency market is experiencing an upswing with notable performance from BNB, Solana, and Dogecoin as optimism for October grows.


BNB, Solana, and Dogecoin are showing strong bullish momentum as October progresses, renewing optimism for further gains in the cryptocurrency sector.
Key Highlights:
- BNB, SOL, and DOGE display encouraging signs of ‘Uptober’ momentum, with potential targets of $1,480, $250, and $0.31, respectively.
- If crucial trendlines are not maintained, BNB could decline to $835.
As the month began, BNB, Solana, and Dogecoin have started October positively, reflecting the broader advances in the crypto market as optimism surrounding ‘Uptober’ grows. Can these altcoins maintain their upward trajectory through the month?
 Comparison Chart
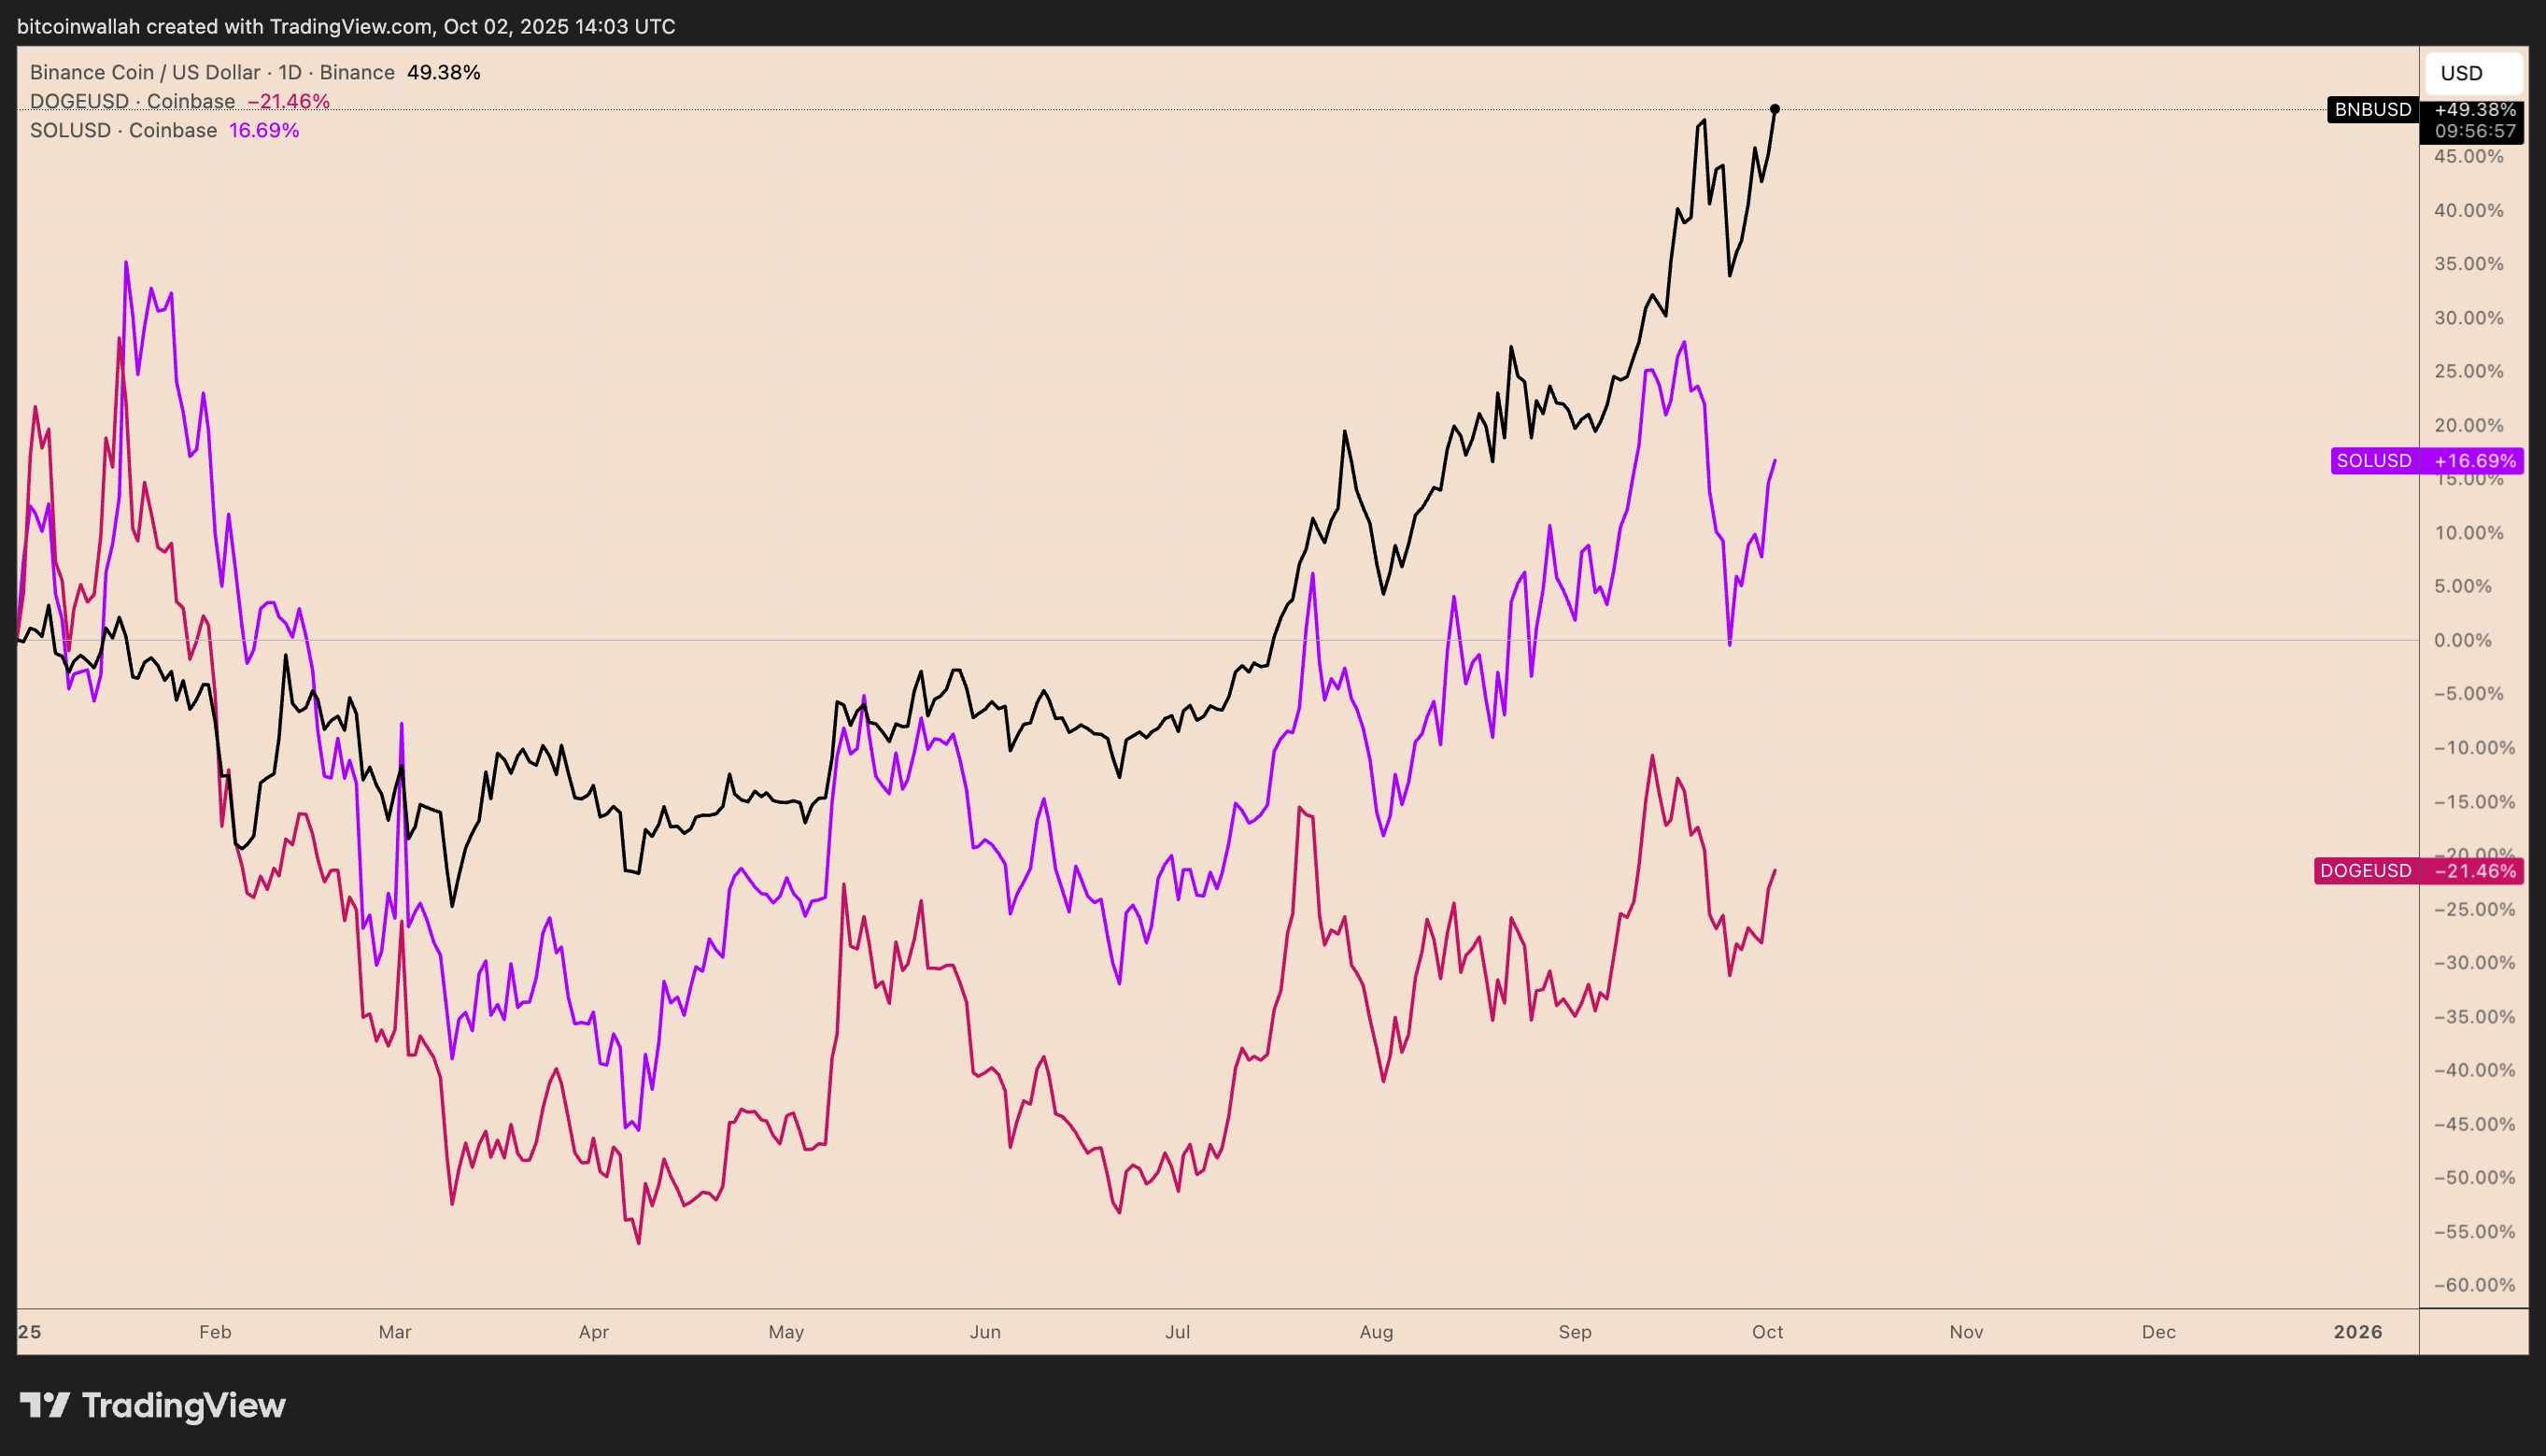
BNB/USD, DOGE/USD, SOL/USDT year-to-date comparison. Source: TradingView
Comparison Chart
BNB/USD, DOGE/USD, SOL/USDT year-to-date comparison. Source: TradingView
BNB Potential Growth
BNB has risen about 6% thus far this month, hitting approximately $1,065 on Thursday. This increase stems from a wider recovery initiated after the asset successfully held the 20-day exponential moving average near $1,000 as support. Historically, such rebounds from this level have led to significant gains.
 Daily Price Chart
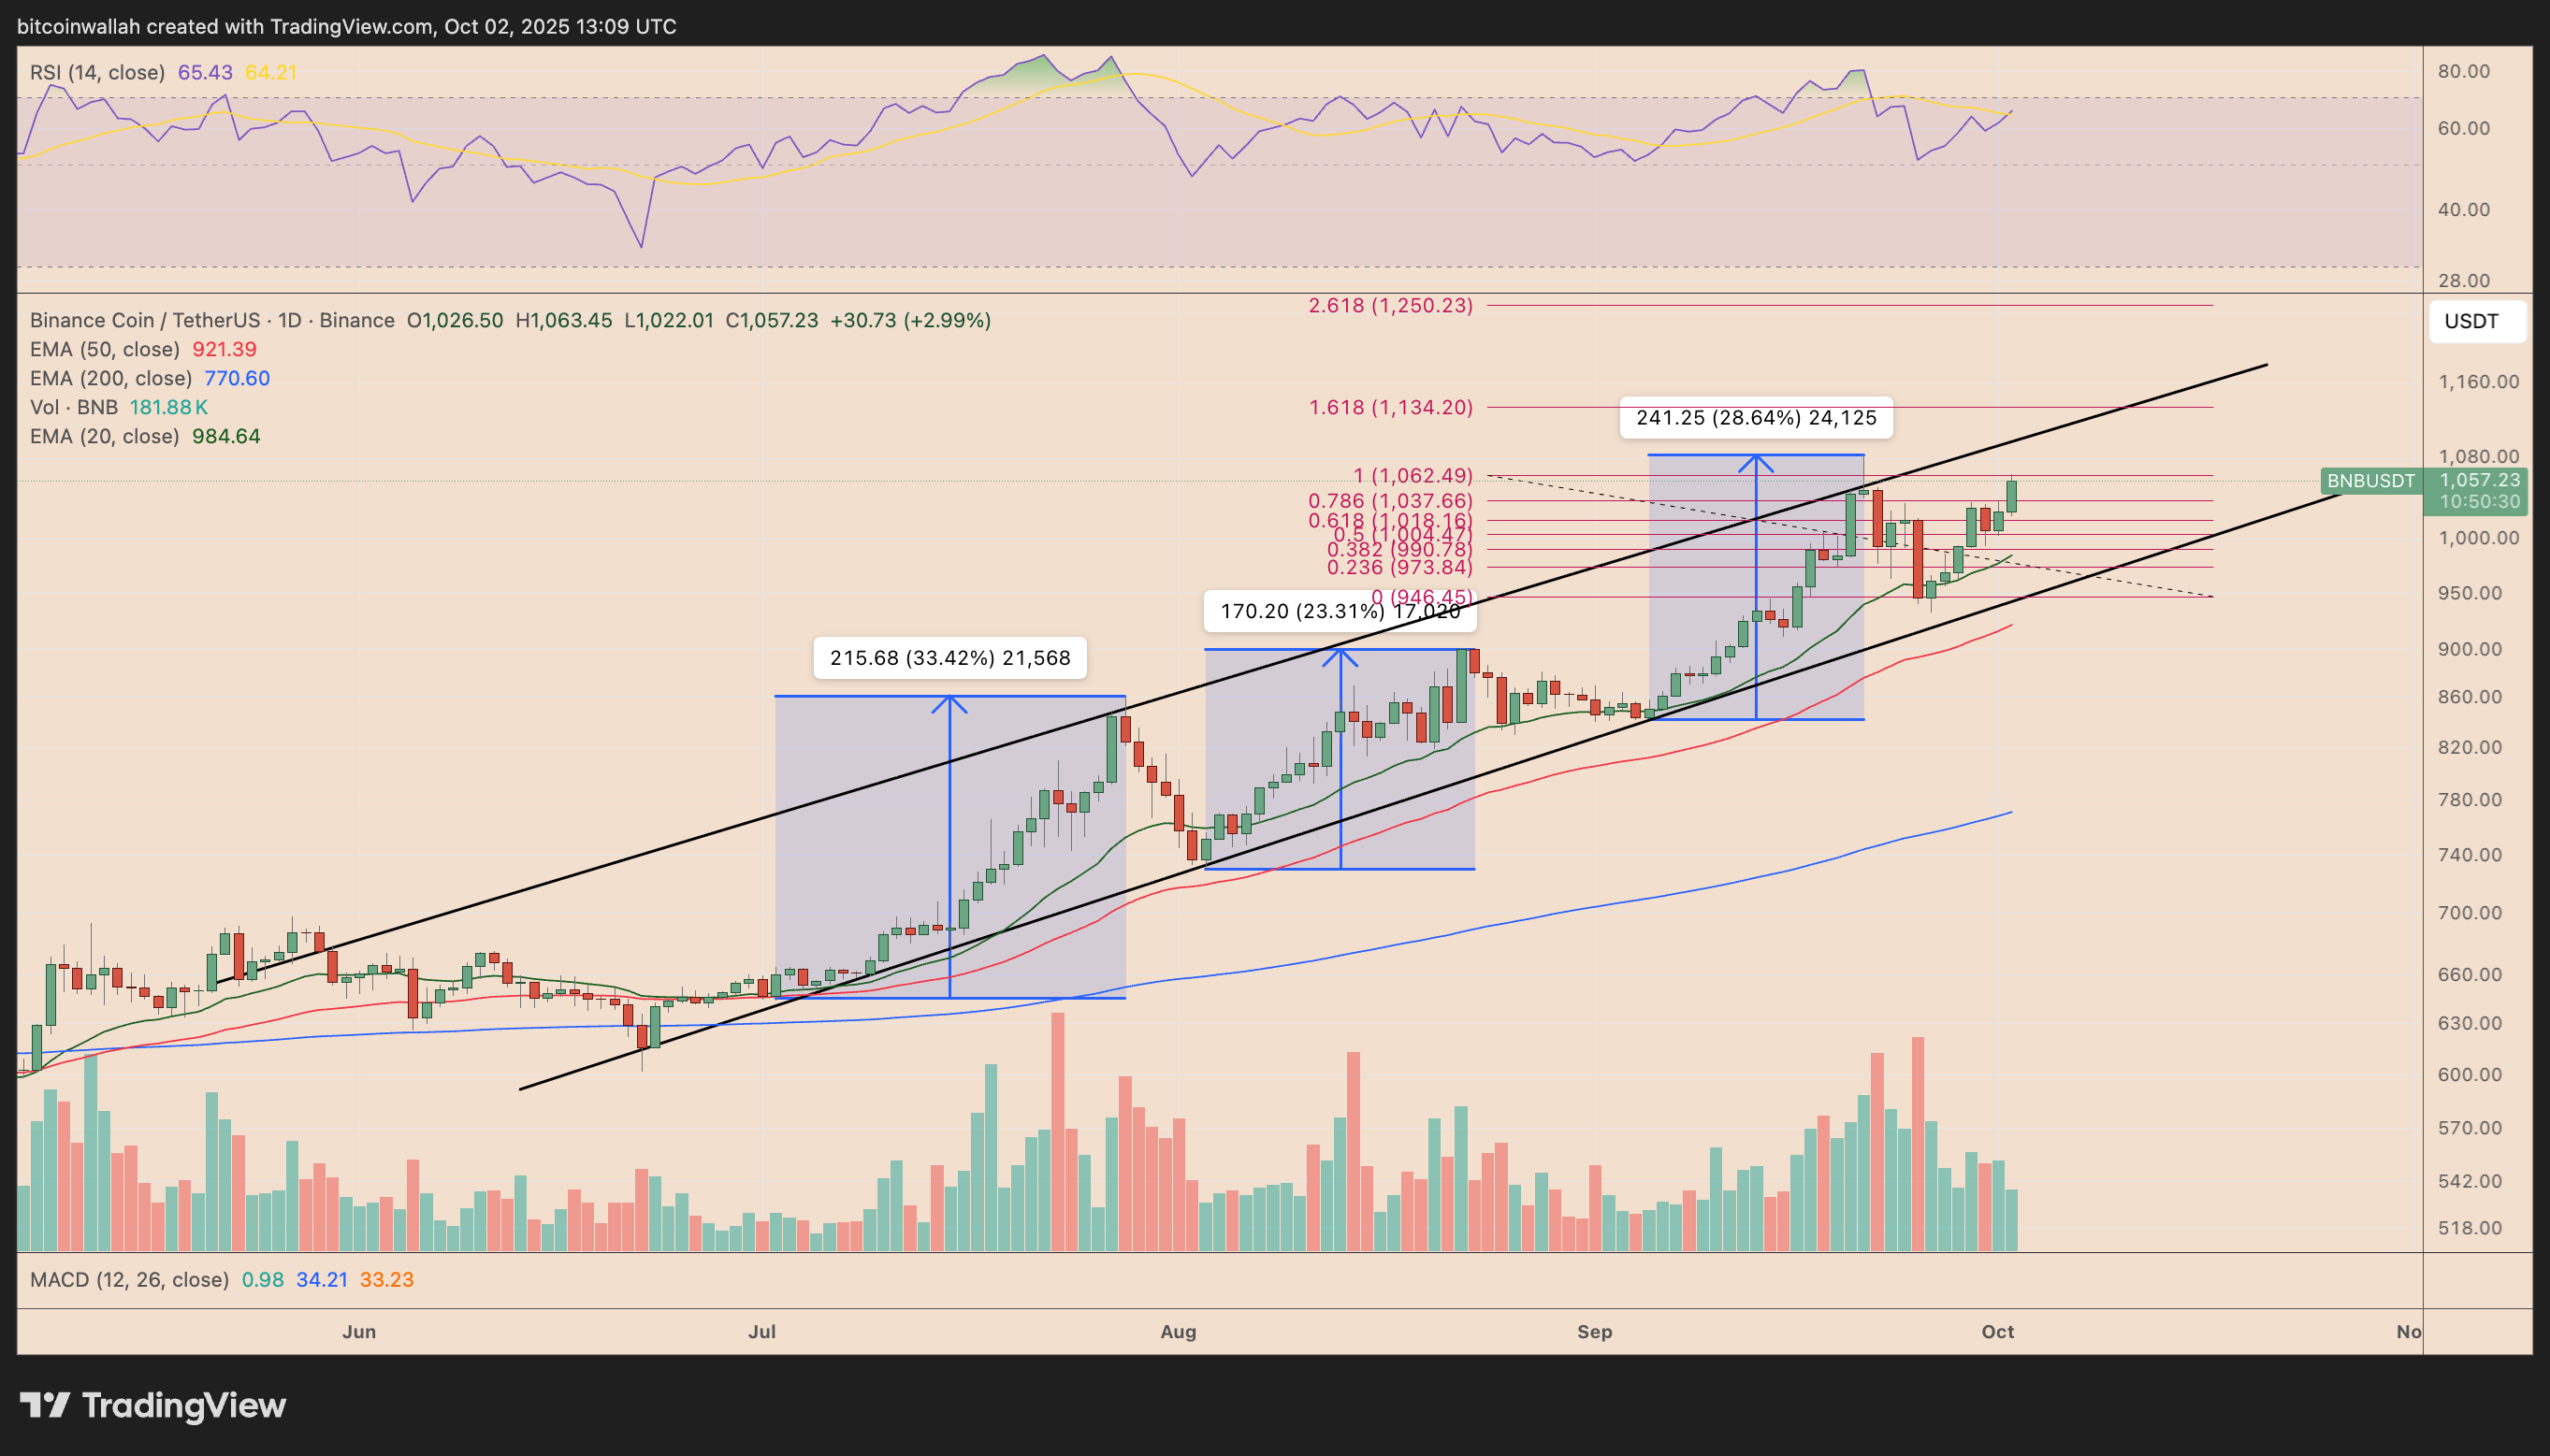
BNB/USD daily price chart. Source: TradingView
Daily Price Chart
BNB/USD daily price chart. Source: TradingView
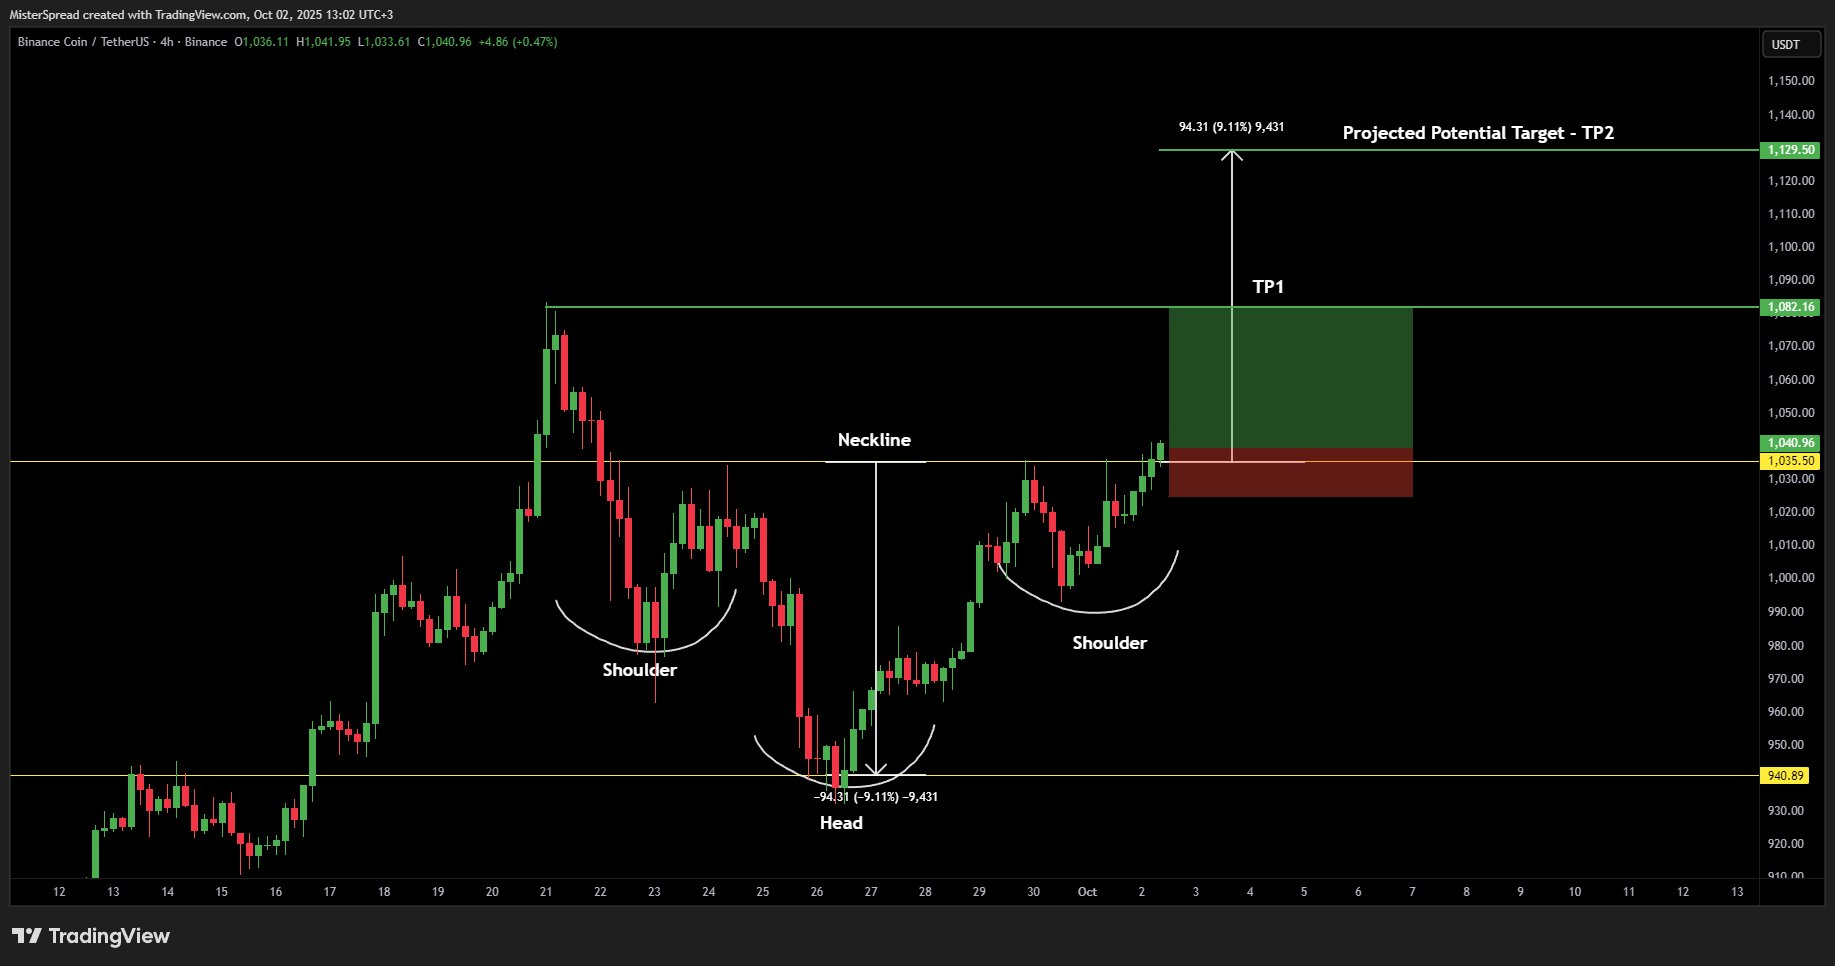
The price of BNB, trending within a rising channel, may target $1,130 in October, coinciding with a Fibonacci level indicator. Market analyst MisterSpread supports a projected upside based on BNB’s inverse-head-and-shoulders pattern.
 4-hour Price Chart
BNB/USD four-hour price chart. Source: TradingView
4-hour Price Chart
BNB/USD four-hour price chart. Source: TradingView
Recent gains have turned a significant resistance point into support near $992 aligned with the Fibonacci line. Ongoing upward trajectory beyond $992 could see BNB reaching $1,480 by late October or November, a potential increase of over 38%. Conversely, falling below $992 could push the price down towards $835, indicating a risk of approximately 20%.
Solana’s Potential
Solana’s price has increased by 9% in October, currently around $227.50, and bears a favorable setup for hitting $250 shortly. Its upward trend has unfolded inside a rising wedge since February 2025, poised to retest the upper boundary near $250, which aligns with a key Fibonacci marker.
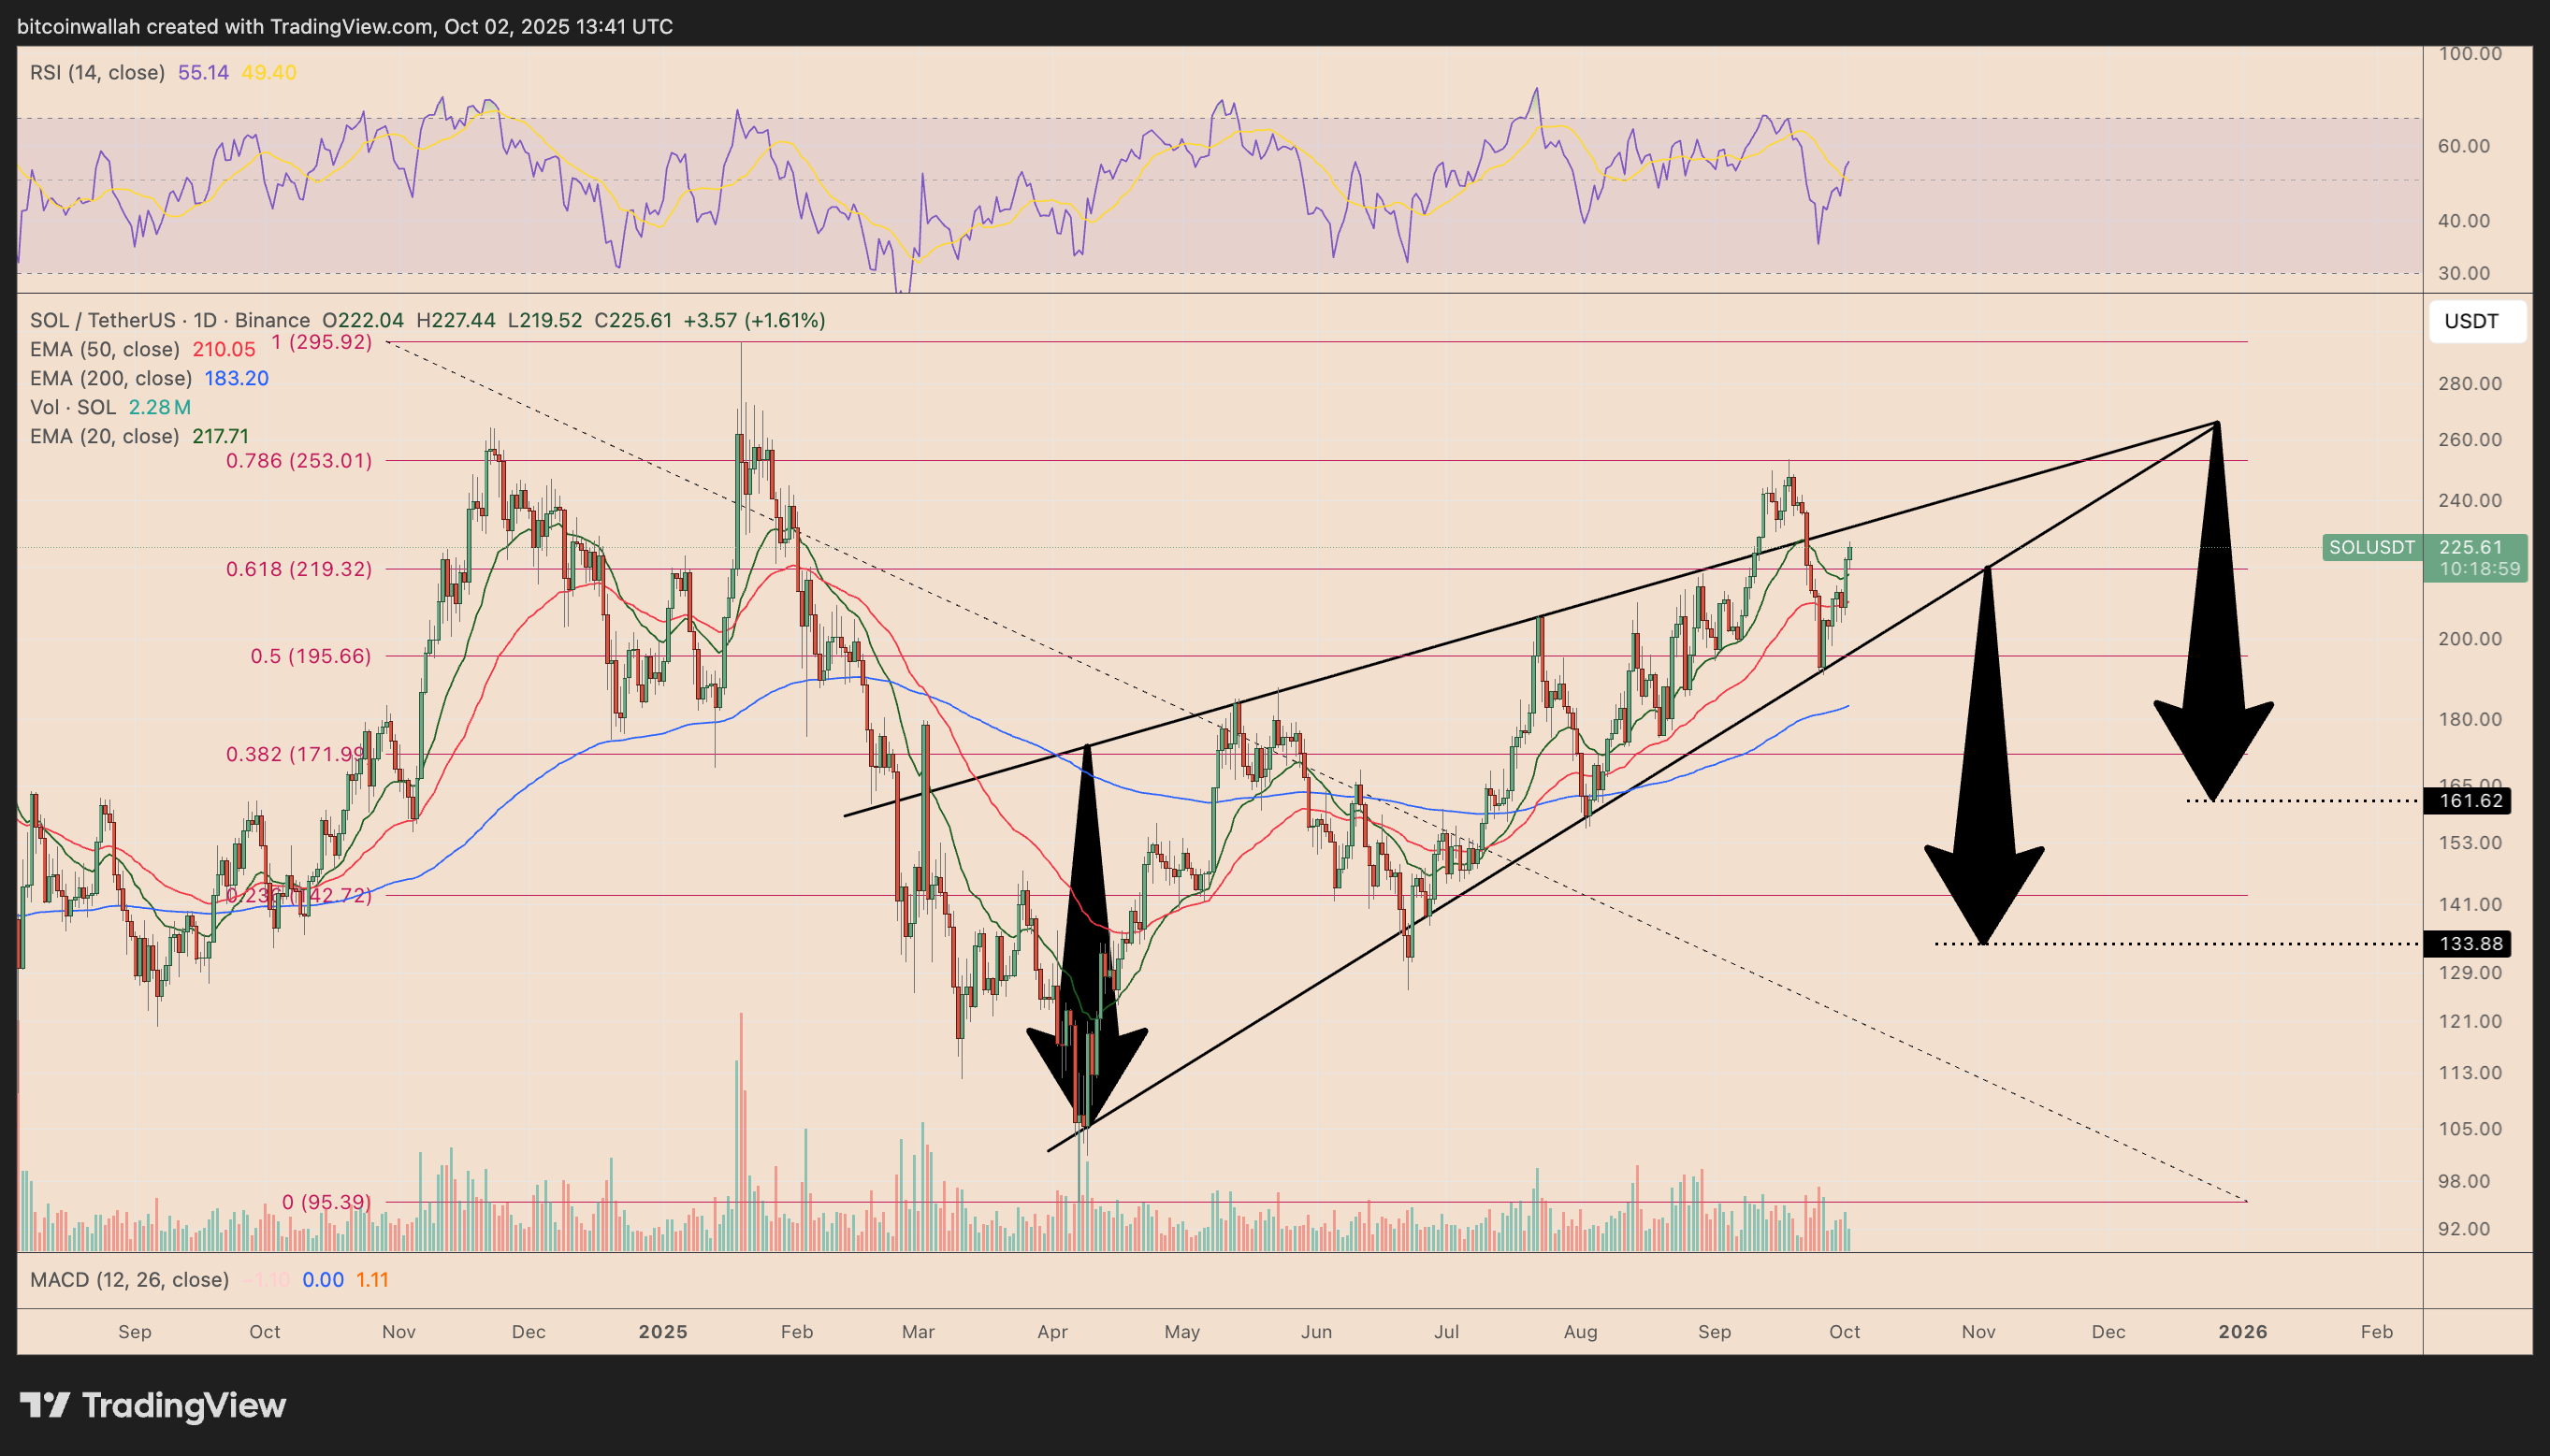 SOL Daily Price Chart
SOL/USD daily price chart. Source: TradingView
SOL Daily Price Chart
SOL/USD daily price chart. Source: TradingView
Market analysts generally view rising wedges as indicators of potential downside reversals. Should SOL breach the lower boundary of this pattern, the decline may be significant.
In contrast, if SOL rises beyond the wedge’s resistance, the asset may target the $295-300 mark.
Dogecoin’s Upside Potential
Dogecoin has jumped over 11% in October so far, currently showing potential for roughly 20% gains. Known for its price rallies, DOGE aims towards the higher range of $0.30–$0.31, aligning with important Fibonacci retracement levels.
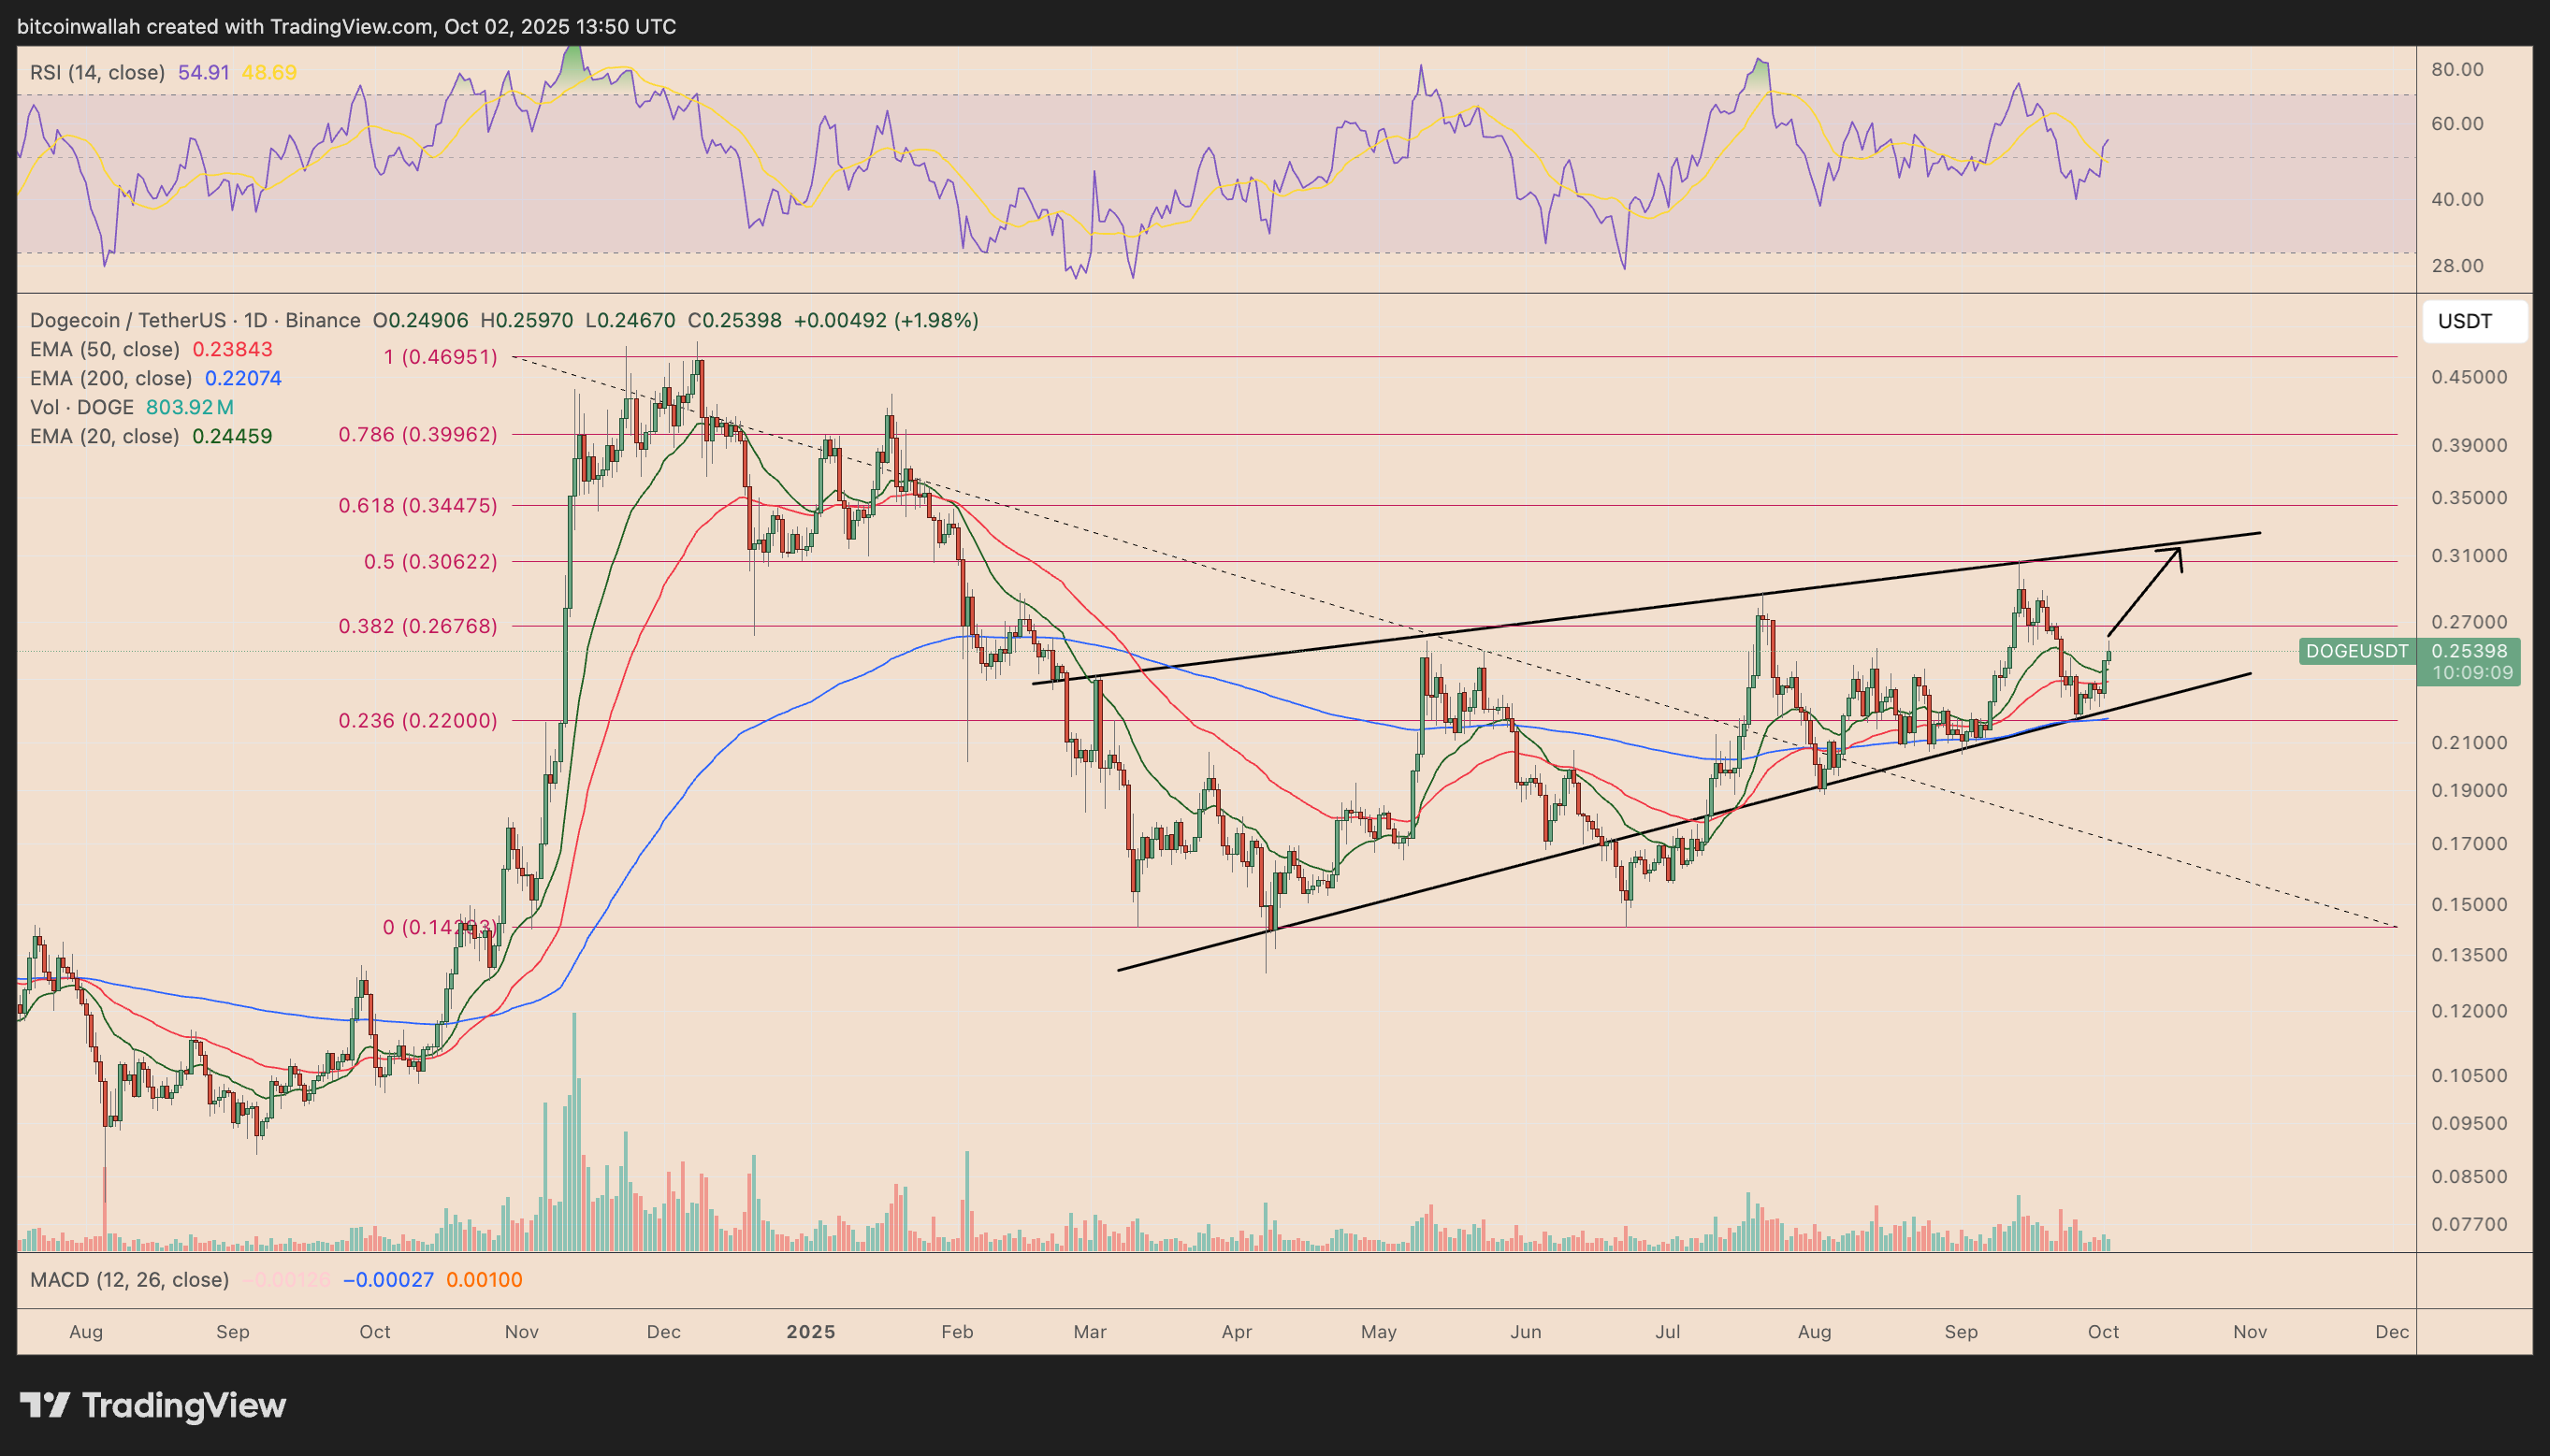 DOGE Daily Price Chart
DOGE/USDT daily price chart. Source: TradingView
DOGE Daily Price Chart
DOGE/USDT daily price chart. Source: TradingView
On the downside, a dip below the 20-day EMA near $0.25 could hinder bullish prospects, with possible retracement towards $0.22.
