Is PEPE Preparing for a Surge? Significant Chart Indicators Suggest an Upcoming Move
PEPE's chart trends and increasing whale interest hint at a potential price breakout in the near future.


Pepe (PEPE) is starting to garner attention in the trading community, as recent chart trends indicate a possible upward movement. Currently, the token price hovers around $0.00001, with a trading volume surpassing $608 million in the last 24 hours.
Despite a slight dip on the daily charts, PEPE has shown an 8% increase over the past week, with observers now eyeing the $0.0000125 region as a significant target for breakout potential.
Bullish Indicators Suggest a Trend Change
Analysts from Bitcoinsensus report the formation of a Power of 3 (PO3) setup on the PEPE/USDT chart. This configuration typically includes a phase of sideways motion, a temporary downturn past support, and a subsequent breakout above resistance levels. The recent fluctuations and recovery during late September resonate well with this predictive model.
“#Pepe Power of 3 Setup in Play 📈⚡ $PEPE could be targeting the 0.0000125$ zone next.”
(Translation: The chart indicates a promising future for the PEPE token.)
Remarkably, this pattern showcases a transition from a false breakdown, a scenario termed a bear trap, into a potentially strong upward movement. If momentum holds, traders will keep a close watch on the $0.00001250 region as the next critical focus.
Weekly Patterns Reflect Historical Trends
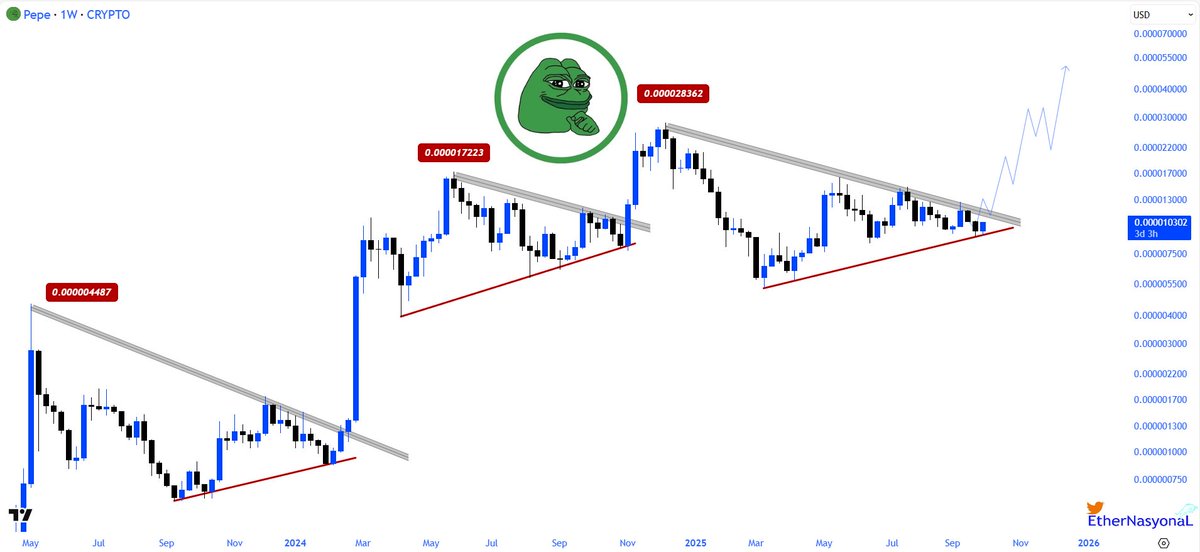
A weekly chart shared by EtherNasyonaL illustrates PEPE converging into another triangular formation, paralleling previous patterns that led to significant price surges. Earlier rallies originated from lower levels like $0.00000045, followed by significant breakouts.
The recent setup near the upper trendline raises hopes for a similar rally, suggesting that the current price consolidation may soon culminate in upward movement.
Additional blockchain analysis from Nansen indicates a decrease in token holdings among smaller wallets, declining from 259 trillion to 253 trillion over the past month, while the top 100 addresses have increased their holdings by 4%, now controlling a total of 307 trillion tokens.
This redistribution reflects accumulation trends commonly observed during periods of waning activity.
Short-term Trends and Technical Analysis
In short-term technical assessments, PEPE recently experienced a pullback, having moved sharply higher prior to this. The Bollinger Bands indicate an expansion, signaling that further price fluctuations are expected. Currently trading around $0.0000097, the token lies close to the mid-band after retreating from higher levels.
Nonetheless, the MACD remains in positive territory, indicating strength unless substantial support is breached, although the momentum appears to be lessening.
For traders and enthusiasts, the upcoming movements in the PEPE market could present lucrative opportunities as indicators strongly suggest an inflection point ahead.
