Chainlink Price Surge: Is a Jump to $47 Imminent?
Chainlink (LINK) experiences a 10% price increase, prompting analysts to speculate on its potential to reach $47 soon as technical indicators align.


Chainlink Price Surge: Is a Jump to $47 Imminent?
Chainlink (LINK) is currently priced around $22 after experiencing nearly a 10% increase over the last week. Traders are now focused on whether LINK can continue its ascent towards $47, a price point that corresponds with its highs from 2021.
Technical Indicators Favor Upward Movement
Analyst Ali Martinez presented a 3-day chart indicating that LINK has been navigating within an ascending parallel channel since 2023. The asset’s price holds above $20, which coincides with the 0.786 Fibonacci retracement level. Maintaining this position could pave the way for additional gains.
Notably, projected price milestones include potential values of $29, $35–$39, and ultimately $46, aligning with the 1.272 Fibonacci extension and the top channel line. Martinez commented:
Market Dynamics and Resistance Levels
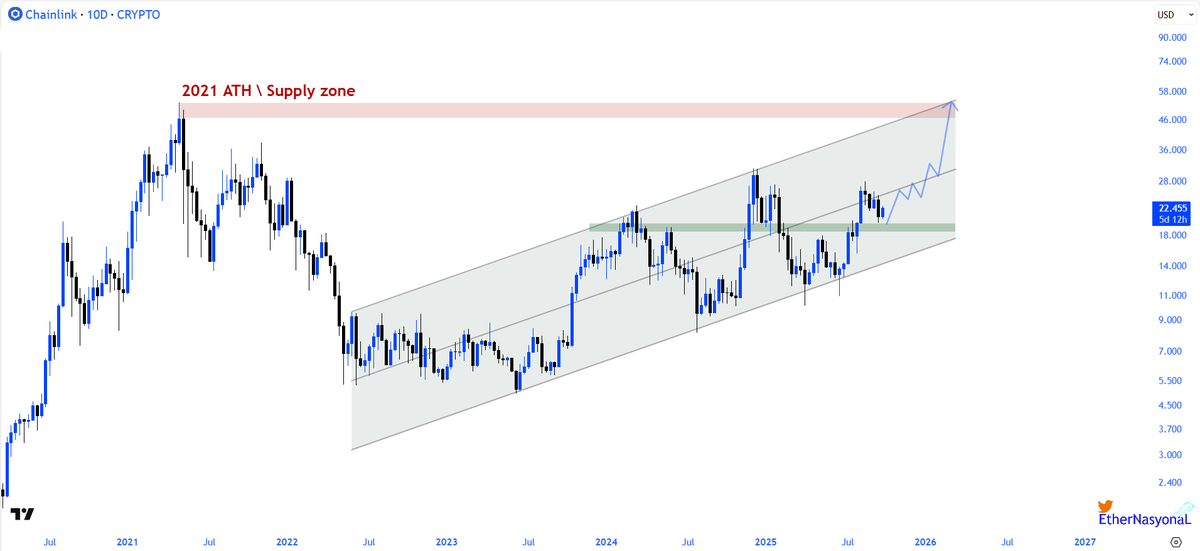
EtherNasyonaL pointed out that LINK recently broke above the channel’s middle band. If LINK sustains its position above this level, it could target the upper channel boundary. The key resistance area remains the 2021 all-time high zone, which spans between $47 and $52. Support has solidified in the $18–$20 range after a successful retest.
You may also like:
Source: EtherNasyonaL/X
Moreover, there’s a surge in on-chain activities. Martinez highlighted that 1,963 new addresses joined the network on October 1, while the total value secured (TVS) in Chainlink has skyrocketed to $66 billion, from $25 billion back in April.
This growing adoption may fortify Chainlink’s standing in decentralized finance and support potential price increases if the momentum persists.
Immediate Market Signals
Currently priced at $22, LINK shows a tight convergence of EMAs (20, 50, 100, and 200) on the 4-hour chart. This tight range signifies a significant decision area, where a breakout above or below is likely to determine the forthcoming direction.
Technically, the MACD indicator shows a slight bearish crossover, hinting that momentum may be waning, pointing towards a potential sideways move or a pullback prior to another breakout attempt.
Amidst these technical analyses, Chainlink is also making strides in the real-world asset sector with alliances with global institutions including Swift, DTCC, Euroclear, UBS, and BNP Paribas.
