
Bitcoin Price Insights: Anticipating a Rebound to $118K Prior to the Next Ascent
Bitcoin's recent spike to $125K reflects vigorous momentum, though analysts predict a pullback before the next significant move upwards.


Bitcoin has exceeded its all-time high (ATH) in the $125K range, indicating robust market momentum.
However, the market is entering a critical phase where consolidation or a temporary retracement might dictate the forthcoming significant movement.
Bitcoin Price Analysis: Technical Overview
Daily Chart
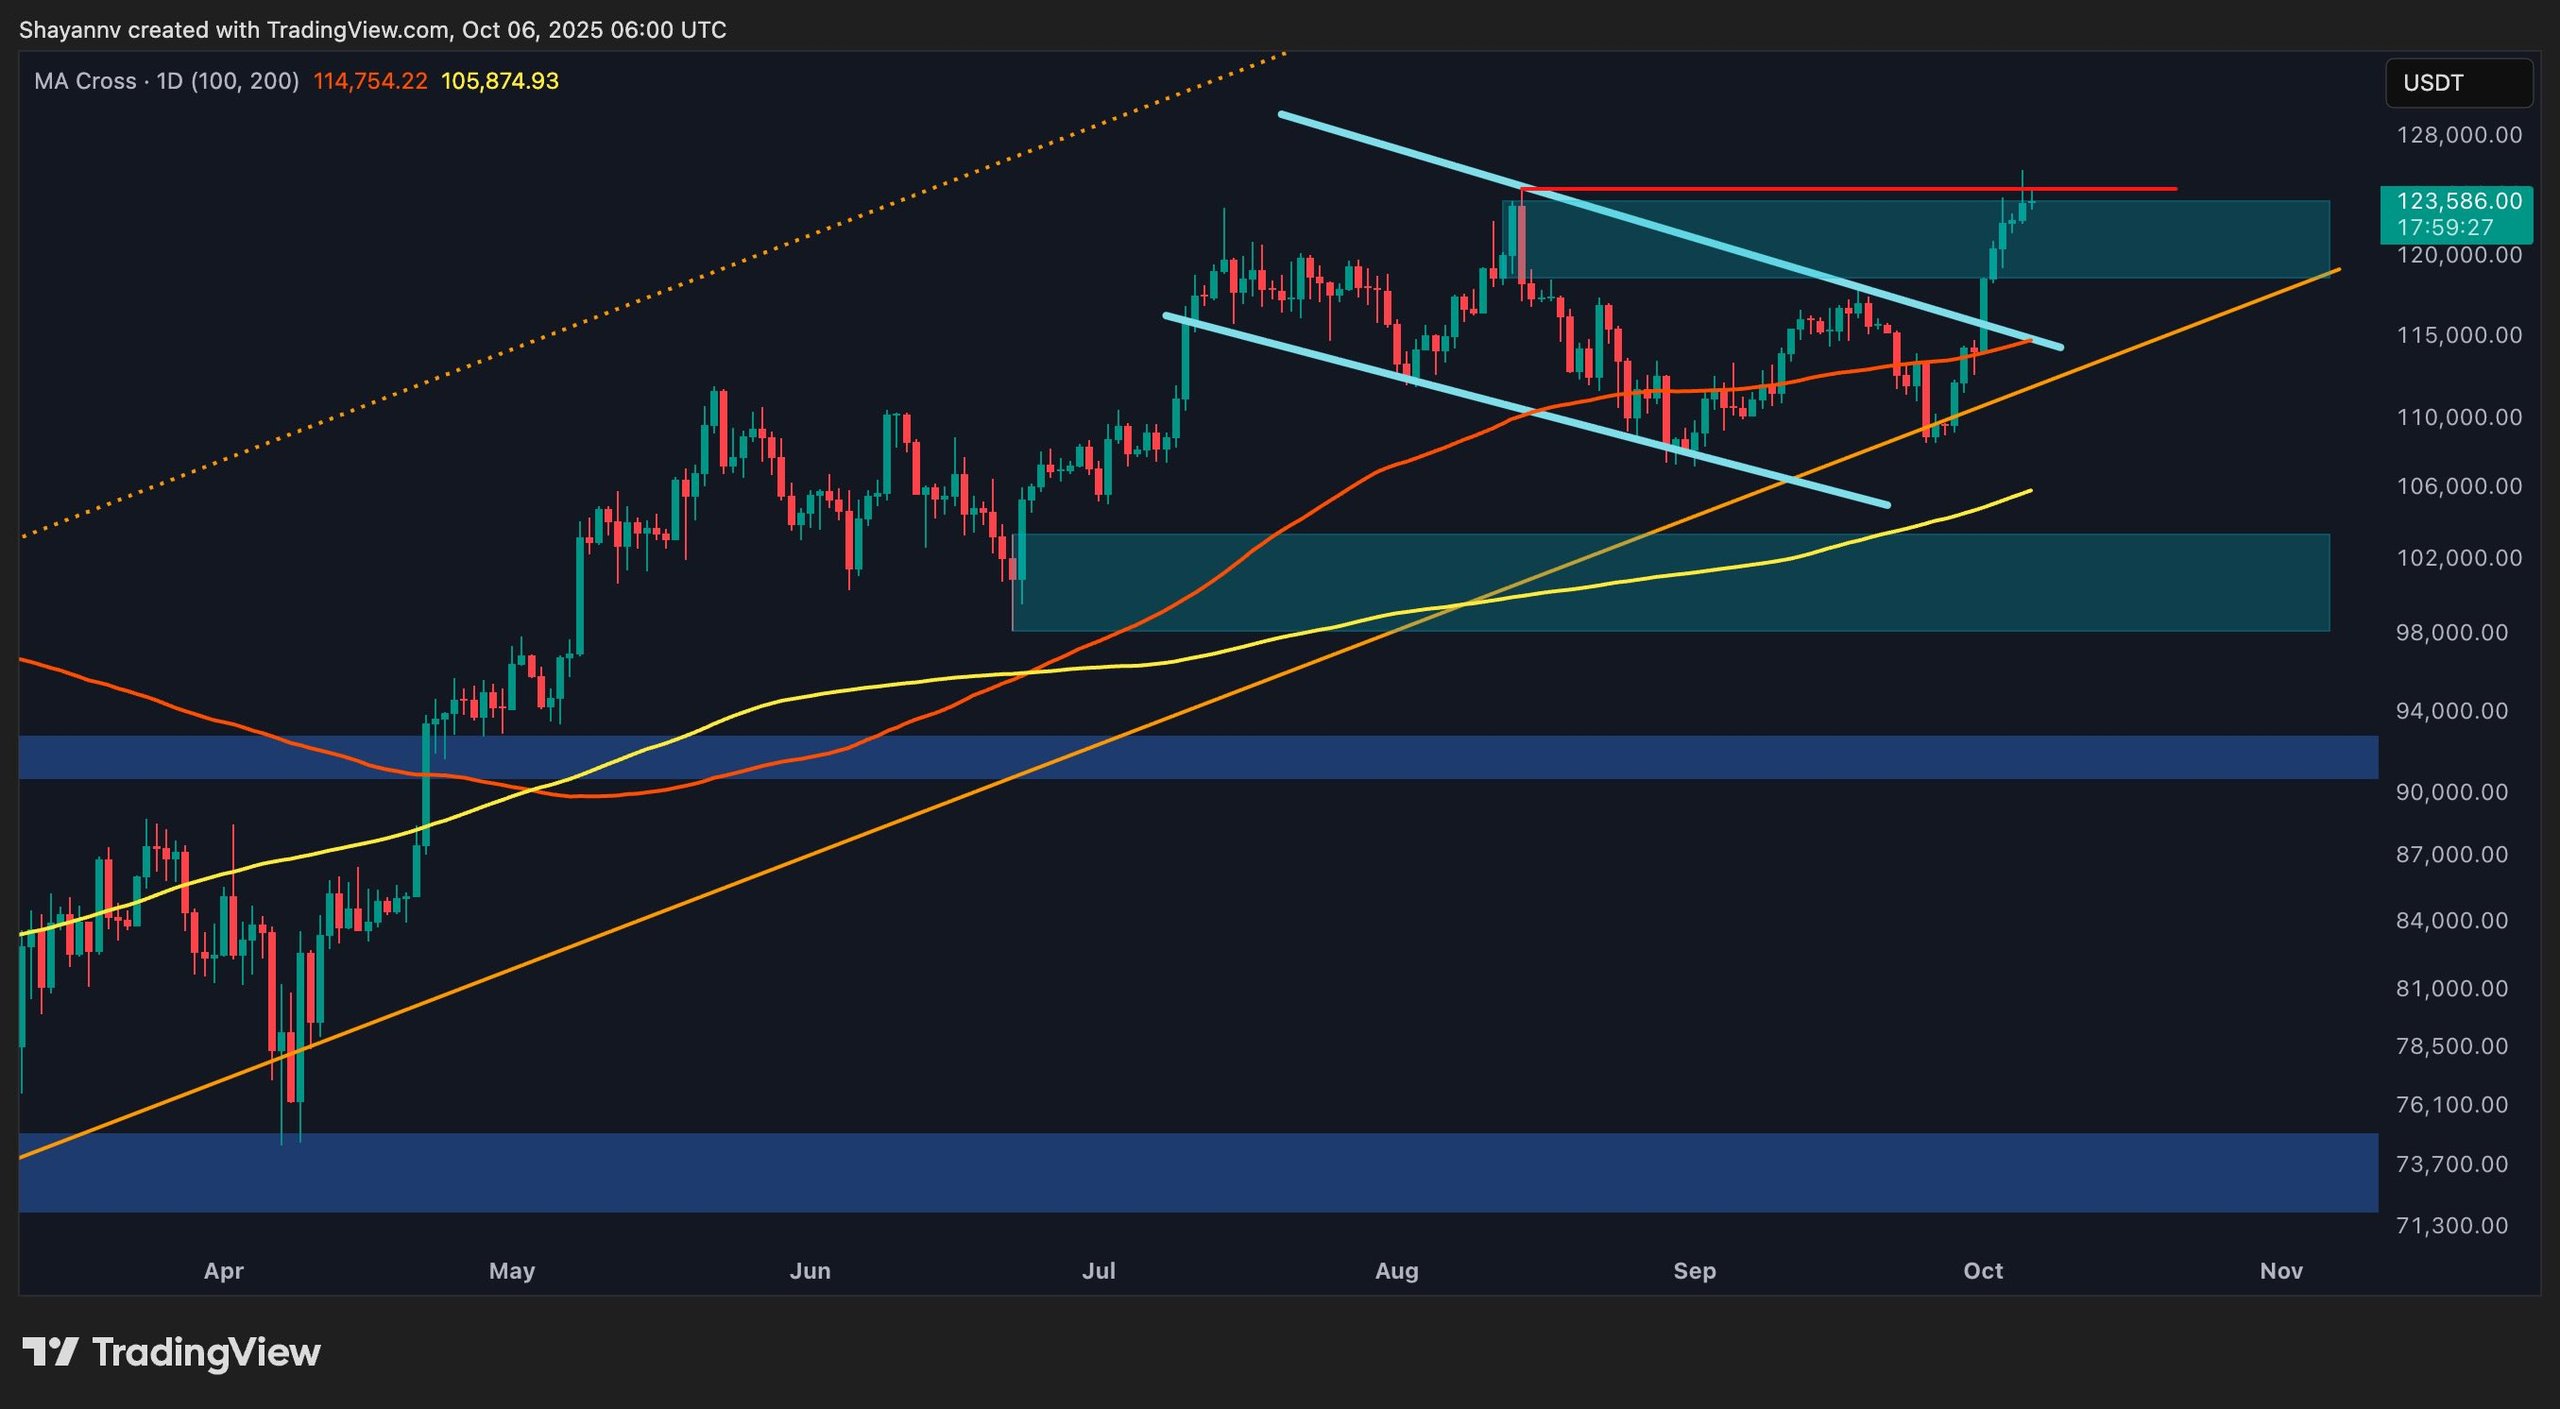
On the daily chart, BTC has breached a flag pattern that has constrained price movement since July, affirming a strong continuation of the trend. This breakout coincided with a surge in momentum that propelled the price into the prior supply zone around $124K–$126K, where sellers have begun to exhibit slight resistance.
The bullish structure is still intact, supported by the golden cross observed between the 100-day and 200-day moving averages, which serve as dynamic support lines. As long as the price holds above $120K, the overarching uptrend remains valid, with a solid daily close above $126K potentially paving the way towards $130K–$132K in the near term.
Nonetheless, a failure to maintain above $120K could lead to a healthy retracement towards the mid-range support around $115K, closely aligning with the breakout structure and the 0.618 Fibonacci retracement.
 Daily Chart
Source: TradingView
Daily Chart
Source: TradingView
4-Hour Chart
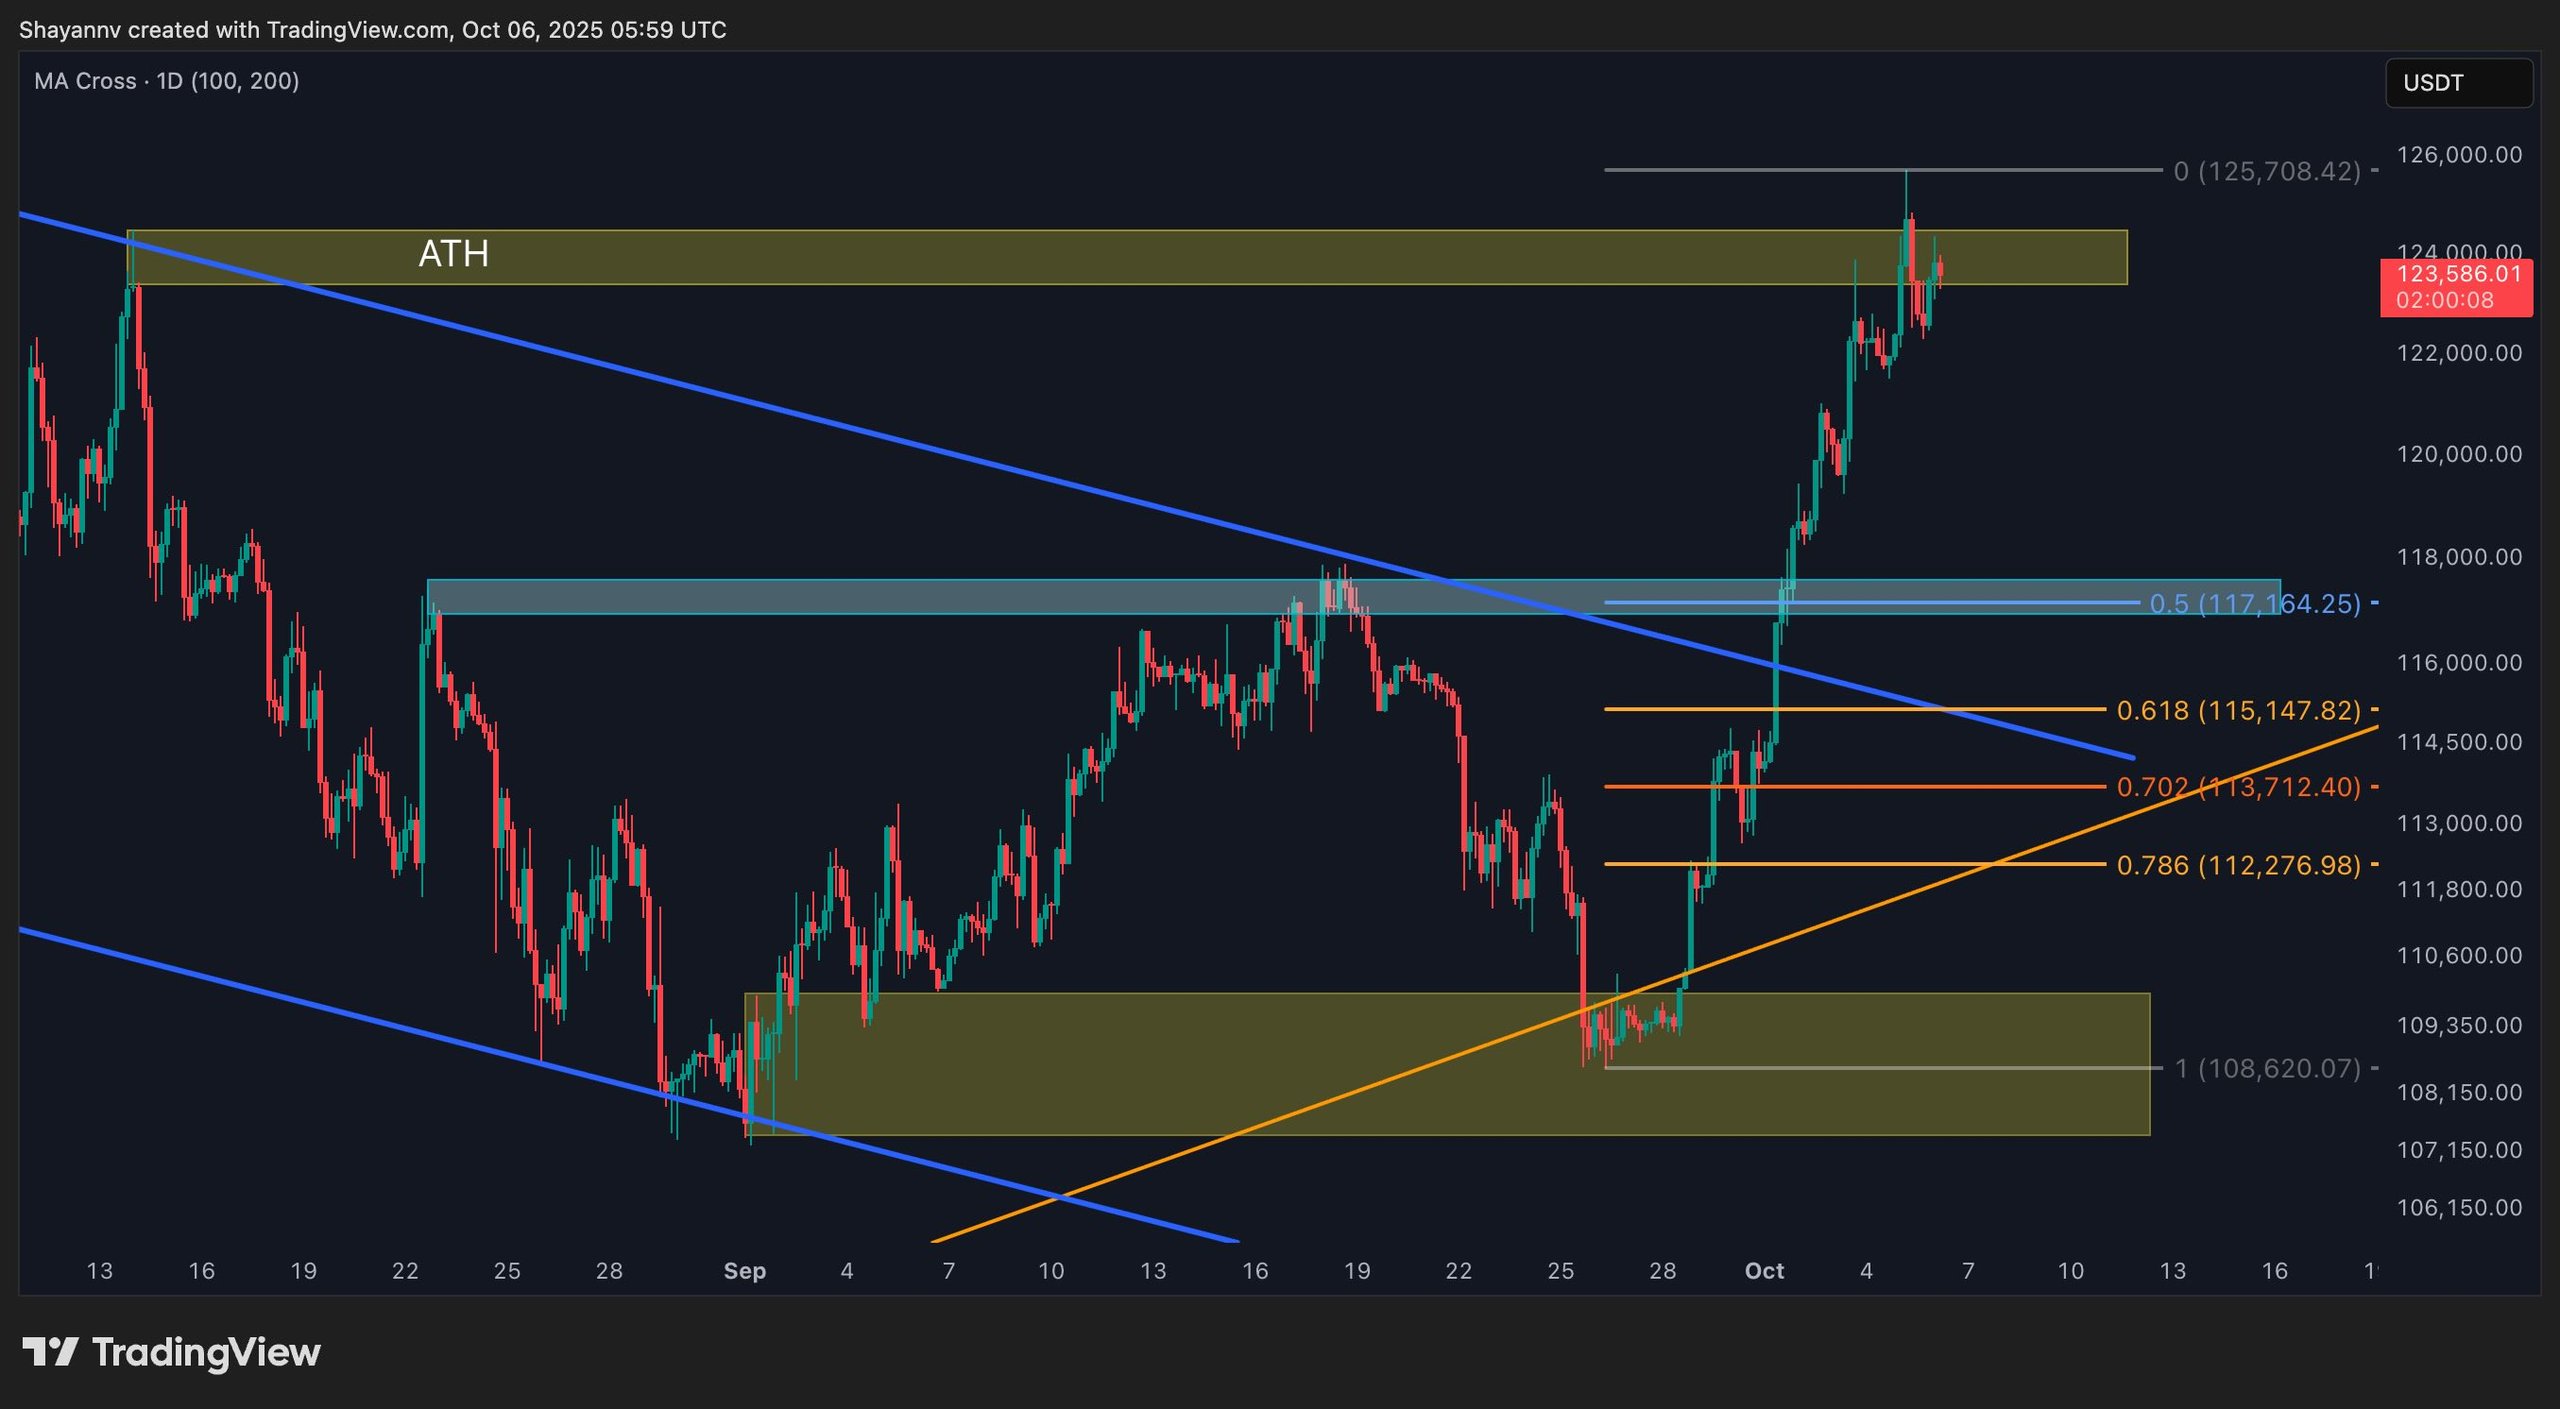
The 4-hour chart illustrates BTC recently hovering above the $118K critical point, setting a breaker block and accelerating toward the ATH territory near $125K. The aggressive nature of this upward movement has resulted in a clear imbalance, with potential retracement zones identified between $115K and $113K, corresponding with Fibonacci confluence levels (0.618–0.702 range).
This area acts as a re-accumulation zone in the short term, and maintaining above it would affirm ongoing bullish control with the market now consolidating near a liquidity-rich area.
 4-Hour Chart
Source: TradingView
4-Hour Chart
Source: TradingView
Sentiment Overview
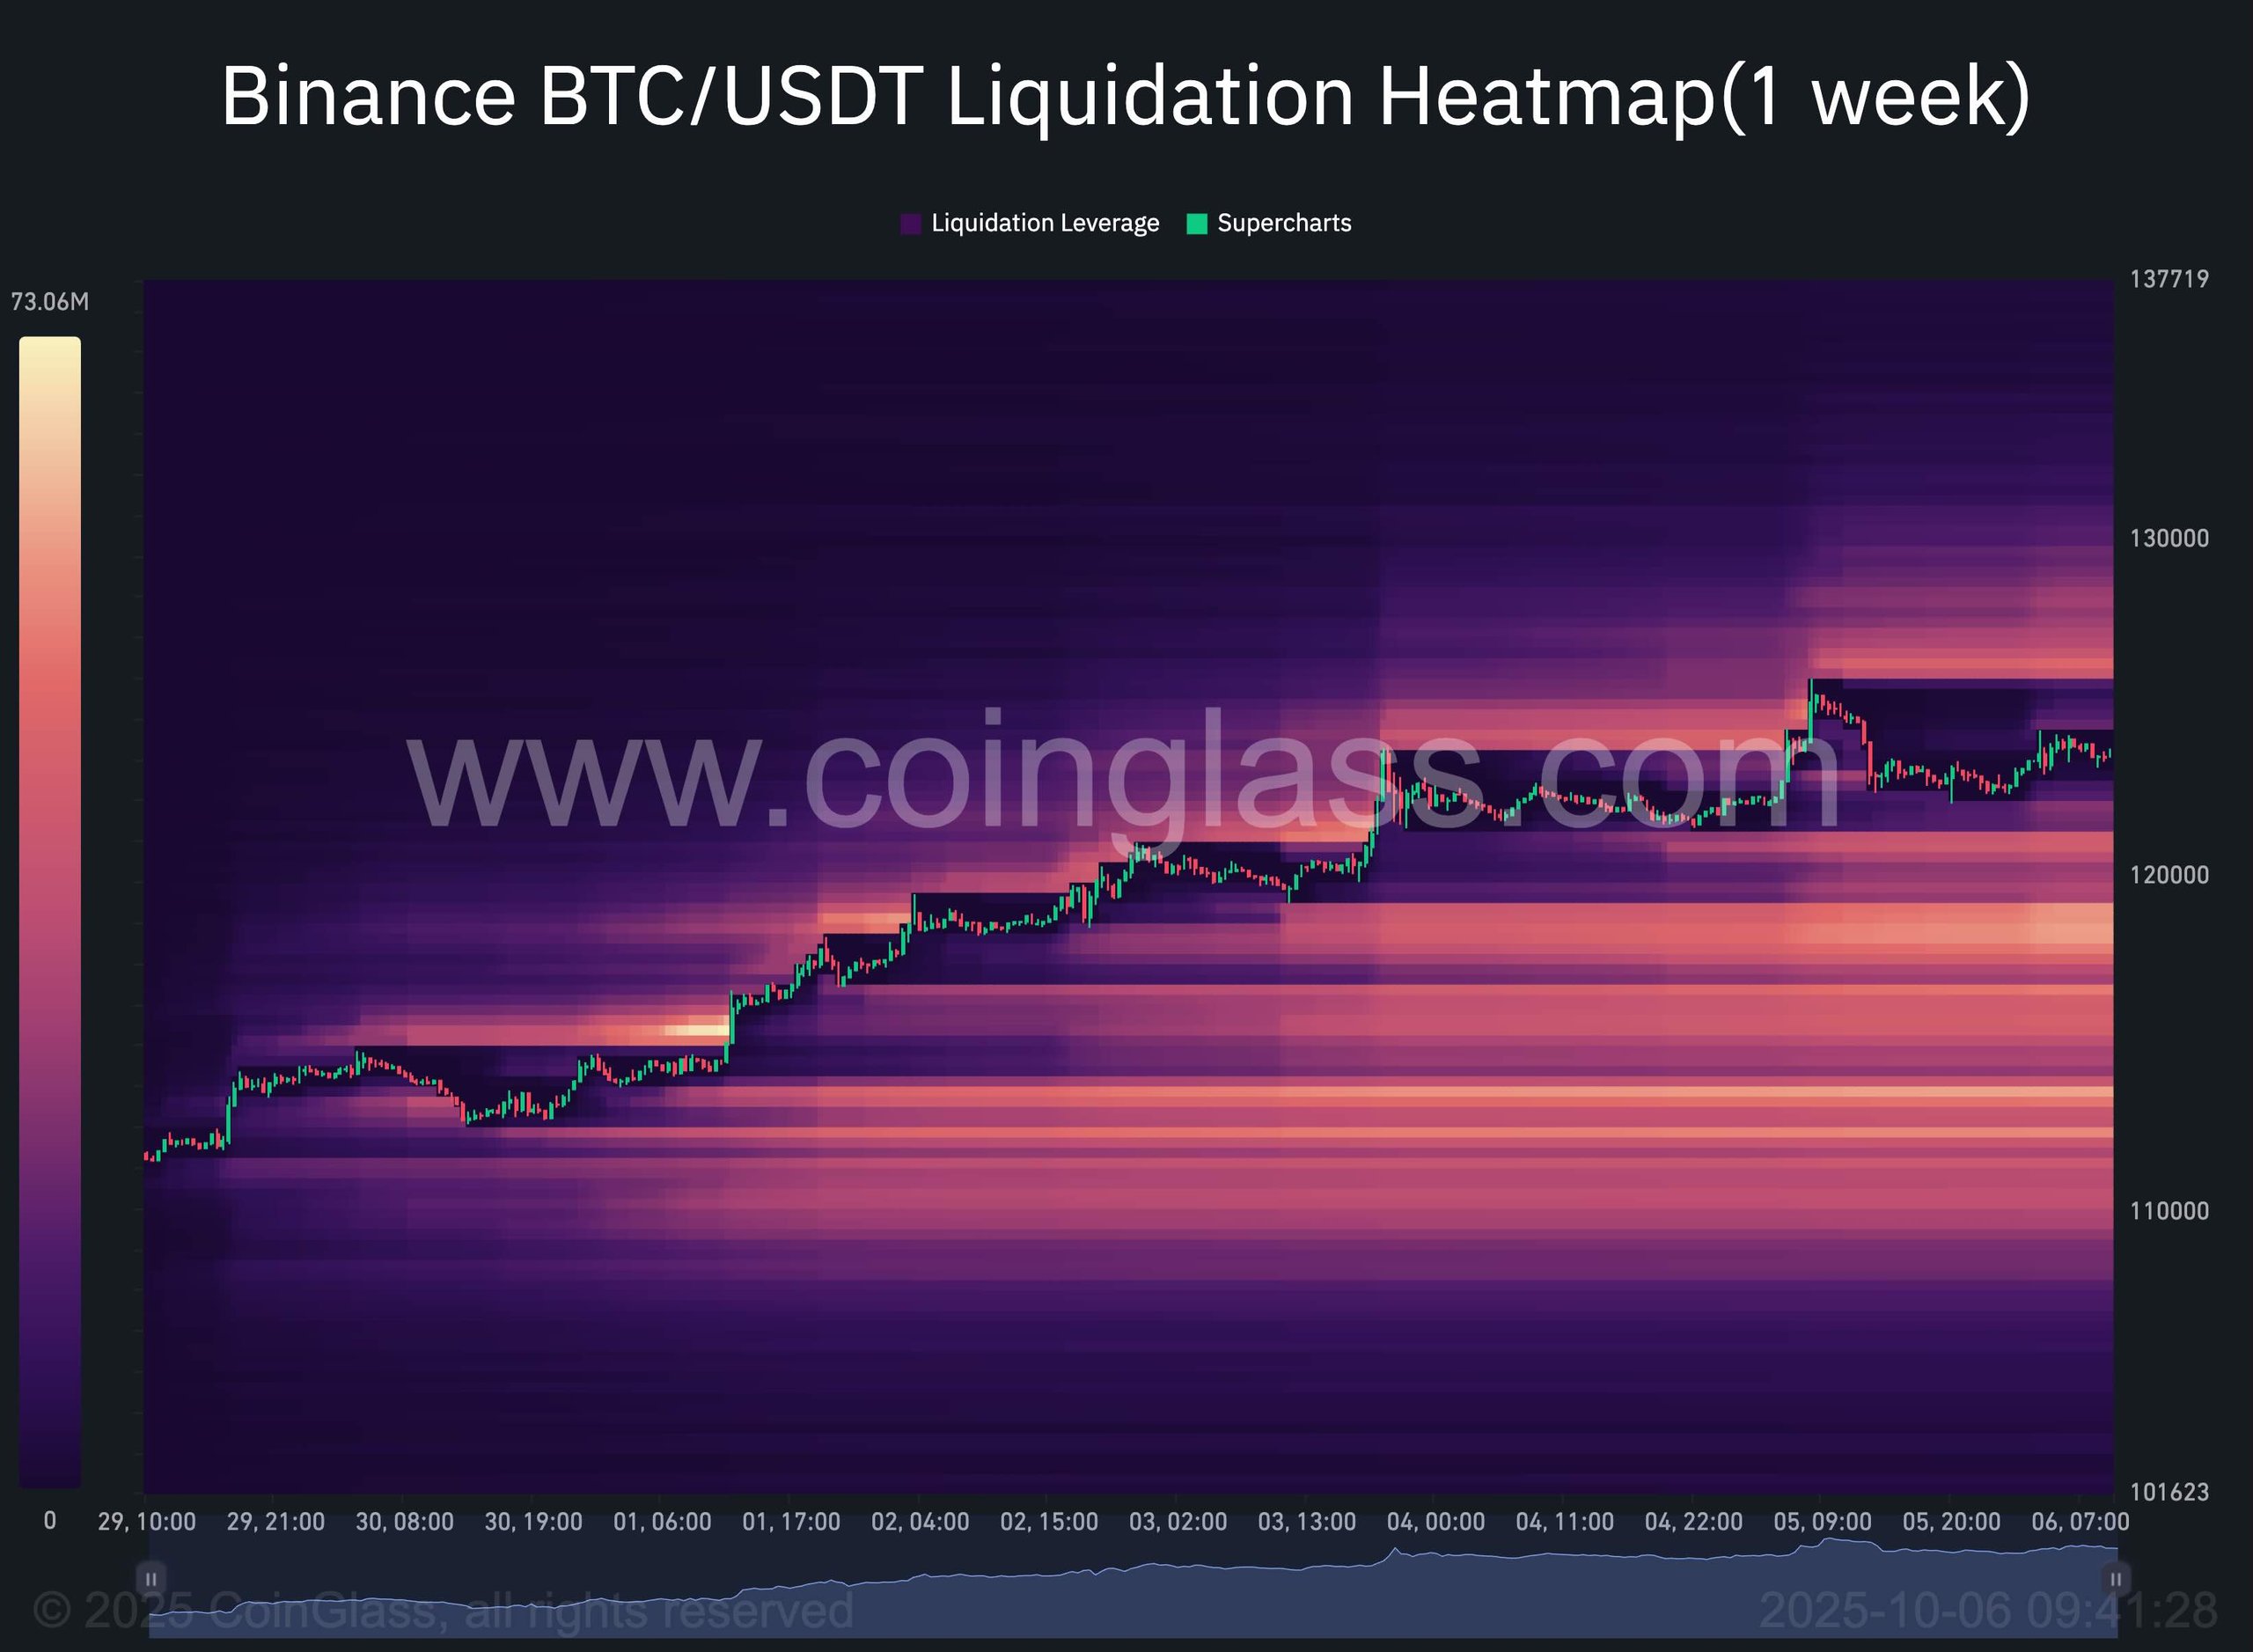
Analyzing the latest one-week Binance liquidation heatmap reveals a substantial accumulation of liquidity zones with dense liquidation clusters forming around $128K–$130K. These areas signify where a high volume of leveraged short positions has gathered, making them prime targets for potential price continuation or liquidation sweeps.
As we review the recent rally from $110K to above $123K, a steady absorption of lower-level liquidity is evident, with each upward movement clearing previous short positions before consolidation. The presence of significant liquidation pockets beneath the current price, particularly around the $120K mark, emphasizes that downside risk may come into play in the short term, indicating the market might be gearing for a pullback or correction before the next major move.
The favorable price retention above $120K could indicate a short-squeeze continuation into the upper liquidity band prior to any substantial retracement taking place.
 Sentiment Analysis
Source: Coinglass
Sentiment Analysis
Source: Coinglass
