


Key Insights:
- Bitcoin’s price dipped to $122,500 on Tuesday, yet blockchain data does not indicate a market overheating.
- Resistance at $135,000 holds firm as the main obstacle for Bitcoin prices, alongside crucial support near $120,000.
Market analysts noted that Bitcoin’s trajectory remains positive despite a 1.7% decline from its recent all-time high of $126,200 achieved on Monday.
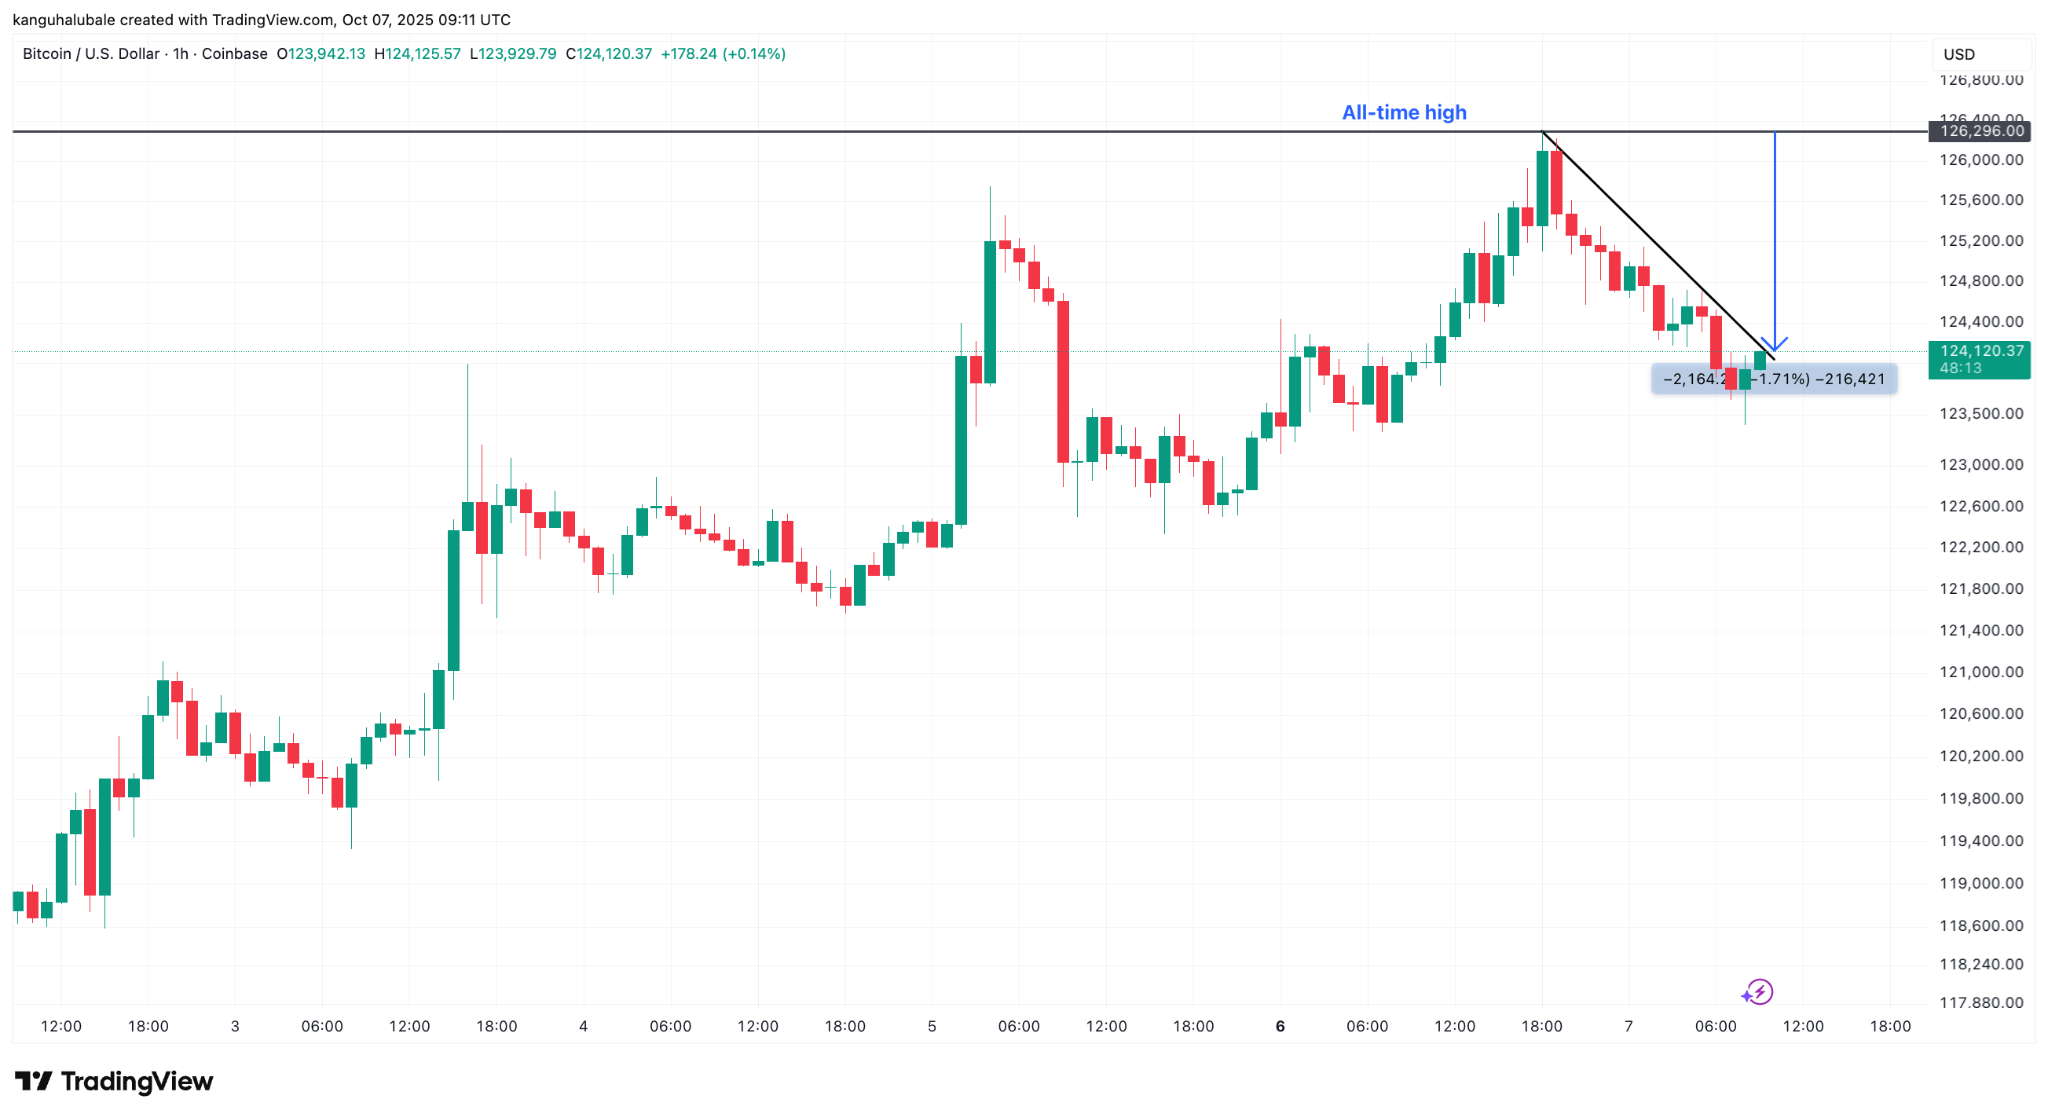 BTC/USD hourly chart. Source: Cointelegraph
Minor Retreat Expected Before Further Gains
Analyst Mags remarked in a recent post that “BTC has been in an up-only mode,” reporting just a single downturn in the previous 11 days. The BTC/USD pair is currently experiencing a small decline toward the important support level of $123,300. Closing above this level daily may allow Bitcoin to “move higher”, while failure to maintain this support could lead to a reassessment of the $120,000 range.
“Overall, dips are for buying, and the next resistance is near $135,000.”
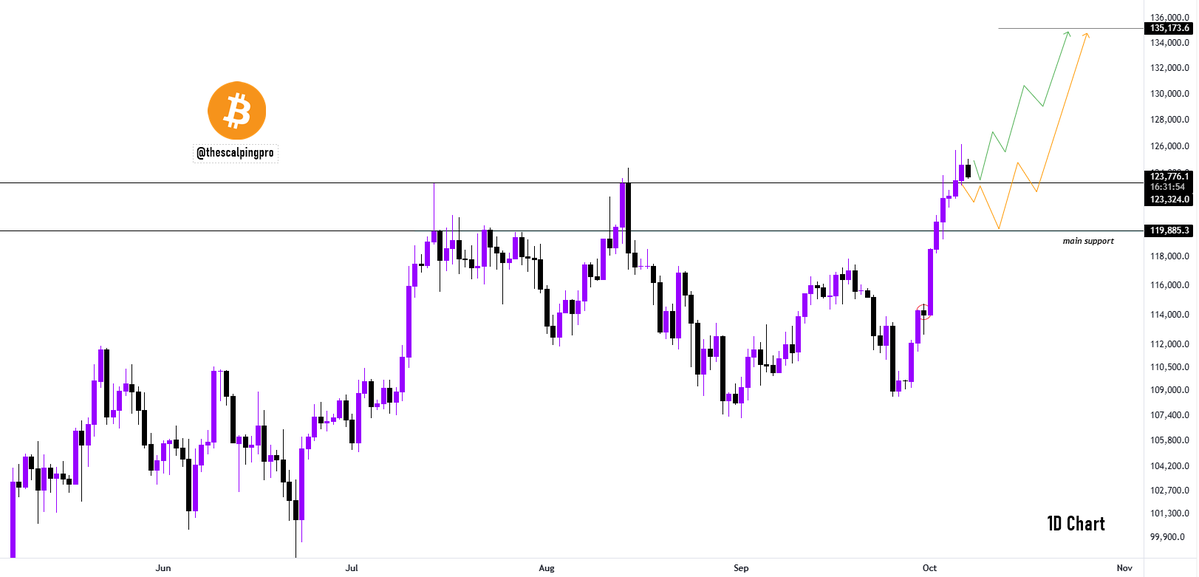 BTC/USD daily chart. Source: Mags
Michael van de Poppe, founder of MN Capital, added in his recent commentary that Bitcoin is currently consolidating near its historical peak, stating:
“It’s building up stamina for the next significant breakout toward $150K.”
He indicated that the optimal entry point during a potential correction lies within the $118,500 - $120,500 range.
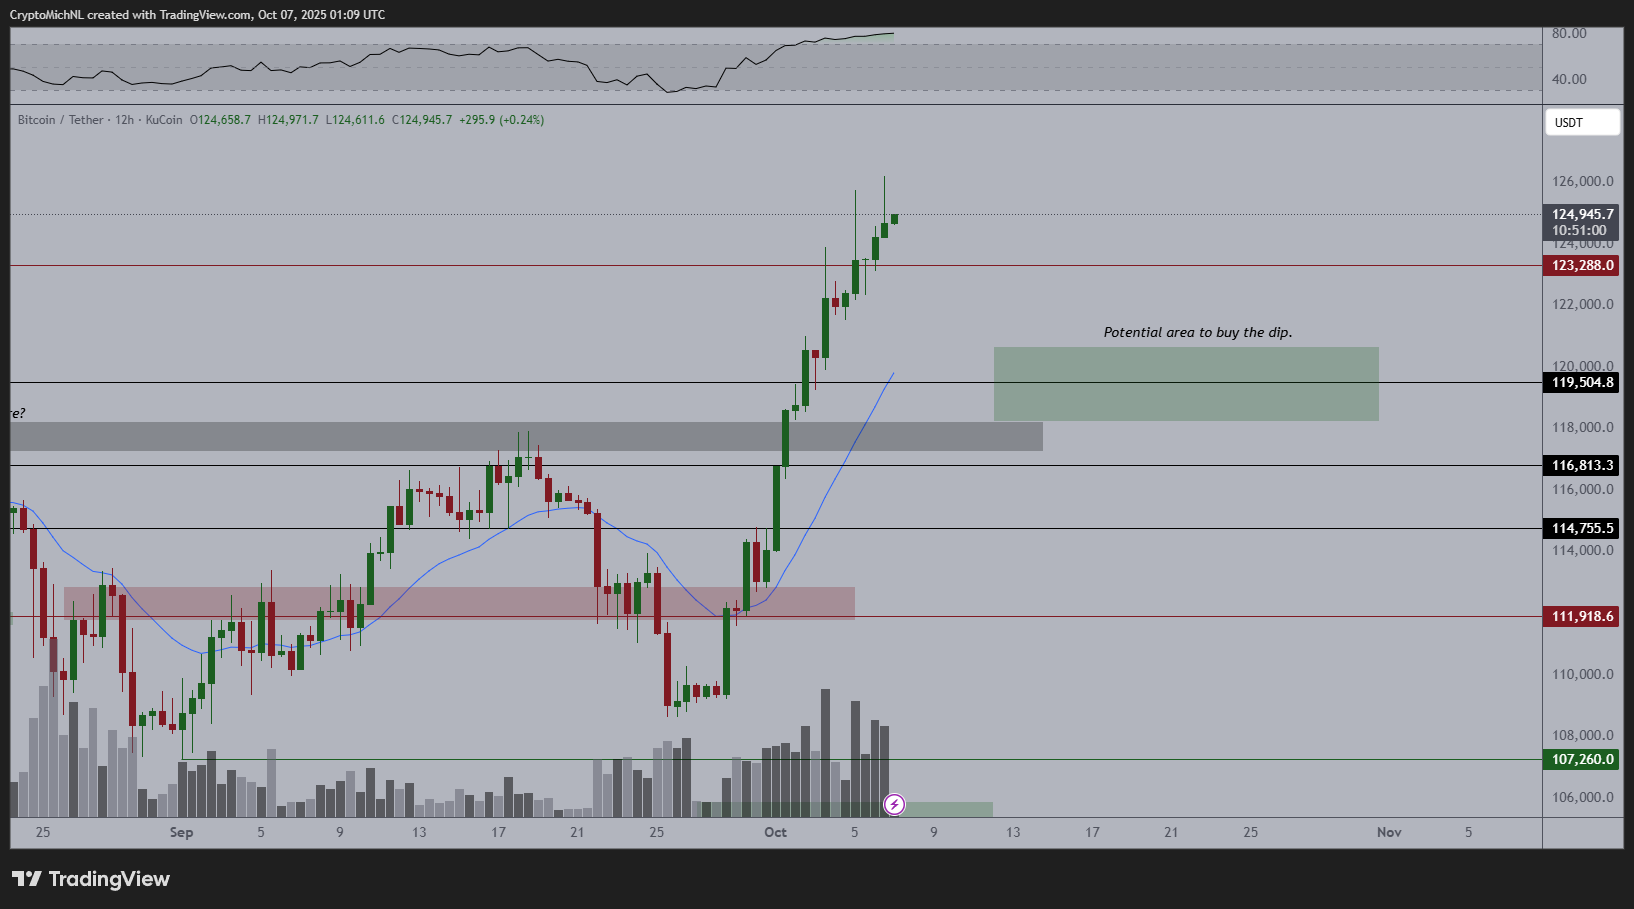 BTC/USD 12-hour chart. Source: Michael van de Poppe
As reported by Cointelegraph, Bitcoin might trade within a tight range between $122,000 and $124,000 in coming days, creating momentum for further increases.
Accelerating Momentum in Bitcoin Pricing
Swissblock, a private wealth management firm, stated that Bitcoin’s momentum remains robust, despite the slight pullback from its highest recorded values. Swissblock shared a graphic showcasing a “rare” situation with Bitcoin’s pricing maintaining upward motion without significant corrections.
“Momentum is igniting at resistance, not fading from it.”

However, Swissblock noted that a minor short-term correction is essential for establishing stronger momentum.
Onchain data service Glassnode has highlighted that Bitcoin’s Relative Strength Index (RSI) surged to 66 from 44 in a week, signifying a 50% increase in upward momentum, indicative of improved market confidence.
This is accompanied by rising spot demand with cumulative volume delta increasing from -$73.6 million to $68.7 million within the past week of trading.
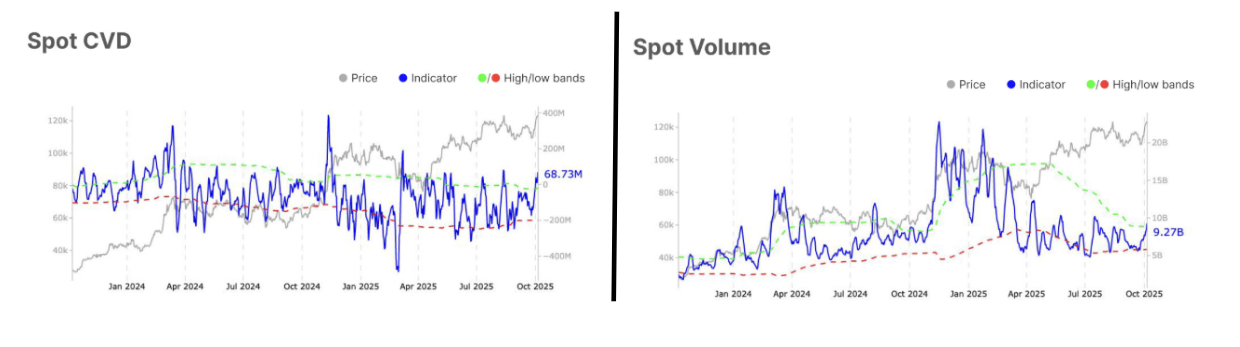 Bitcoin: Spot CVD and spot volume. Source: Glassnode
Glassnode emphasizes that maintaining high levels of trading activity will be crucial for continuing the upward trend.
Important Bitcoin Price Levels
Bitcoin’s short-term holders (STHs) are still active, according to analysis of their cost basis. While prices previously touched a heated range, they have not yet tipped into the overheated zone. An upward push towards the higher end could challenge historical highs at $133,460.
Another noteworthy resistance point is the over-heated band at $150,000. This indicates potential growth before any panic selling occurs.

On the downside, a significant support level exists at $113,300, representing the STH realized price and has historically been a key support area.
Note: This article does not provide investment advice. Always perform your own due diligence before making trading decisions.
