


Key Points:
- Ethereum could not surpass $4,800, resulting in a bearish shift and a 3% decline.
- Increased selling pressure was noted, though traders with leverage continued to engage actively.
- A recovery from the $4,400 mark might revitalize bullish interests towards new highs.
On Monday, while Bitcoin reached an unprecedented peak, Ether fell short at $4,800, leading to a notable 3% drop below $4,500 on Tuesday. This price decrease stemmed from a bearish divergence visible on the four-hour chart, typically signaling dwindling buyer strength and hinting at a potential local peak or reversal.
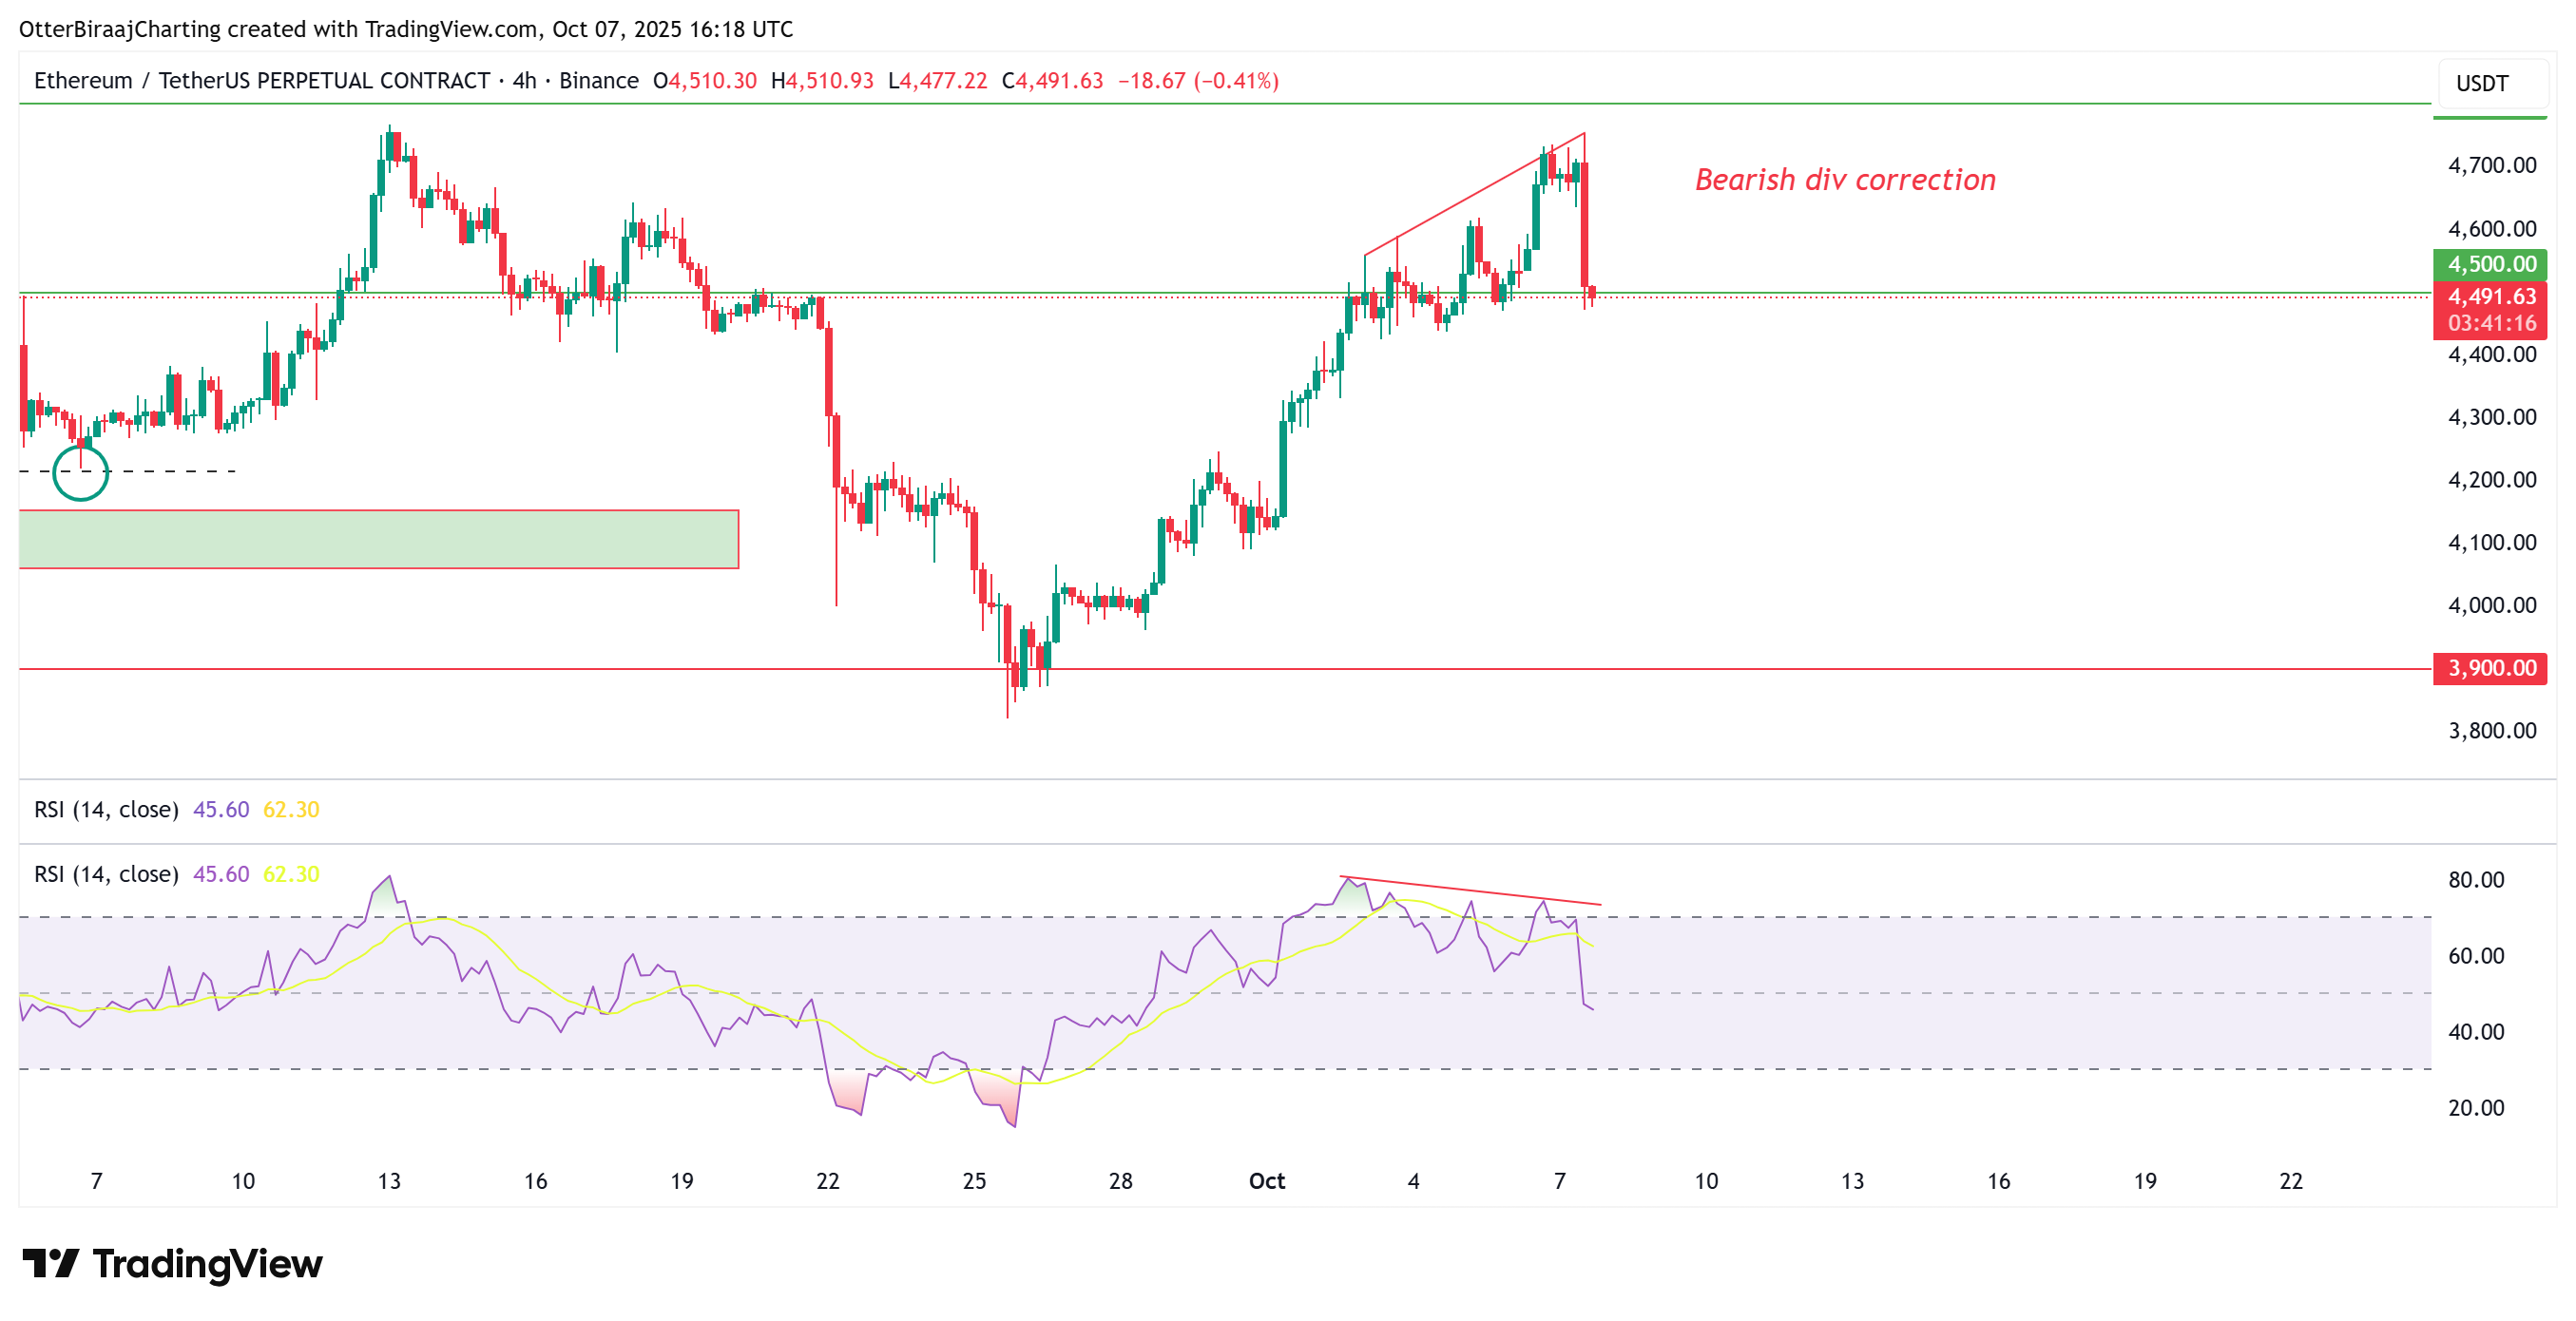 Ether bearish divergence dip analysis. Source: Cointelegraph/TradingView
Upon revisiting the $4,500 mark, analysis from on-chain and derivatives data revealed mixed signals. Despite a sharp drop in the spot cumulative volume delta (CVD), which reflects net selling pressure in the spot market, futures open interest and CVD remained robust, implying that leveraged traders are still positioning for market fluctuations while spot buyers are securing profits.
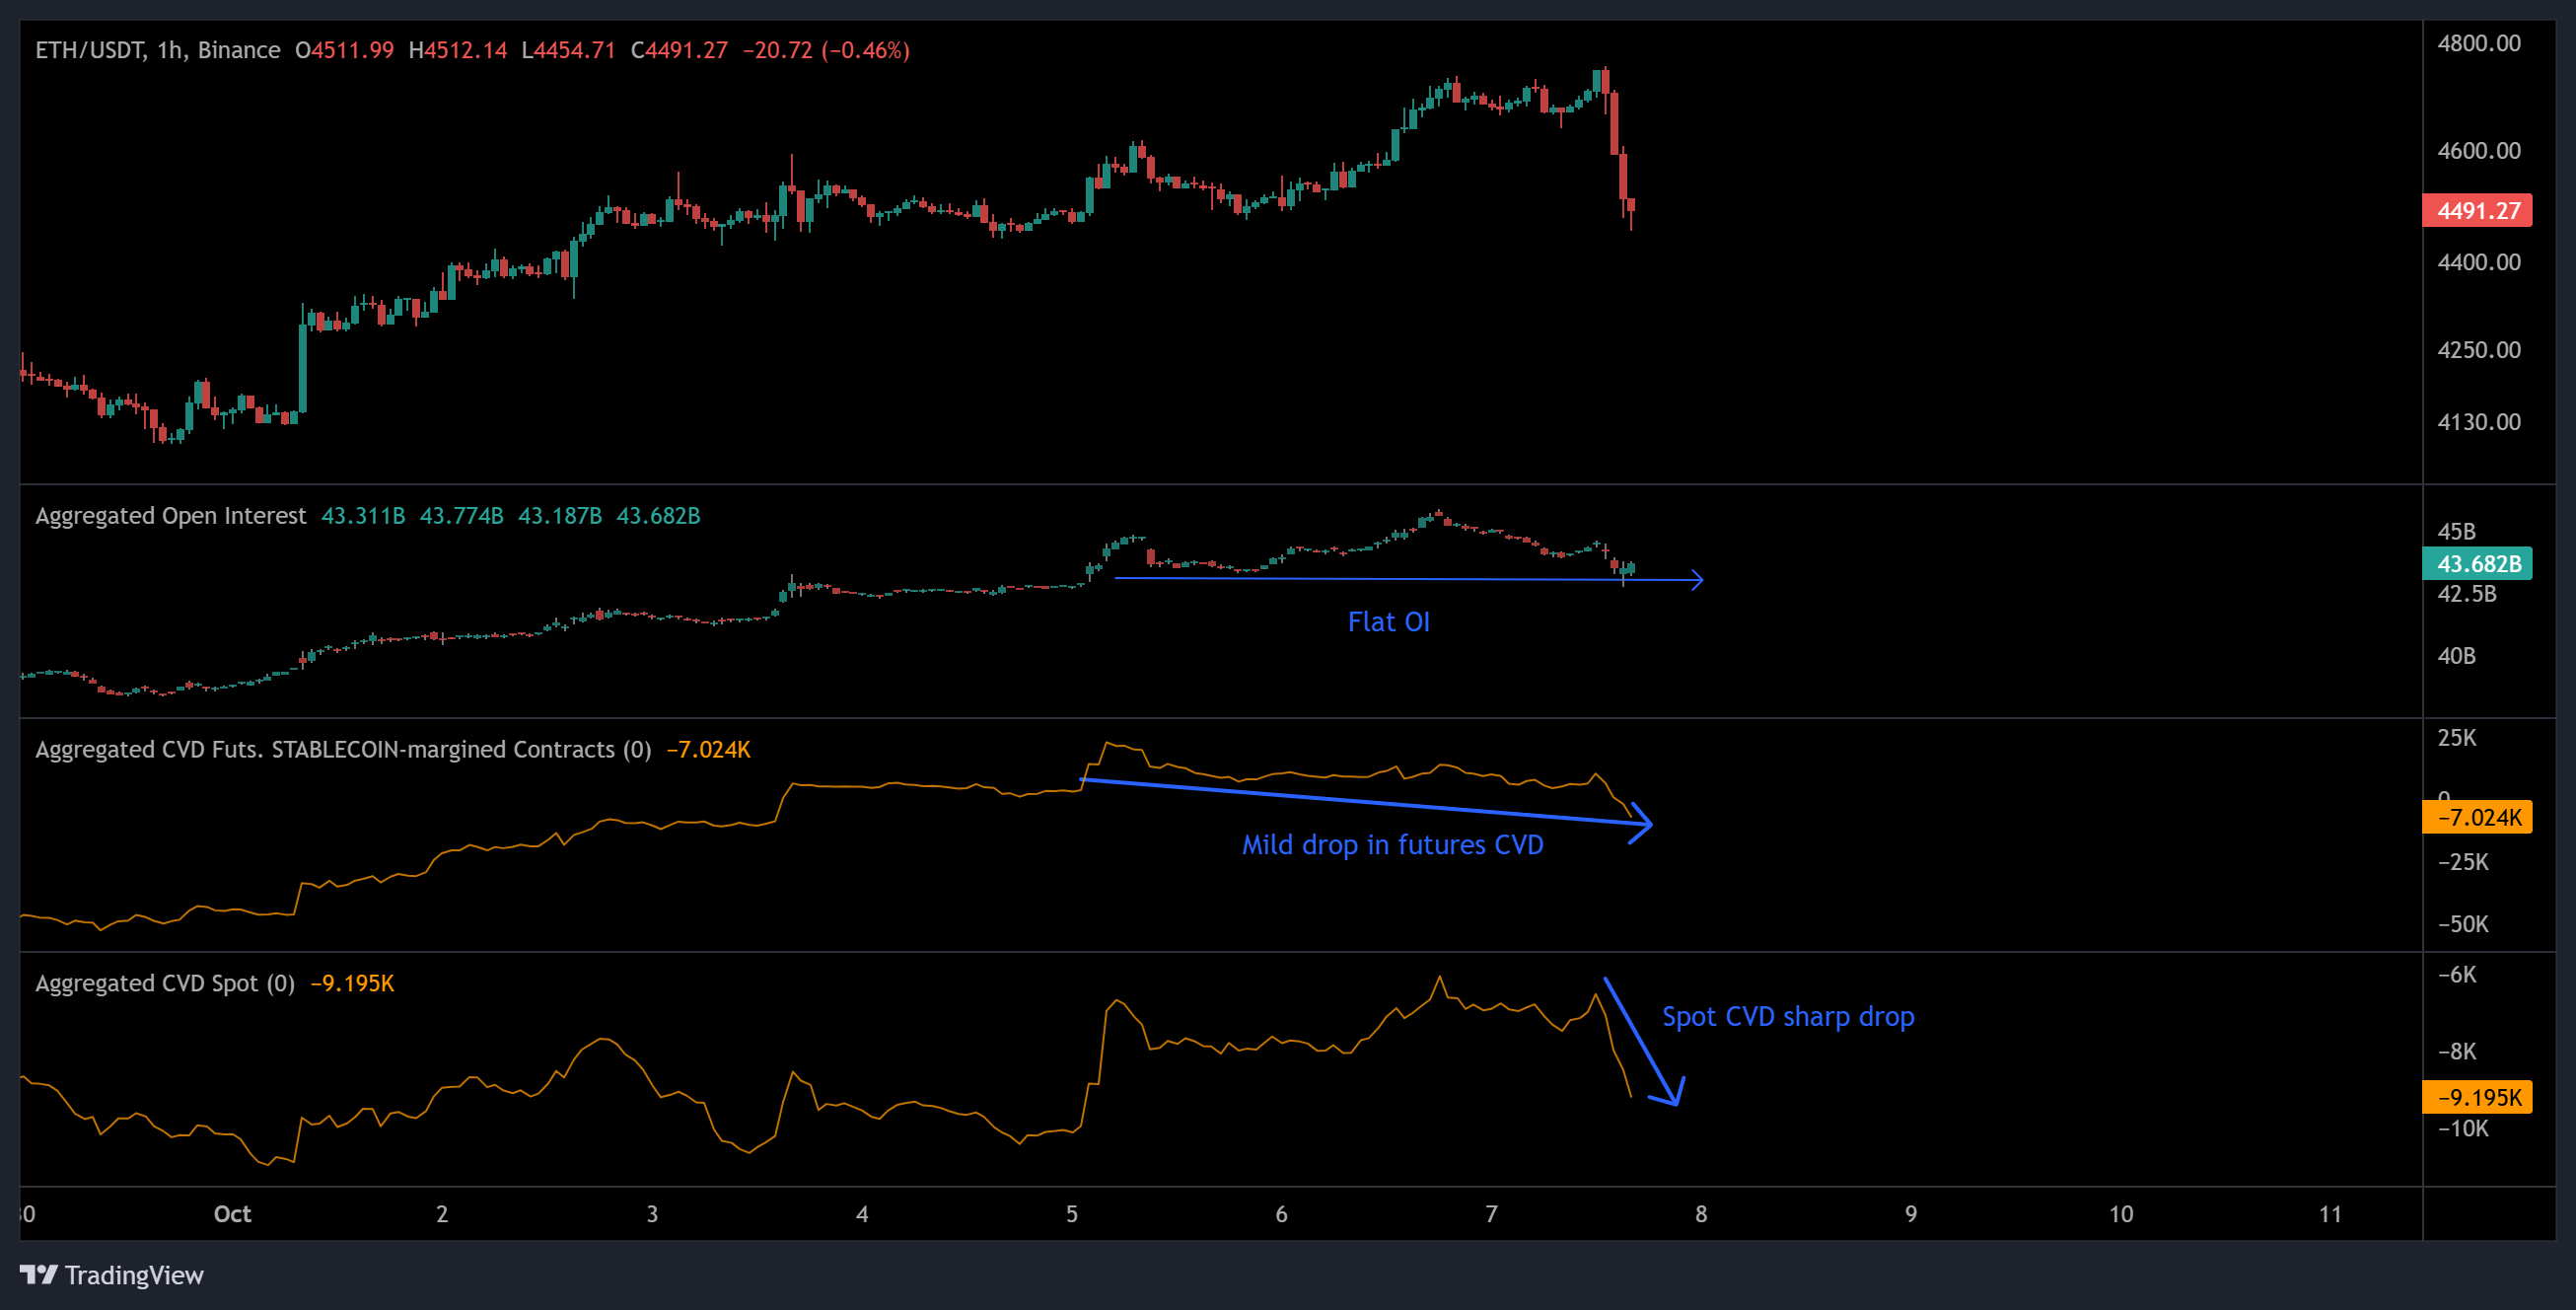 Ether price, aggregated open interest, aggregated futures and spot CVD. Source: Coinalyze
Such market conditions tend to attract cautious participants who are eyeing liquidity-driven opportunities over aggressive maneuvers. A liquidity sweep near $4,400, often populated by stop orders, could cause a brief reset. A vigorous bounce from this level would negate the bearish outlook and indicate a renewal of bullish momentum in the week ahead.
If Ethereum fails to uphold this area, the correction could deepen towards $4,250 to $4,100, where both four-hour and one-day order blocks converge. These intersections often denote high-demand areas with significant buy-side orders, making them critical for potential trend reversals.
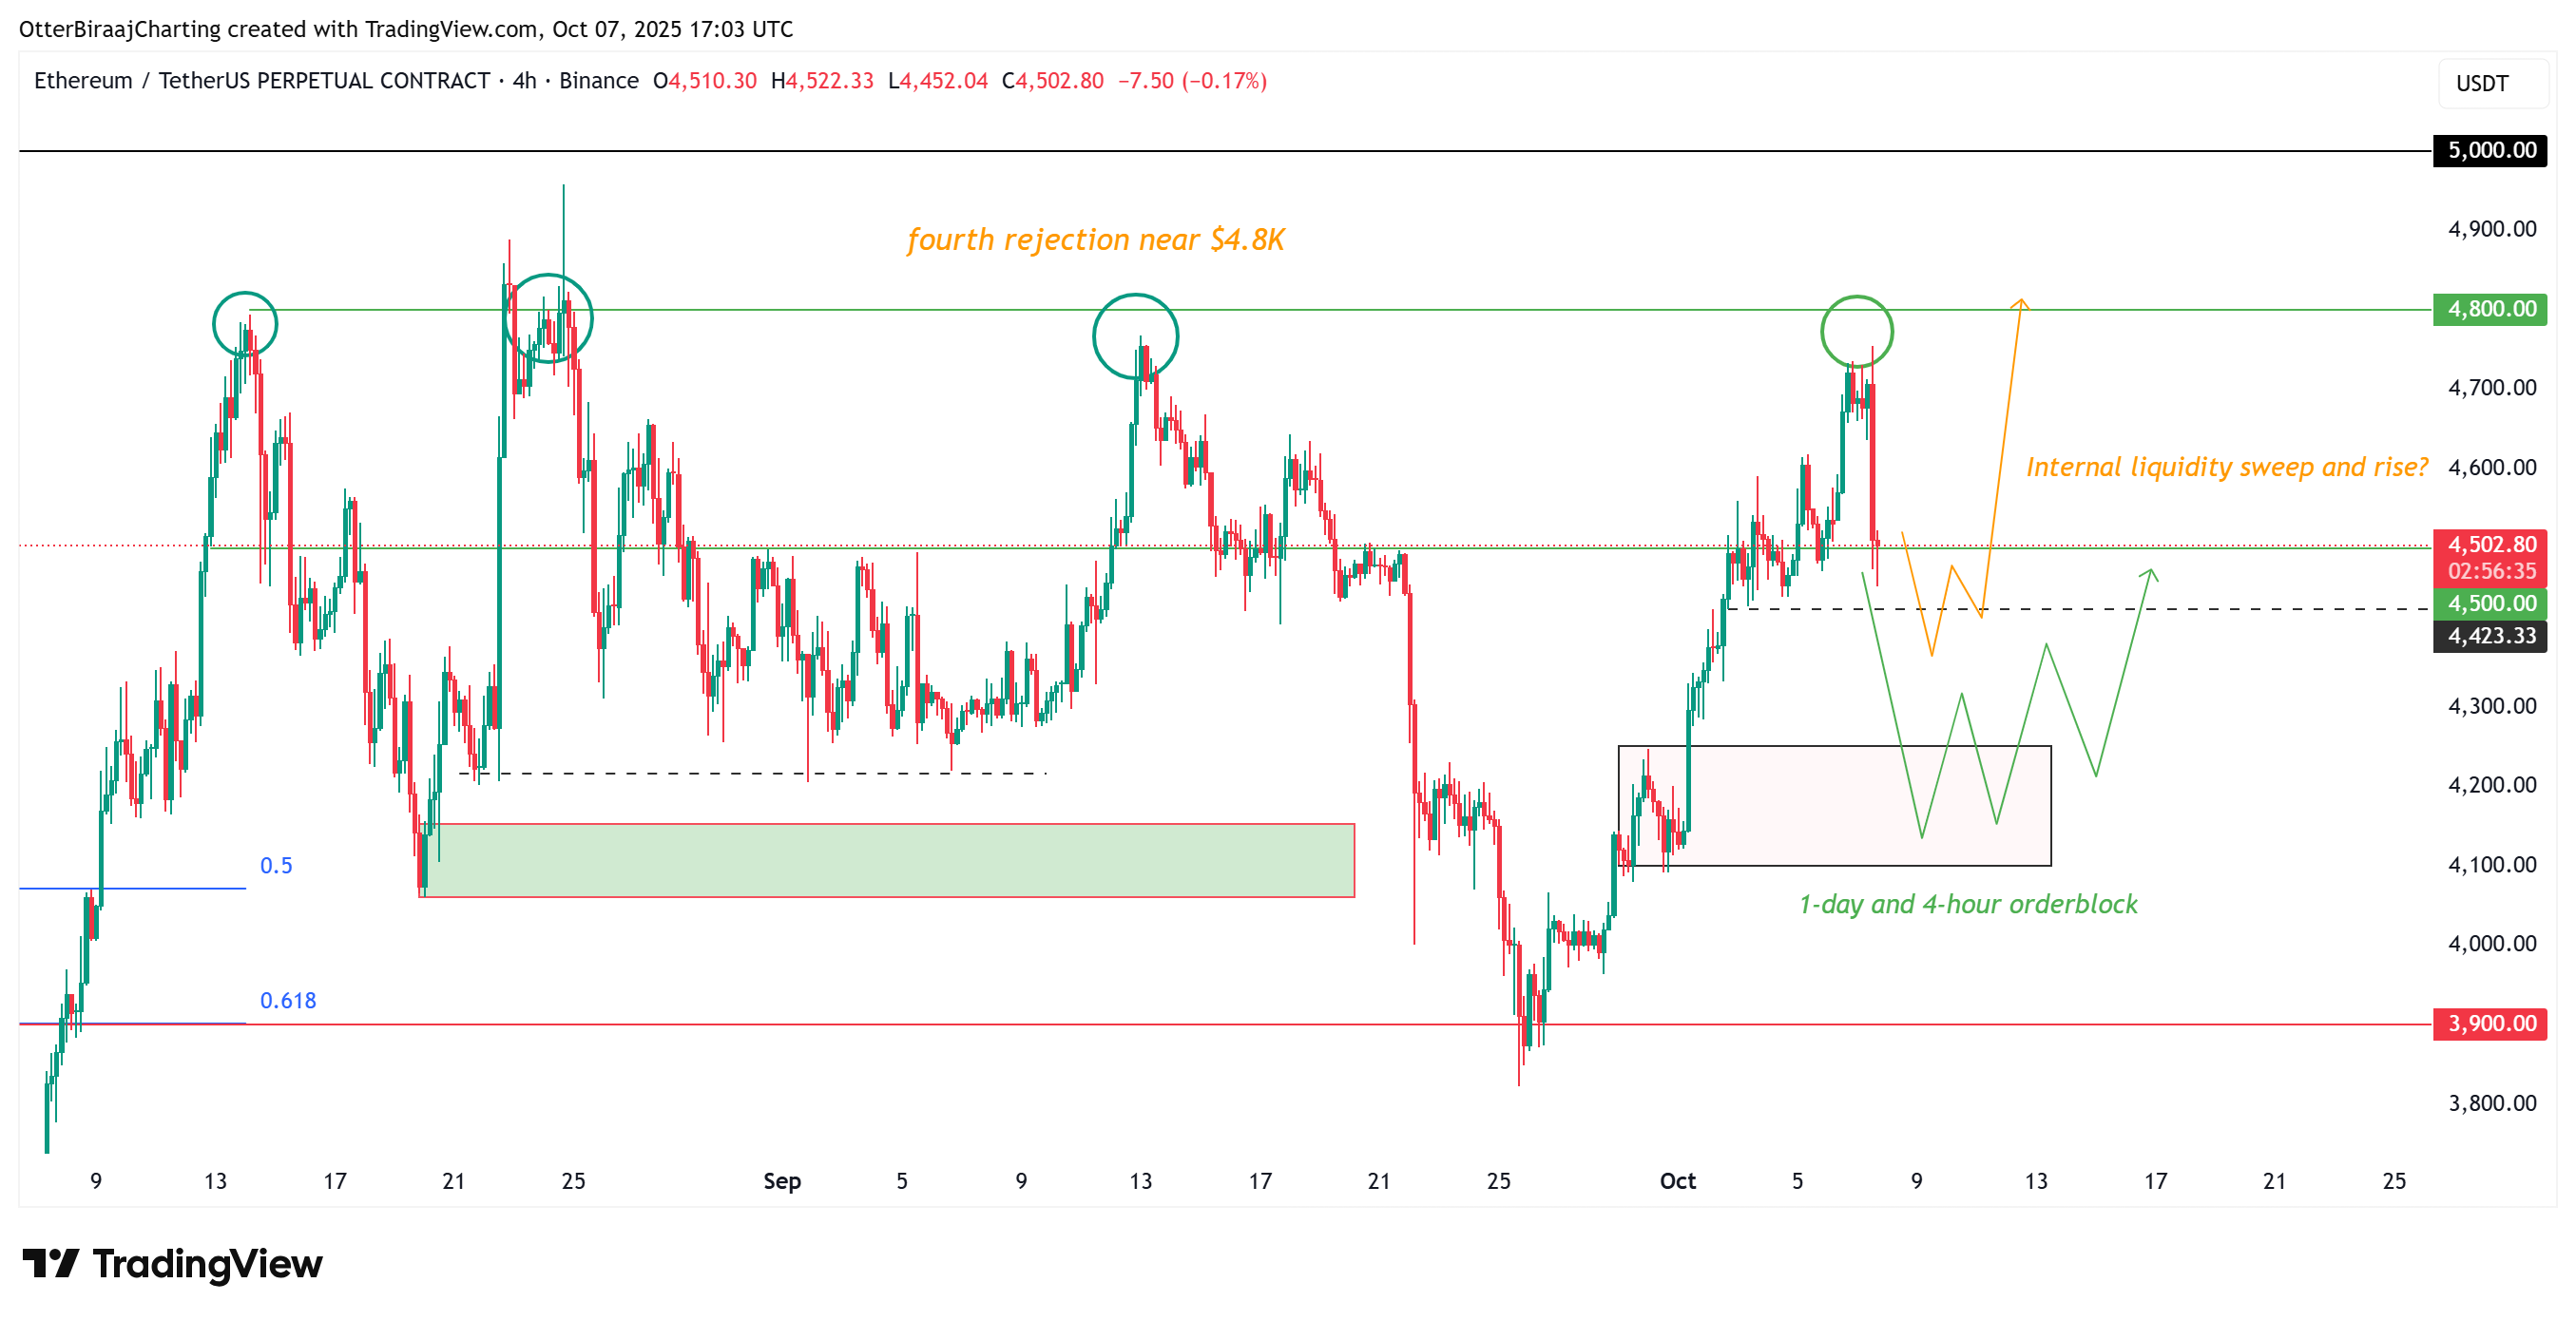 Ether four-hour chart. Source: Cointelegraph/TradingView
This article does not constitute financial advice or recommendations. All investments involve risks, and readers should perform their own due diligence before making decisions.
