
Market Trends Overview for October 8: Key Predictions for Major Cryptocurrencies
A detailed analysis of the recent price movements and predictions for Bitcoin, Ethereum, and other leading cryptocurrencies as market dynamics shift.


Bitcoin’s temporary retreat from its peak hasn’t diminished the optimistic long-term outlook, though bulls must act quickly to push prices above $126,200 to maintain their advantage.
- Key Points:
- After a price drop on Tuesday, Bitcoin showed resilience as the pullback was shallow, keeping expectations of an uptrend alive.
- Various altcoins rebounded from their support levels, reflecting buying activity at lower price points.
On Tuesday, Bitcoin (BTC) sharply declined but remained above $120,000, indicating strong demand. The price climbed above $123,000, with the next target at $124,474.
Analysts express optimism towards BTC in October, historically the second-best month for performance since 2013, with gains averaging 20.75%, as per CoinGlass data. Economist Timothy Peterson suggested a 50% likelihood of BTC surpassing $140,000 this month.
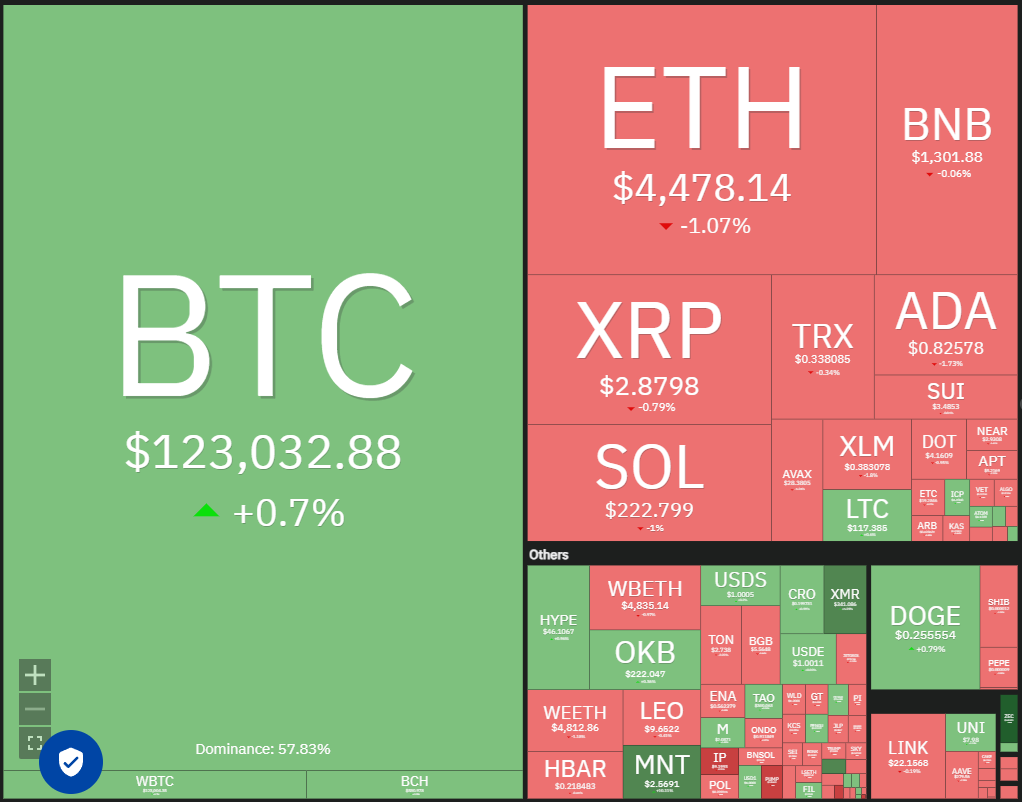 Crypto market data daily view. Source: Coin360
While the overall trend is positive, caution is warranted. A failure to maintain above $126,000 could prompt further selling, potentially breaching the support at $120,000. Analysts predict support levels between $118,000 and $114,000 if that occurs.
Can BTC initiate the next uptrend, pulling altcoins up with it? Let’s explore the predictions for the top ten cryptocurrencies to find out.
Bitcoin Price Prediction
BTC reached a new high of $126,199 but could not maintain those levels. The BTC/USDT fell below the breakout point of $124,474 on Tuesday, revealing an upward trend in the 20-day EMA and a positive RSI suggests bulls still hold an edge.
Buyers will attempt to reignite the uptrend by pushing the price over $126,199, which could lead to a potential rise to $138,154.
Conversely, if the downward trend continues past the 20-day EMA, it may indicate market rejection above $124,474, possibly leading to a drop to the 50-day SMA ($114,276).
Ethereum Price Prediction
Ethereum (ETH) slipped back below the resistance level after briefly closing above it on Monday.
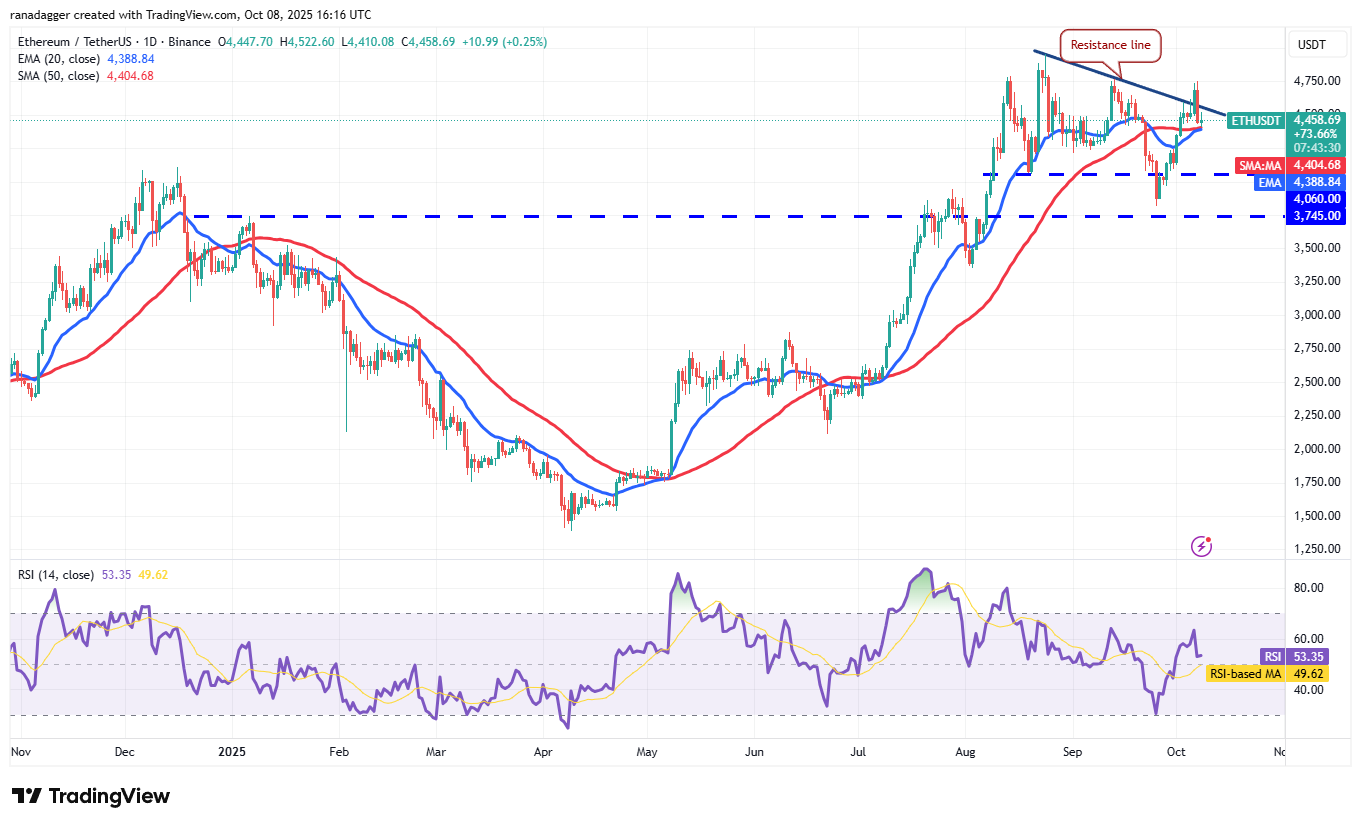 ETH/USDT daily chart. Source: Cointelegraph/TradingView
The ETH/USDT pair is holding at the moving averages, suggesting bulls are trying to maintain control. Buyers will make another attempt to challenge the previous high at $4,957.
If prices drop below the moving averages, it may indicate that bears are gaining control, potentially pulling the ETH price down to $4,060.
BNB Price Prediction
BNB has been on a strong uptrend, indicative of steady buying from bulls.
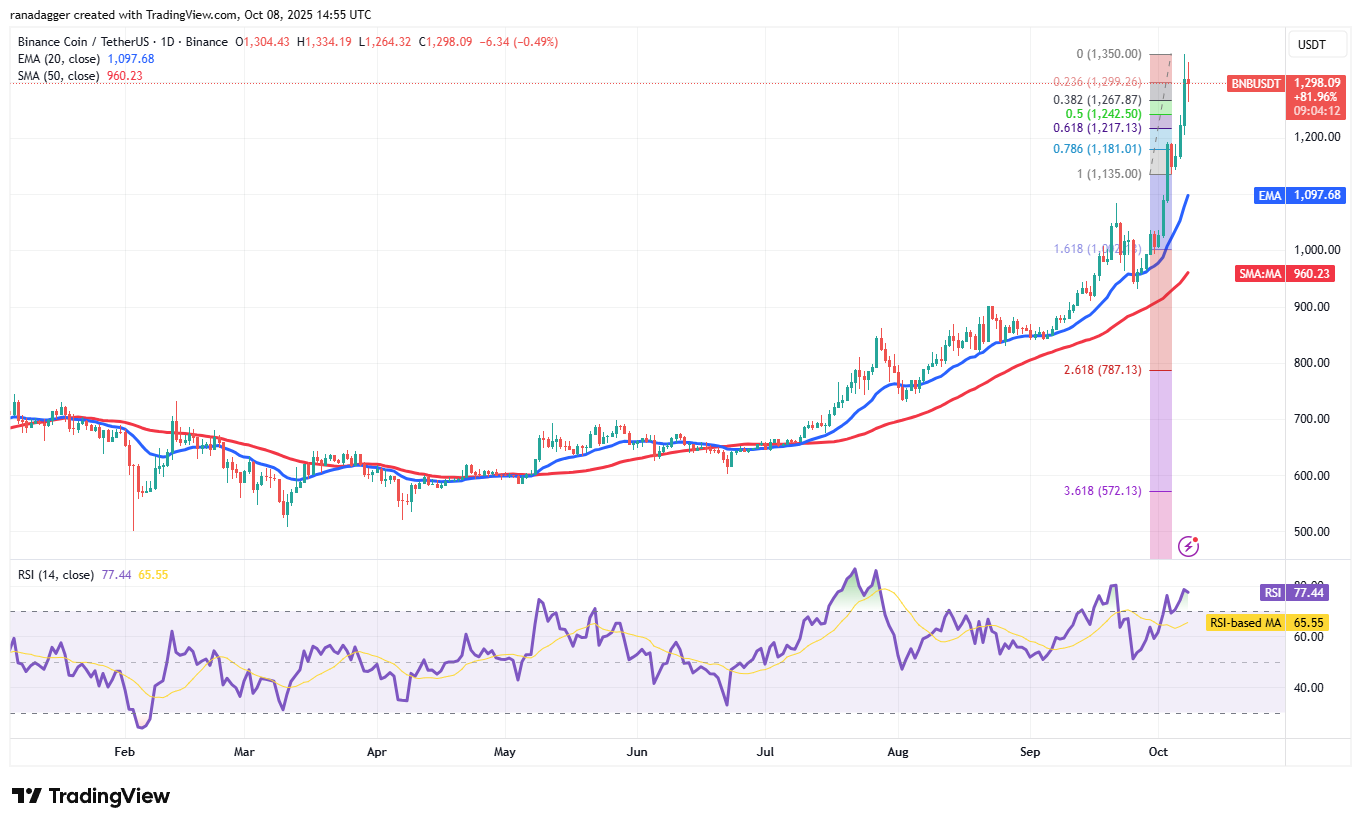 BNB/USDT daily chart. Source: Cointelegraph/TradingView
Bears are attempting to halt this rise at $1,350, although the small pullback hints that bulls remain steadfast in anticipating a continued rally. If buyers push the price above $1,350, BNB could soar to $1,394 and subsequently to $1,479.
XRP Price Prediction
XRP has struggled to remain above the downtrend line as bears defend this level aggressively.
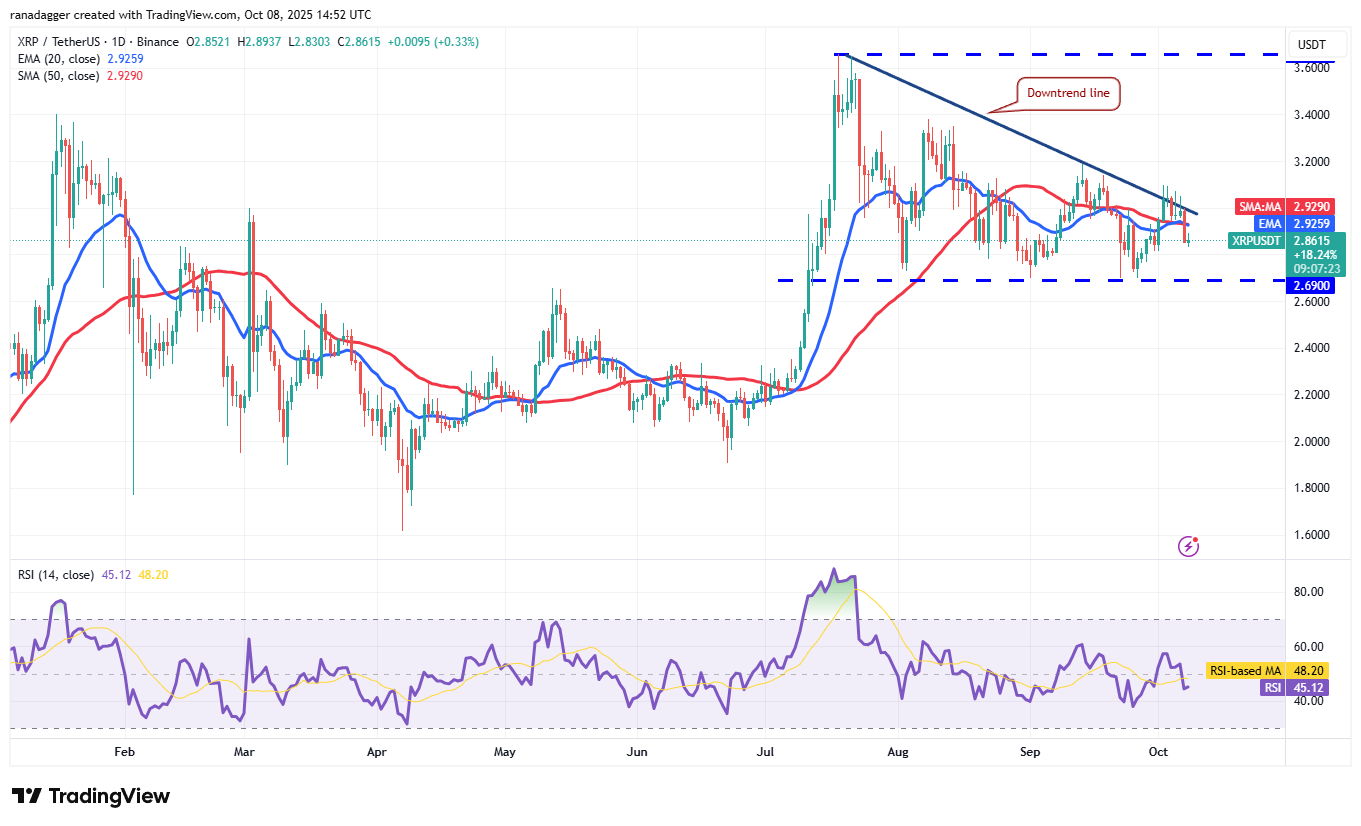 XRP/USDT daily chart. Source: Cointelegraph/TradingView
A downturn in the XRP price signals it may remain within a bearish descending triangle pattern. Sellers aim to push prices below support at $2.69; a successful breach could send it down to $2.33.
Solana Price Prediction
Solana (SOL) has been advancing steadily within an ascending channel.
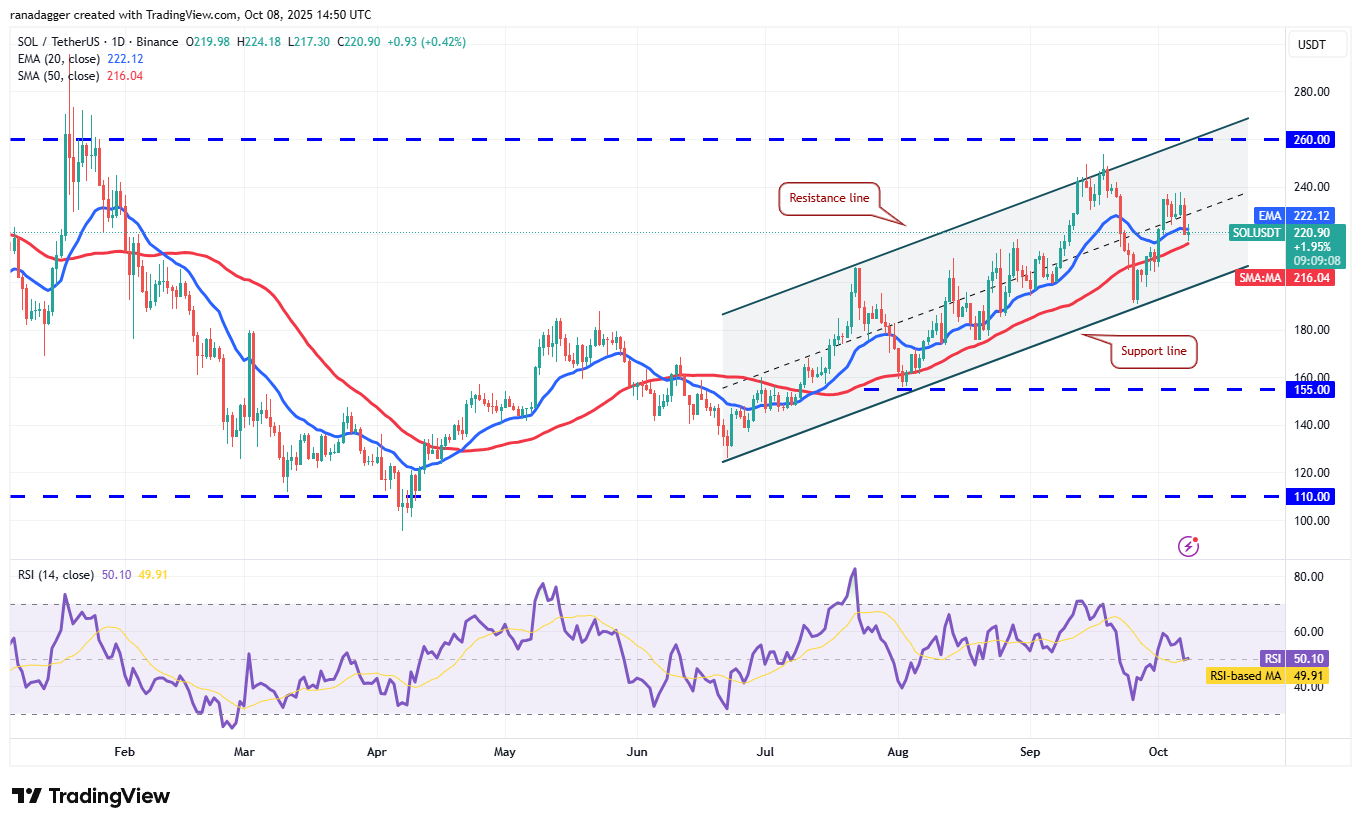 SOL/USDT daily chart. Source: Cointelegraph/TradingView
If it breaks below the 50-day SMA, the SOL price may head toward the support line. Buyers are likely to defend this support, as breaching it could result in a decline to $191.
Dogecoin Price Prediction
Dogecoin (DOGE) dipped from $0.27 but is currently testing support at the 50-day SMA ($0.24).
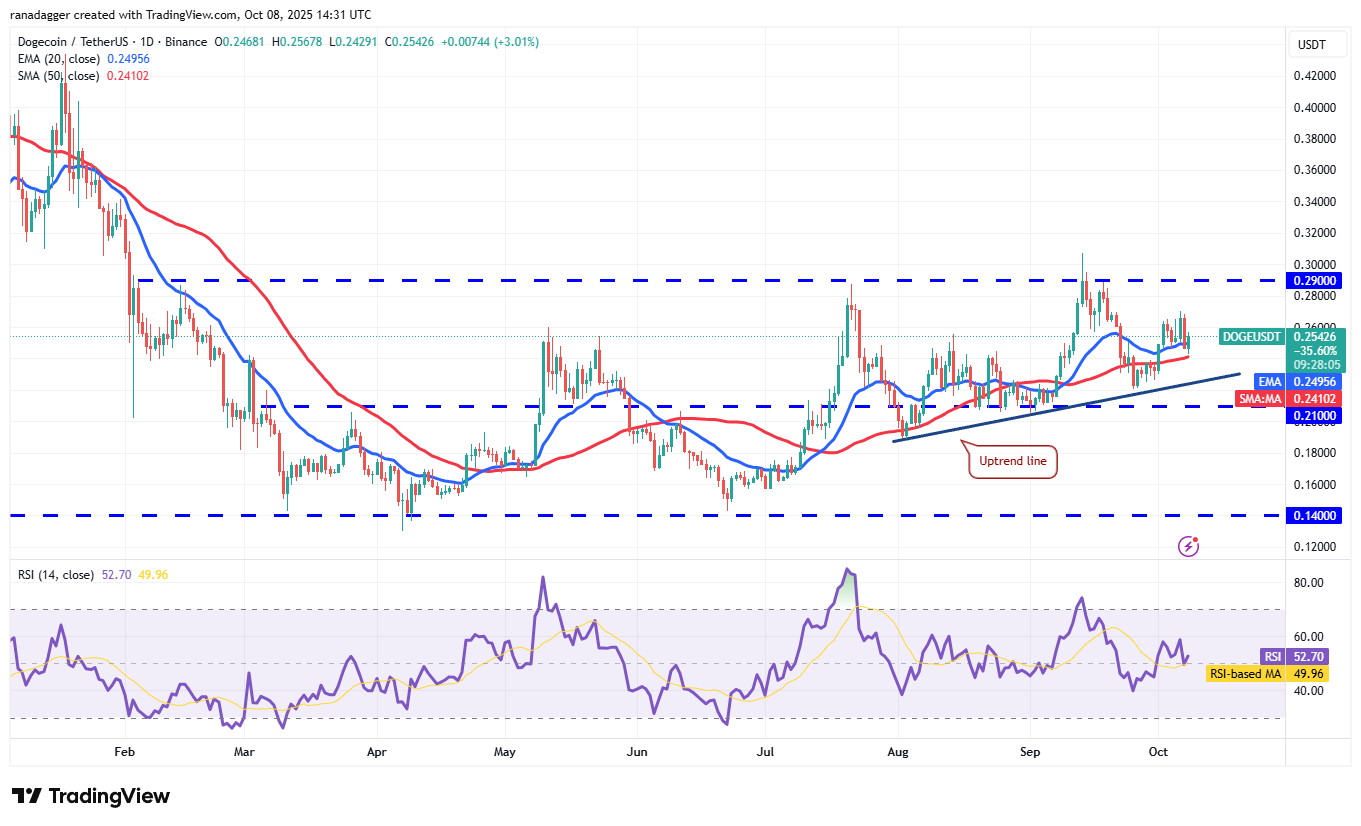 DOGE/USDT daily chart. Source: Cointelegraph/TradingView
The bulls aim to push Dogecoin above $0.27 into resistance at $0.29. A successful breakout could spark a new uptrend towards $0.39.
Cardano Price Prediction
Cardano closed above the 50-day SMA, but was unable to hold.
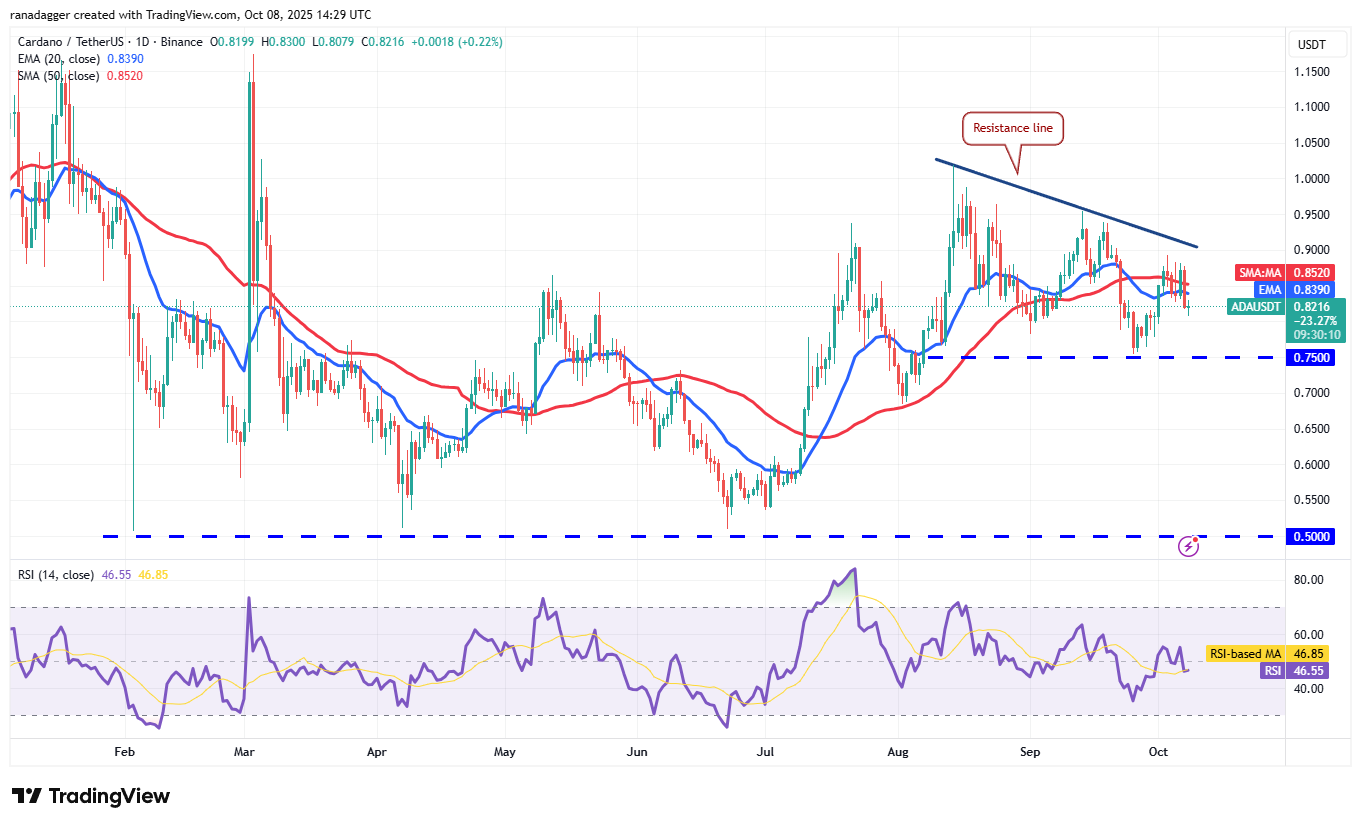 ADA/USDT daily chart. Source: Cointelegraph/TradingView
If a dip below $0.75 occurs, significant selling may ensue, potentially bringing the price down to $0.68.
Hyperliquid Price Prediction
Hyperliquid (HYPE) faced resistance at a key Fibonacci level, indicating sellers are active on rallies.
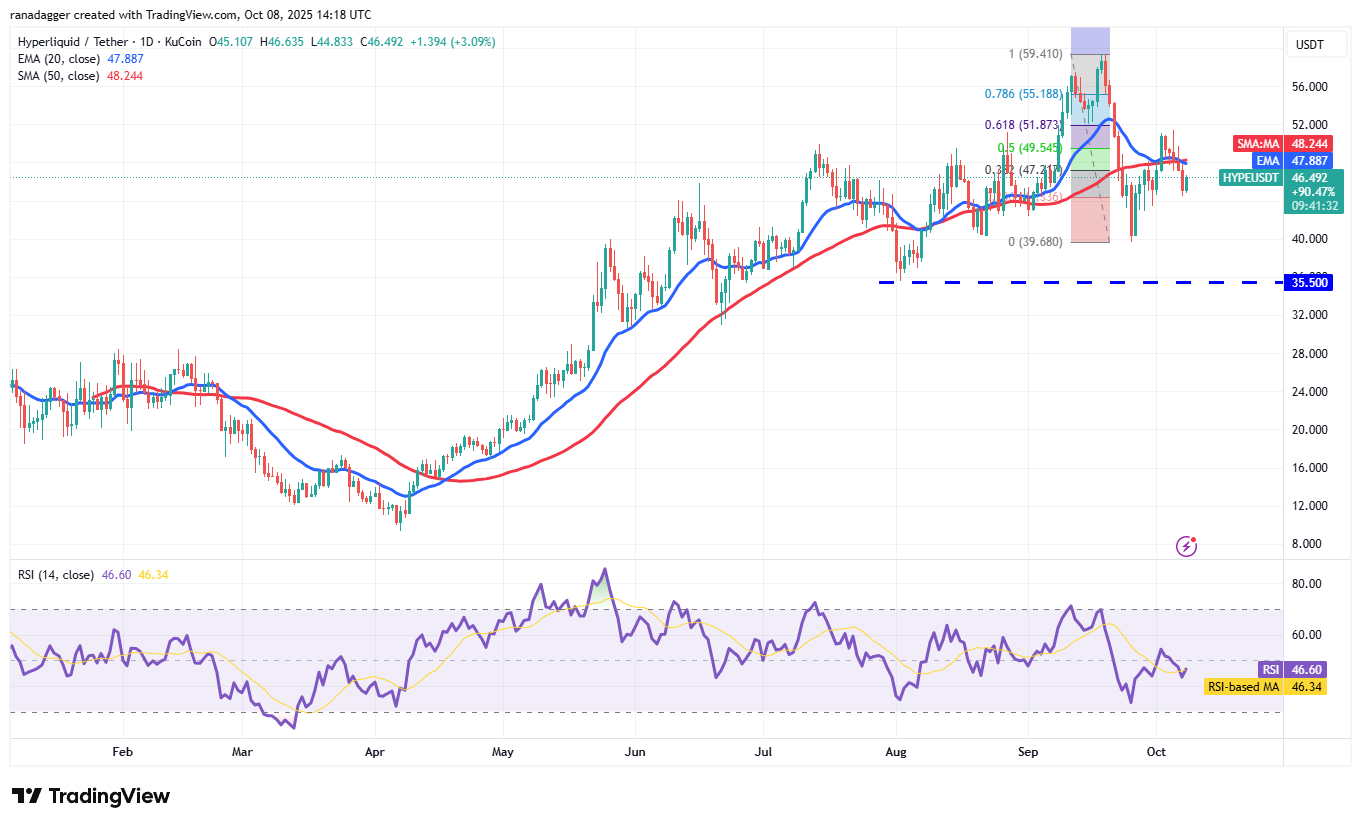 HYPE/USDT daily chart. Source: Cointelegraph/TradingView
If price moves downward, the next support is at $43, but a sharp recovery may signal strong demand.
Chainlink Price Prediction
Chainlink (LINK) fell back from resistance and below the 20-day EMA.
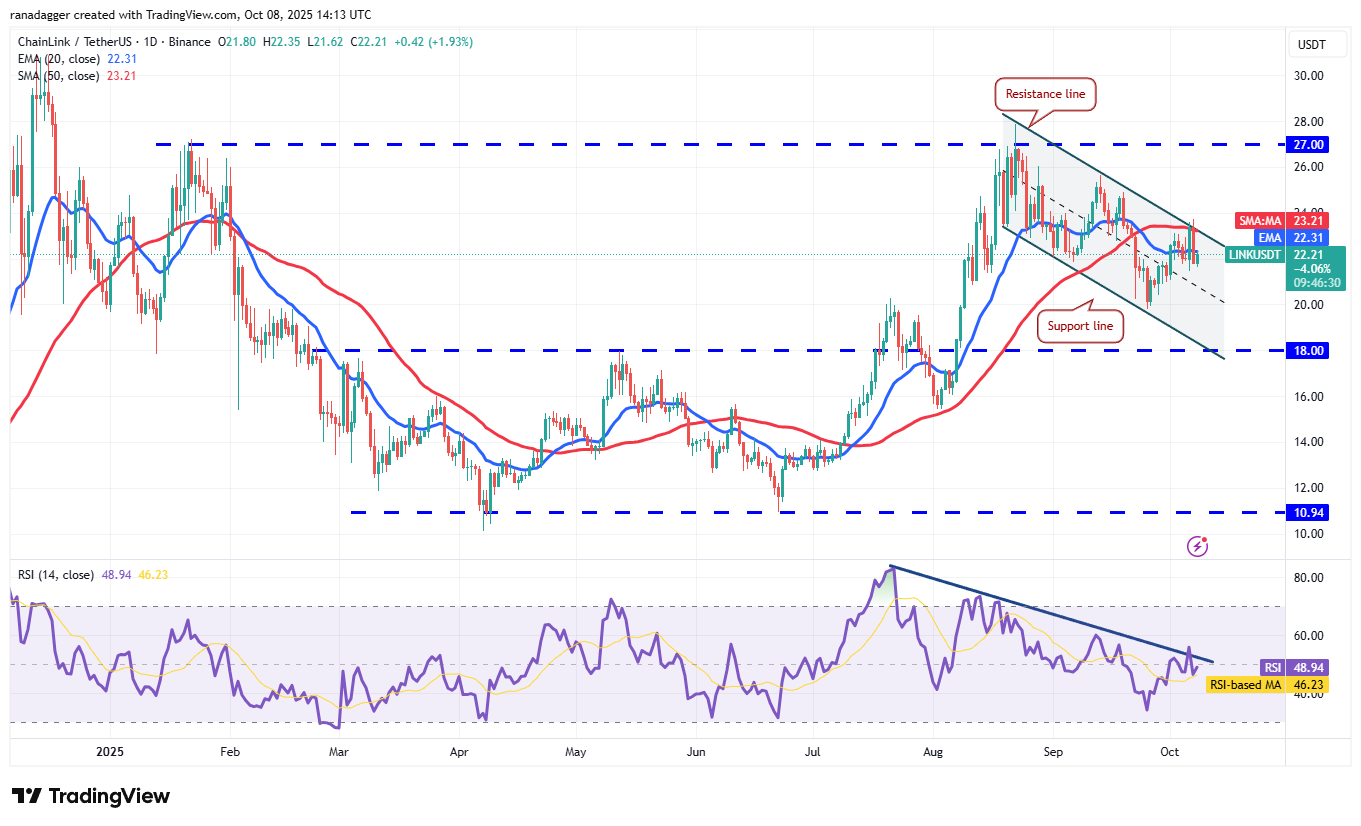 LINK/USDT daily chart. Source: Cointelegraph/TradingView
If bulls break the resistance, it could signal the end of the corrective phase and lead to upward movement.
Sui Price Prediction
Sui failed to reach its downward trend, indicating selling pressure from bears.
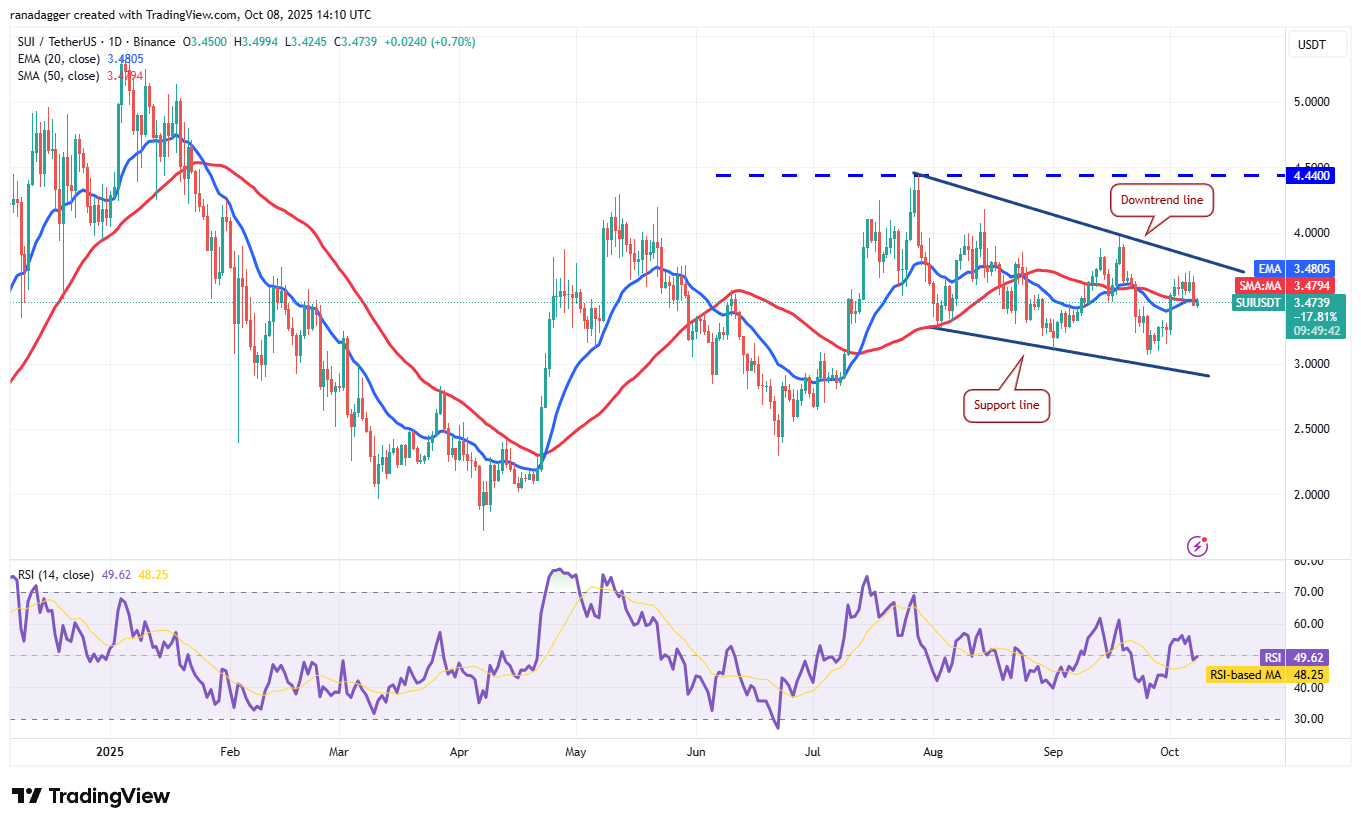 SUI/USDT daily chart. Source: Cointelegraph/TradingView
A drop below the moving averages could bring support into play; however, a rally may signal a return for buyers.
