


Key Points:
- Bitcoin is at risk of hitting new lows this October as bearish sellers regain momentum.
- Price targets include potential dips to around $108,000 amid negative divergences.
- A notable weakness is reflected as daily losses inch towards 3%.
Bitcoin (BTC) approached its weekly low after the market opened on Thursday, with sellers overpowering bullish trends.
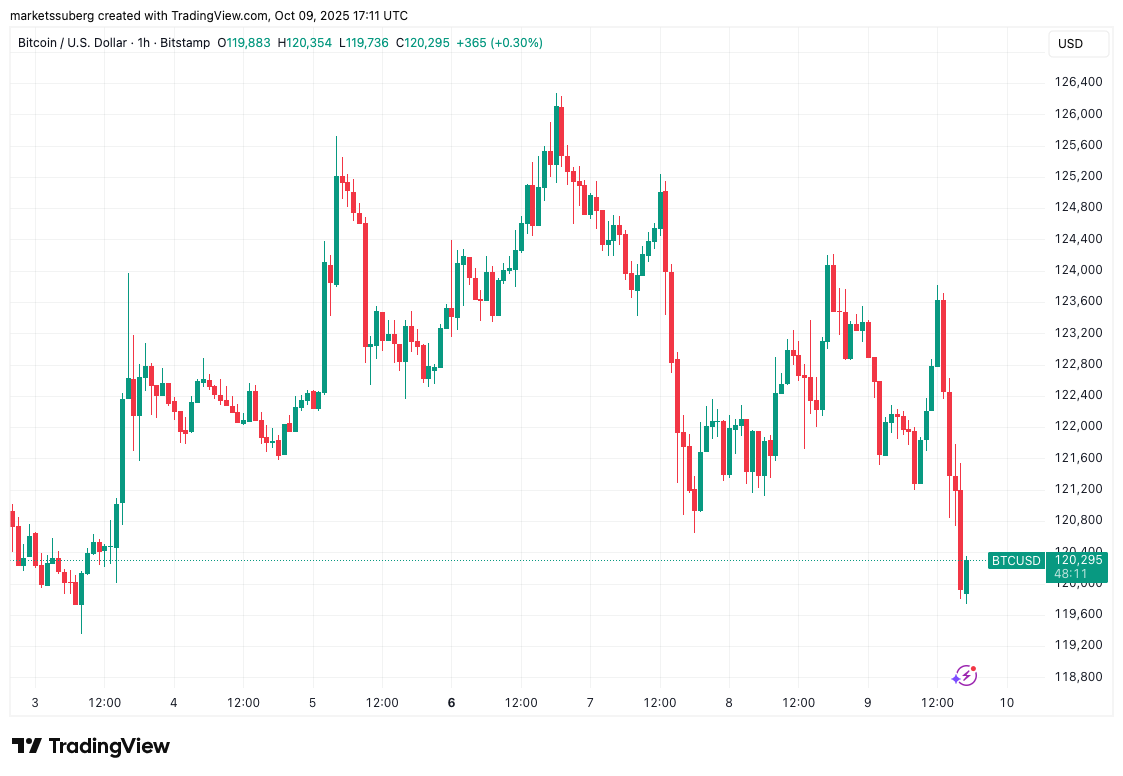 BTC/USD one-hour chart. Source: Cointelegraph/TradingView
Perspective on Bitcoin’s Short-Term Movements
Data from Cointelegraph Markets Pro and TradingView indicates that BTC/USD has fallen below $120,000, down nearly 3% on the day, as sell orders dominate market dynamics. Trader Skew commented:
“The market still shows bid liquidity around $121K-$120K; however, we need to see stronger absorption of sellers to prevent a sharper drop.”
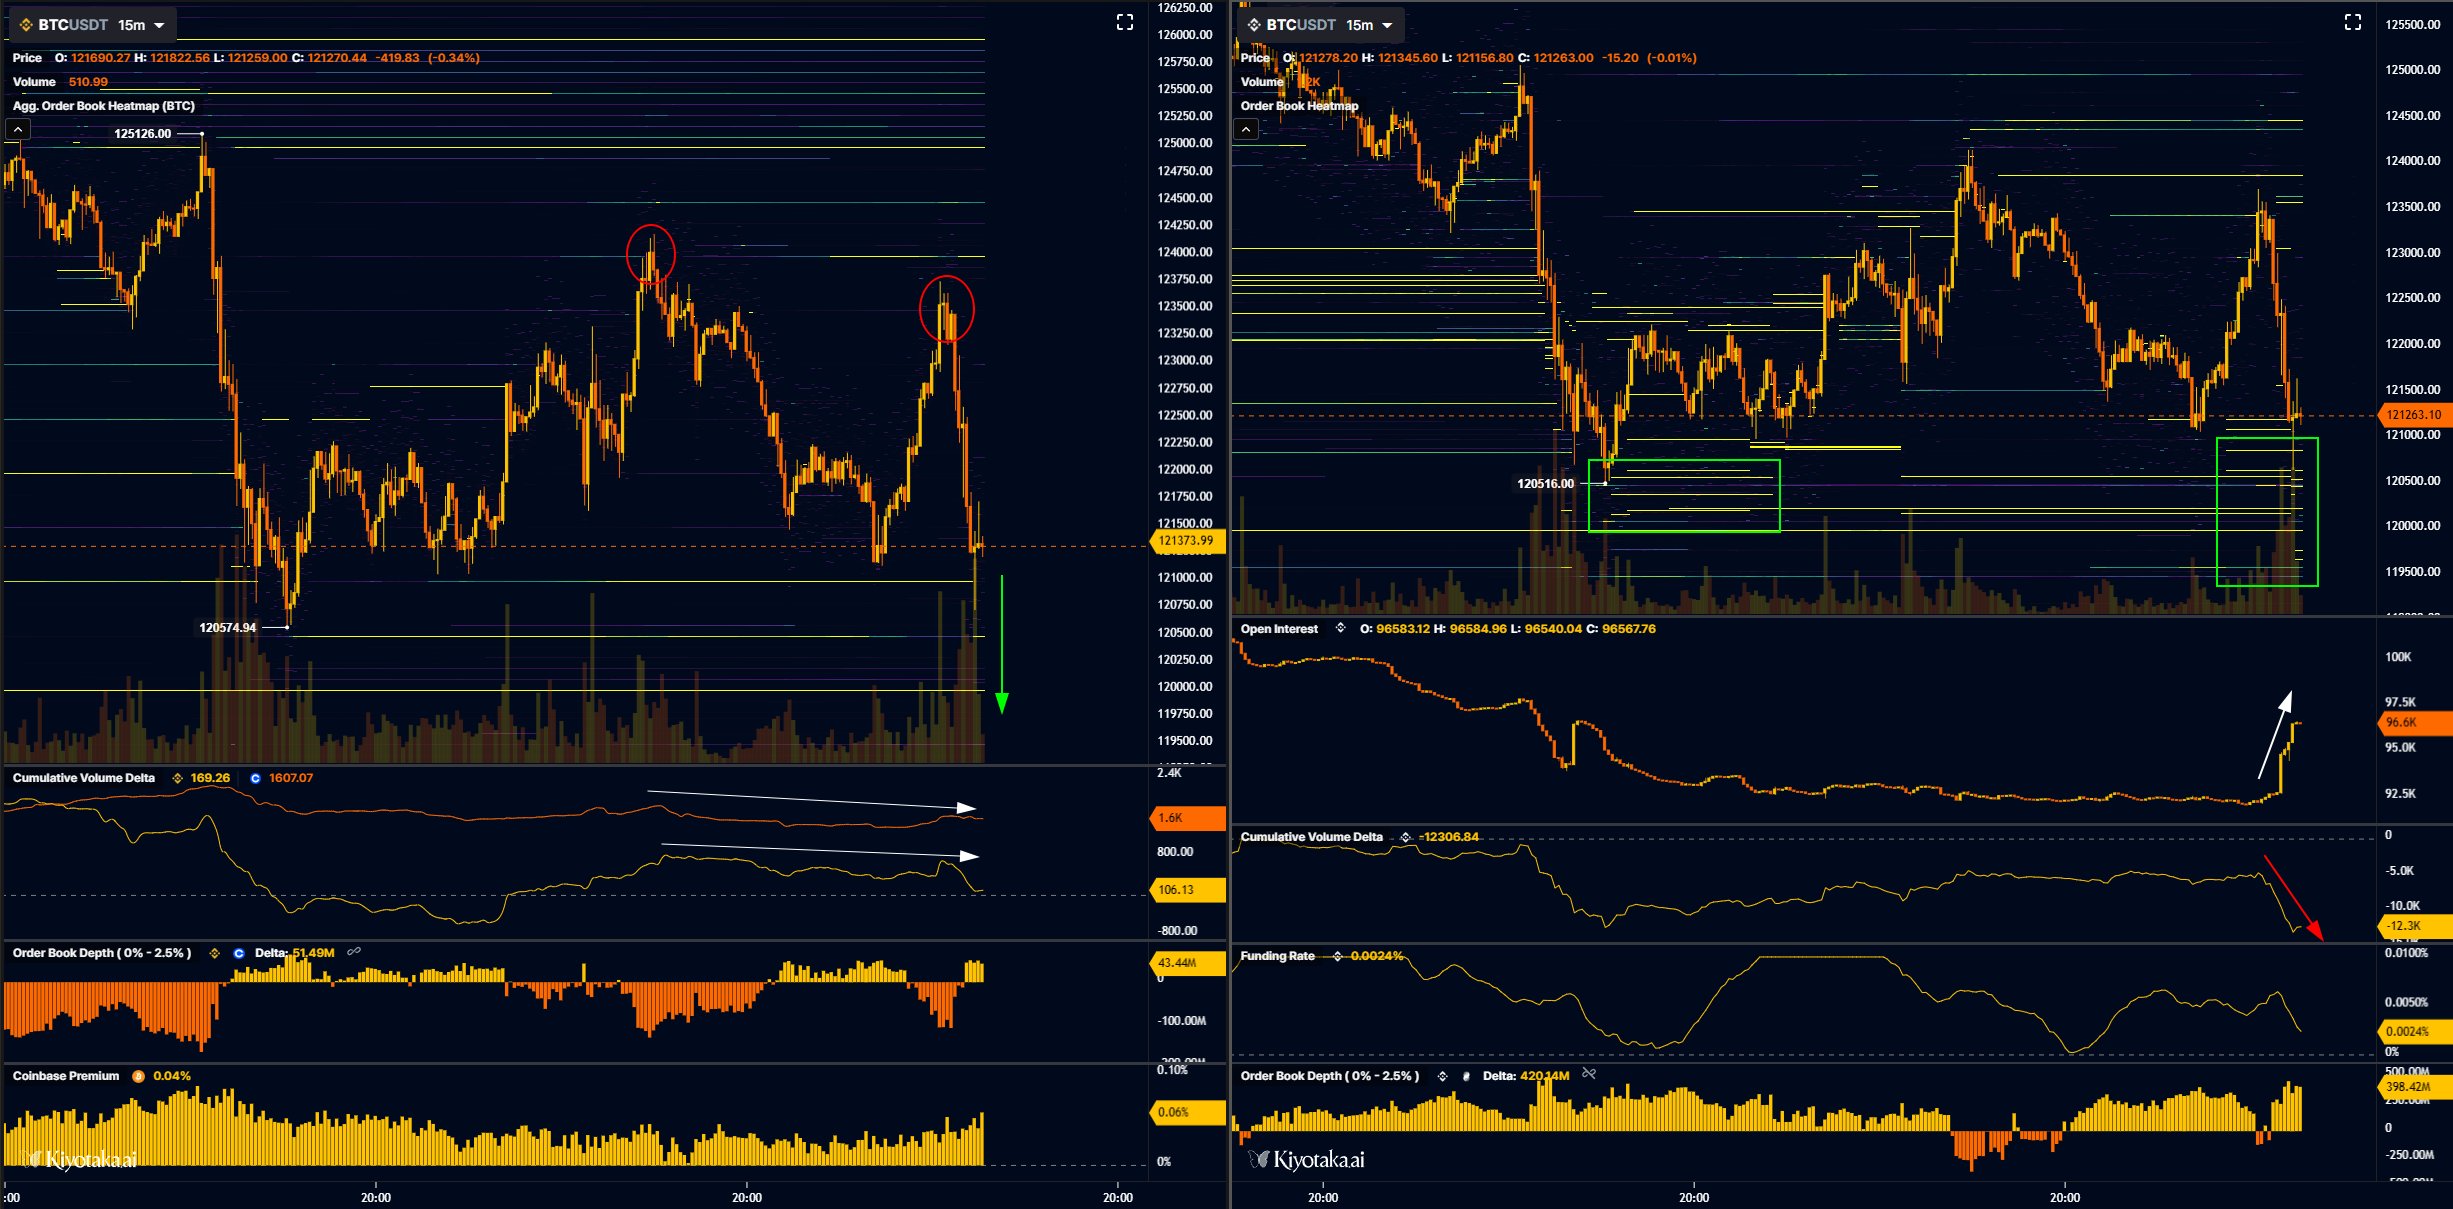 BTC/USDT chart with exchange data. Source: Skew/X
Material Indicators used proprietary tools to underscore continuous testing of nearby support levels. They state:
“We’re now facing a third consecutive test of daily support at the trend line.”
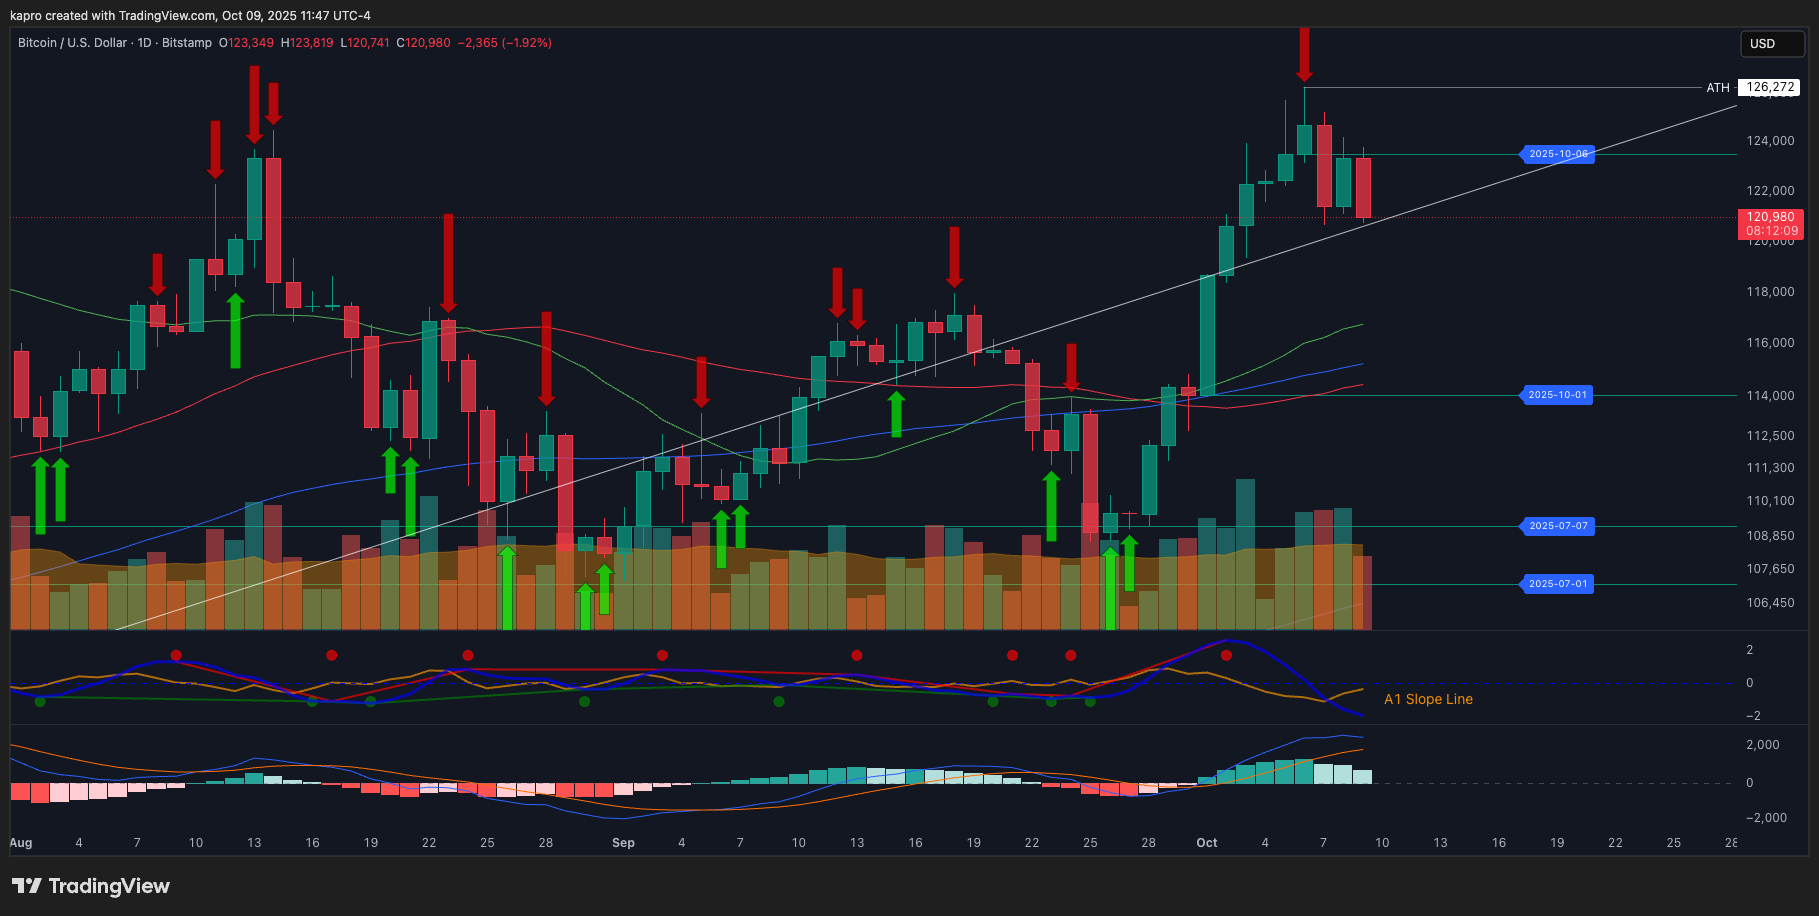 BTC/USD one-day chart. Source: Material Indicators/X
Additionally, data from CoinGlass reveals a striking absence of bid support significantly below the $120,000 threshold at the time of this writing.
 BTC liquidation heatmap. Source: CoinGlass
Reassessing BTC’s Value at $108,000
Traders have recently voiced concerns about Bitcoin’s fragile positioning, despite its former peaks. Roman reflected on the recurring bearish trends and diminishing volume coupled with weak momentum across longer timescales:
“We’re noticing again the emergence of bearish divergences, low volume, and frail momentum across high time frames, namely 1W and 1M.”

Roman anticipates the local range lows at $108,000 might come back into the narrative for October.
