


Analyzing Bitcoin: What To Expect Following the Recent Price Drop
Bitcoin’s recent decline offers a milder contrast to prior notable downturns, signaling the possibility for upward movement.
Key Points:
- The overall uptrend of Bitcoin is bolstered by on-chain metrics indicating market expansion.
- Significant purchasing by larger holders, termed ‘sharks,’ alongside critical trendline support, signals a potential rebound for Bitcoin.
The price of Bitcoin (BTC) sought recovery after experiencing a dramatic drop resulting in over $5.39 billion in leveraged position liquidations within 24 hours, marking the largest one-day drop on record, overshadowing the COVID-19 crash of 2020.
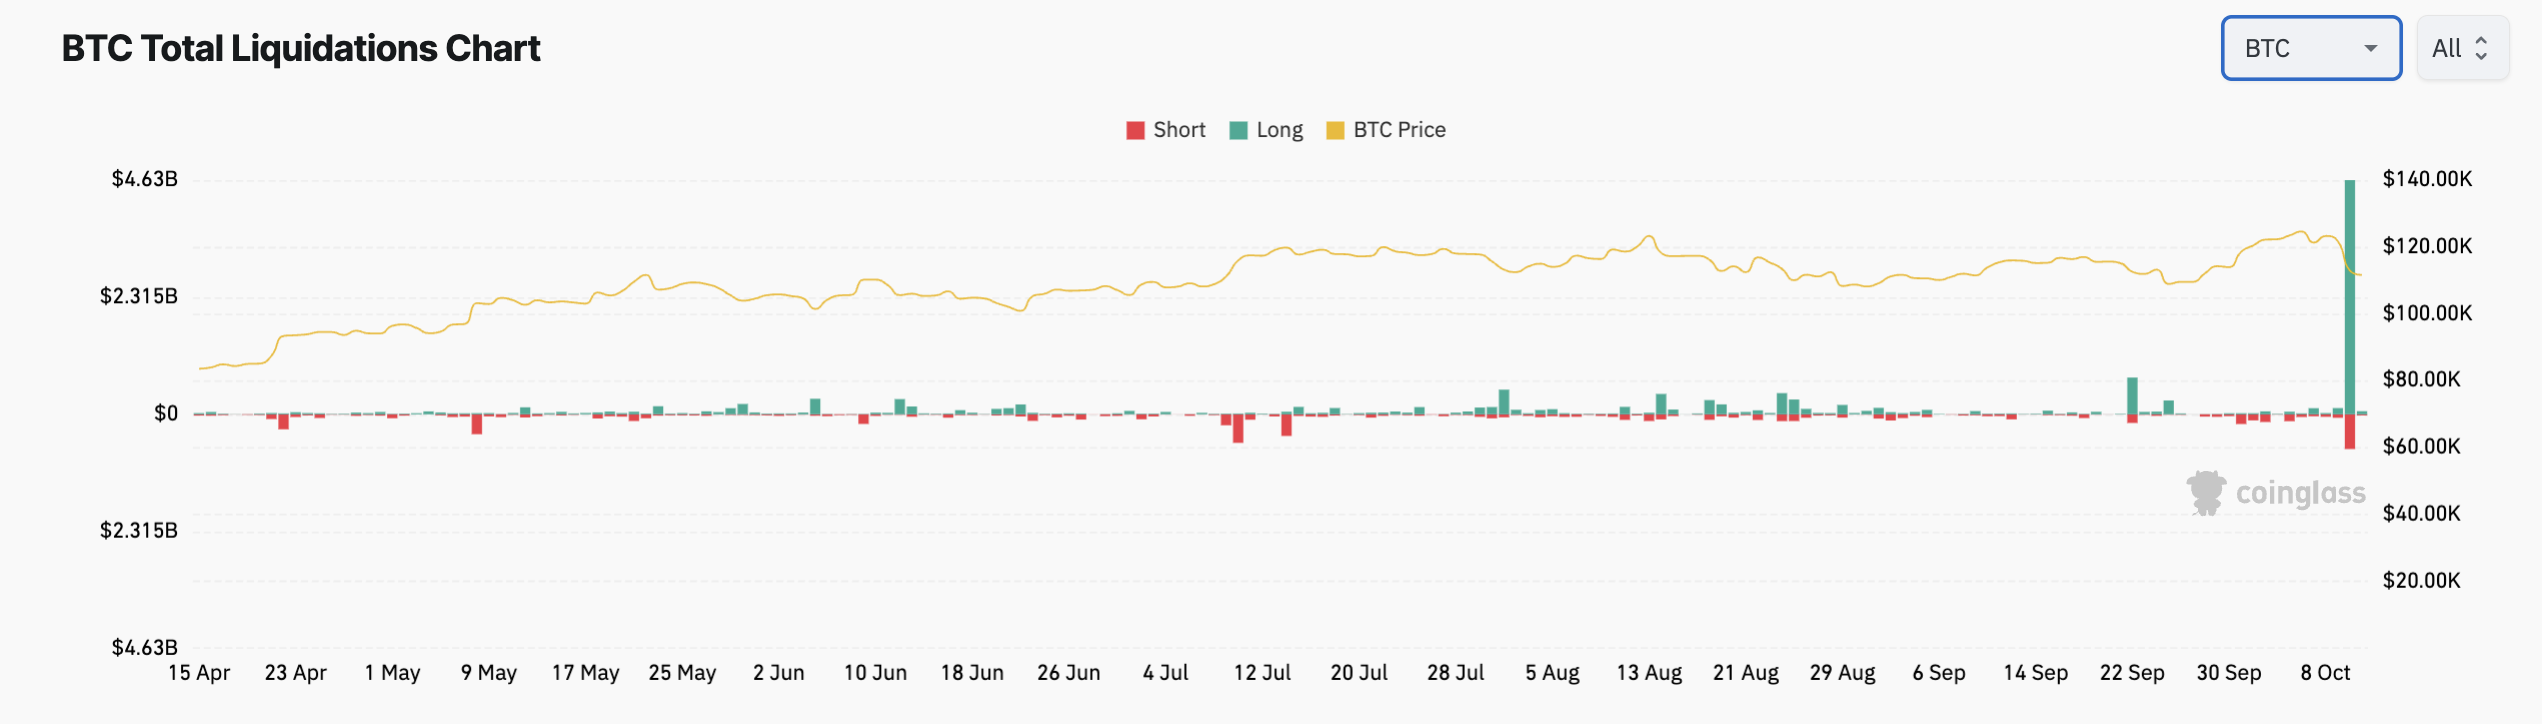 BTC total liquidations chart. Source: DefiLlama
As of Saturday, the price had surged by 8.50% from its low of approximately $103,000, yet it remained down 11% from its peak of $126,300 earlier that week.
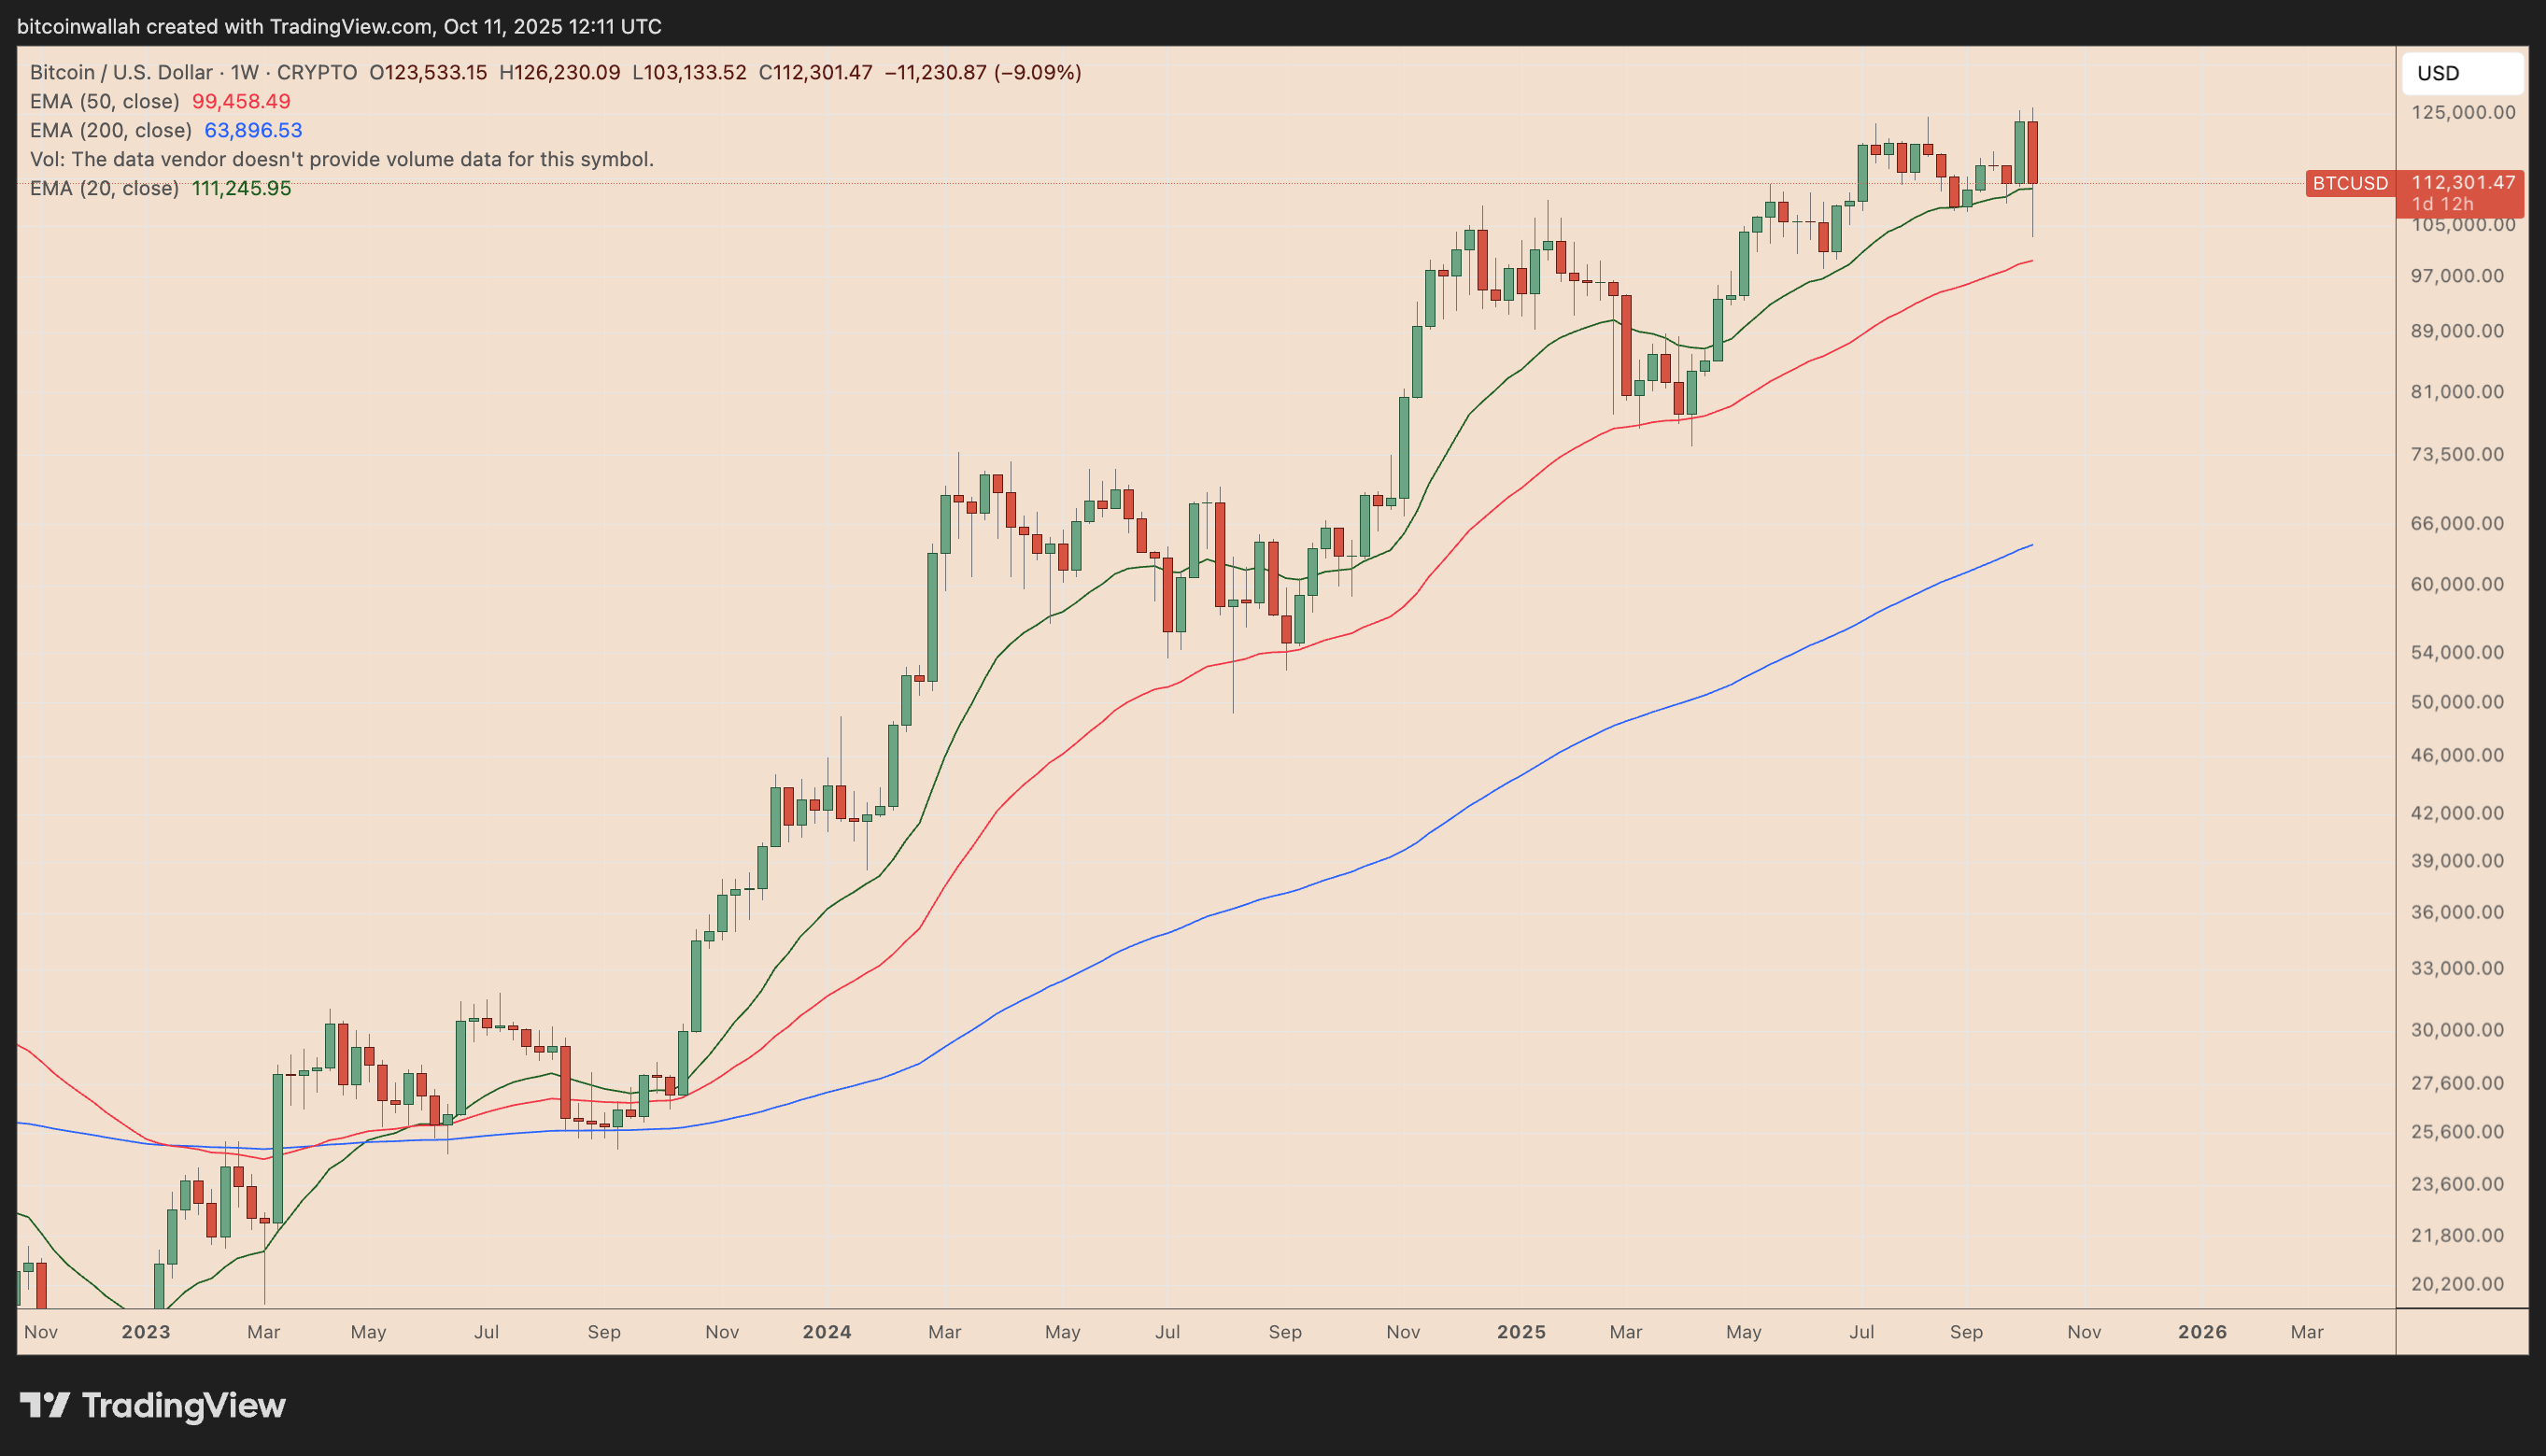 BTC/USD weekly price chart. Source: TradingView
Will Bitcoin’s recovery continue? The following three charts offer indications of favorable conditions for a possible rally soon.
Bitcoin Uptrend Unaffected by $5.39 Billion Liquidation
While Bitcoin’s recent drop might seem significant in shorter timeframes, a broader look suggests it is relatively minor compared to previous corrections. On the weekly chart, BTC has yet to fall more than 10%, which is less severe than past declines of 14-15% observed in March 2025 and July 2024, both of which saw rapid recoveries afterward.
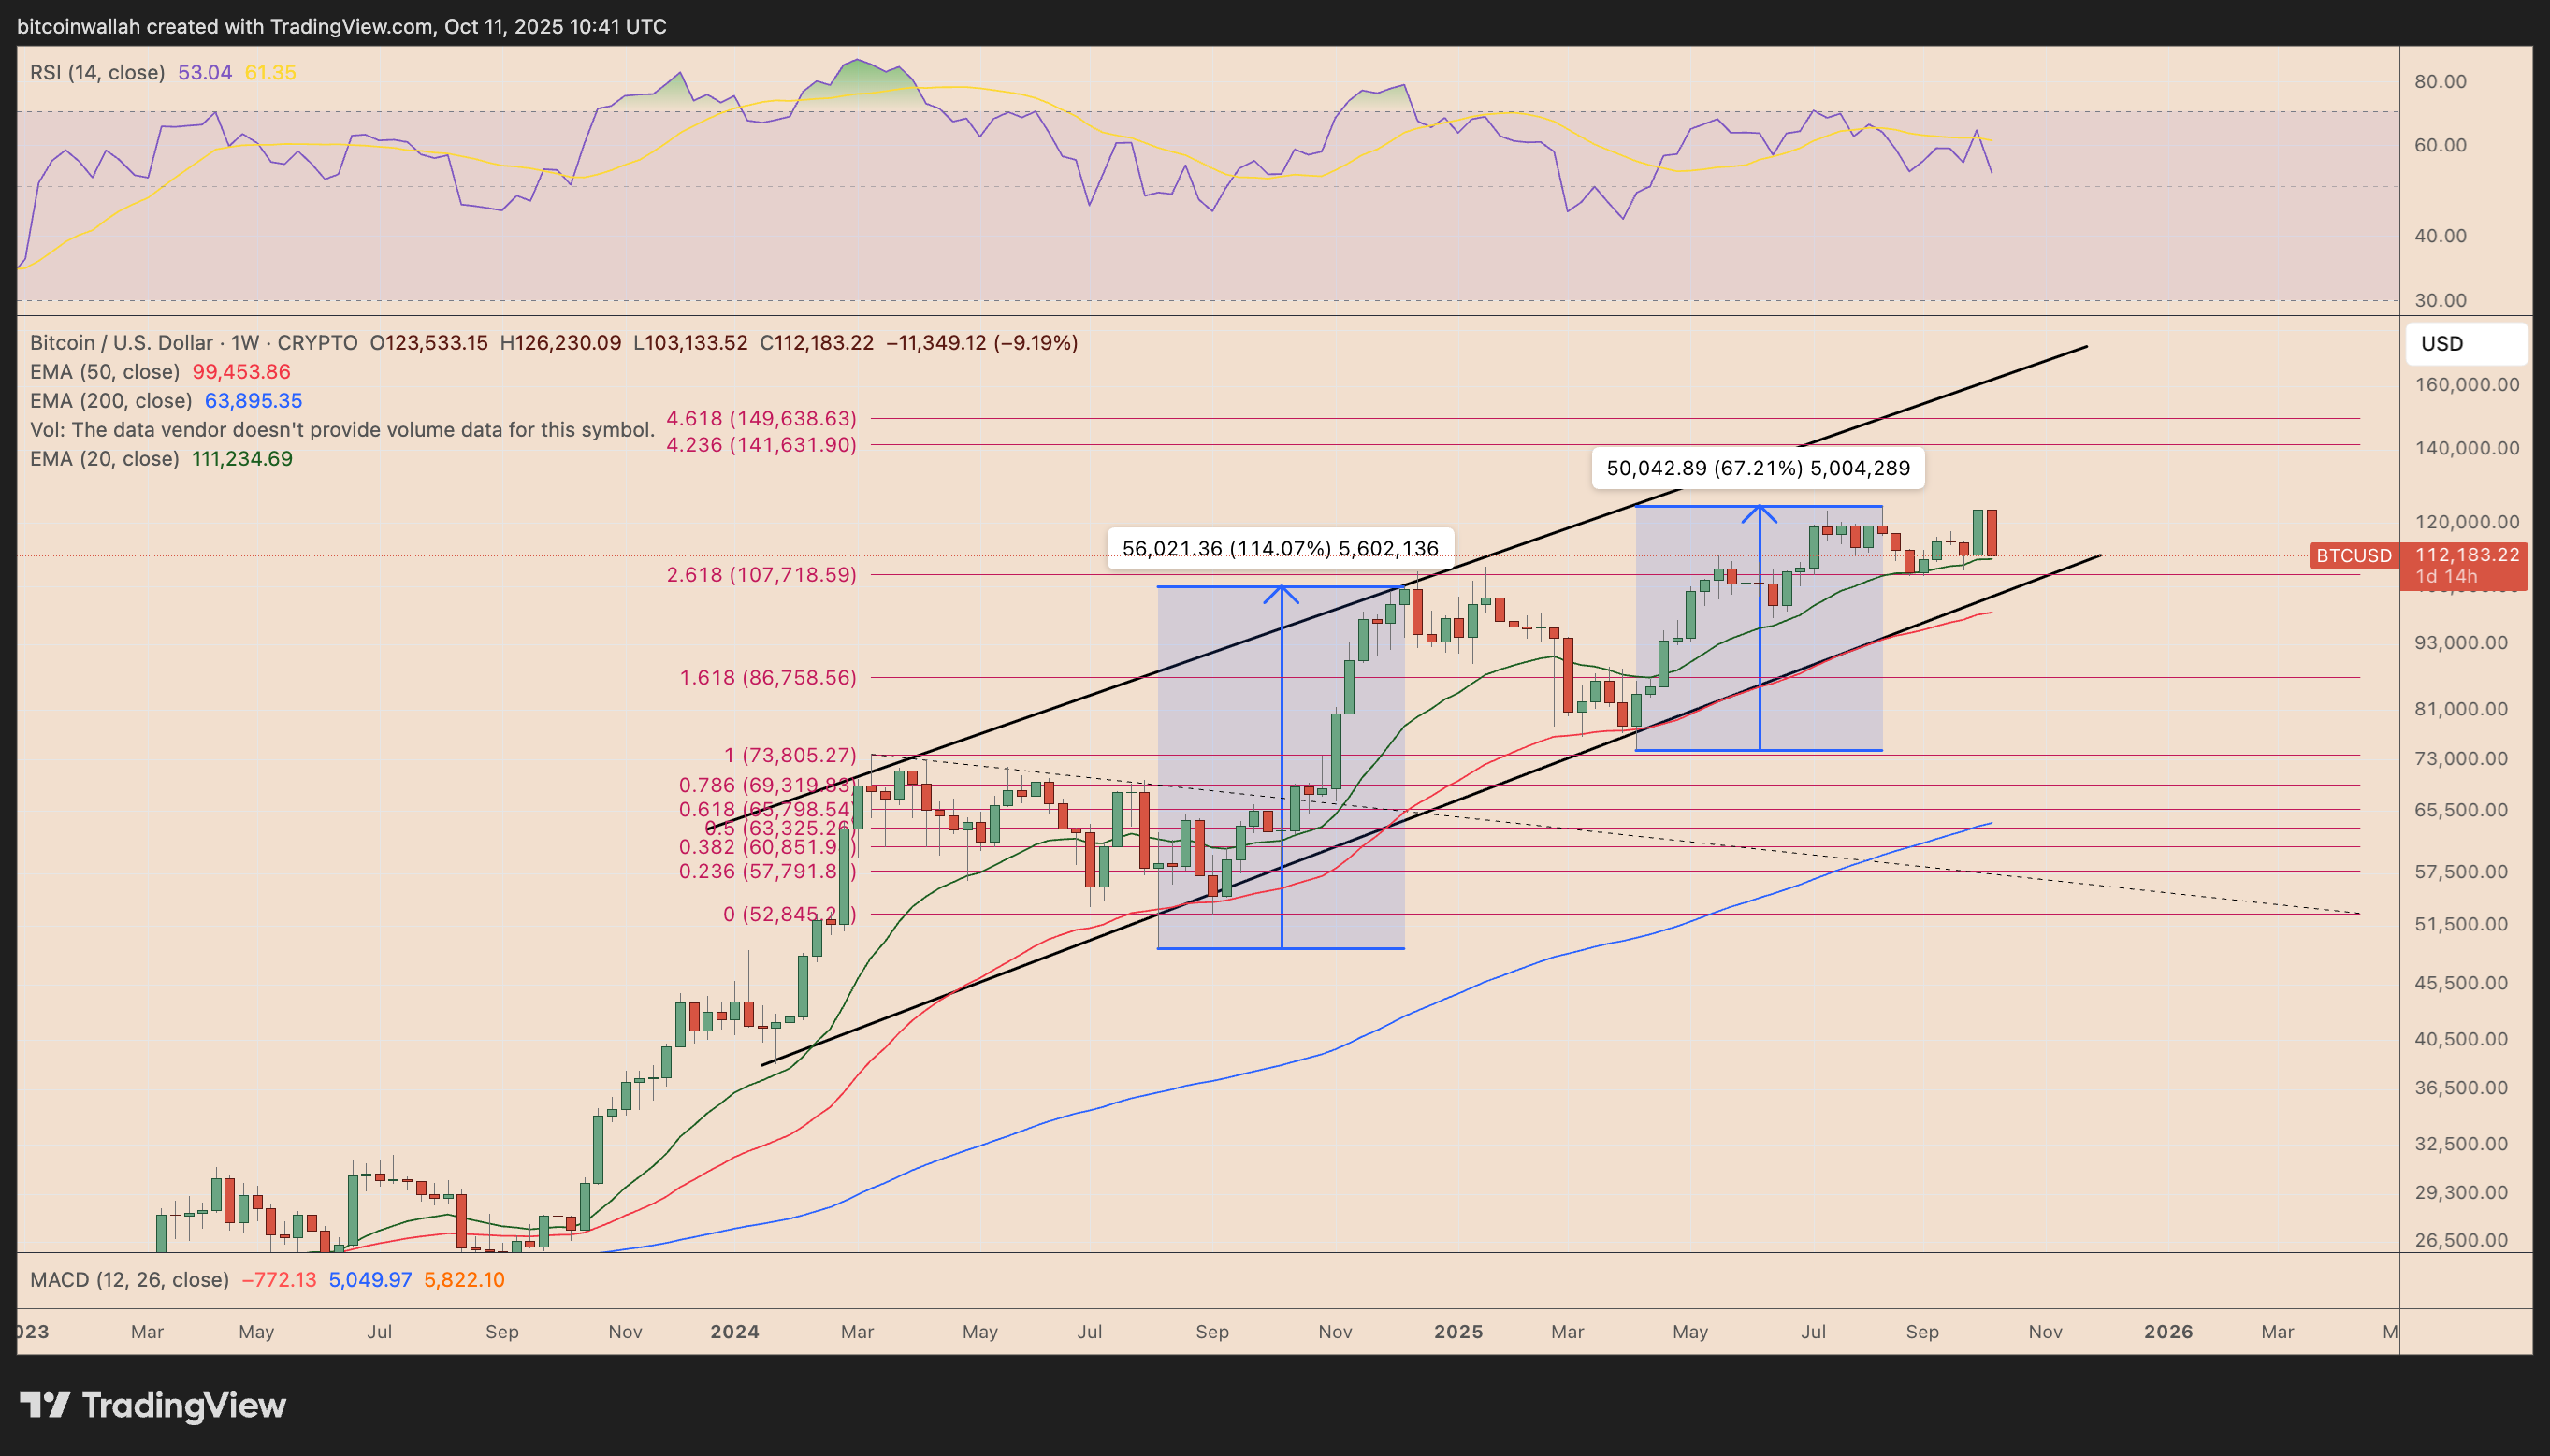 BTC/USD weekly price chart. Source: TradingView
Bitcoin remains firmly positioned within its upward channel, a supportive pattern that has directed its rise since mid-2023. Each test of the channel’s lower boundary saw buyers stepping forward, catalyzing further increases towards the upper range.
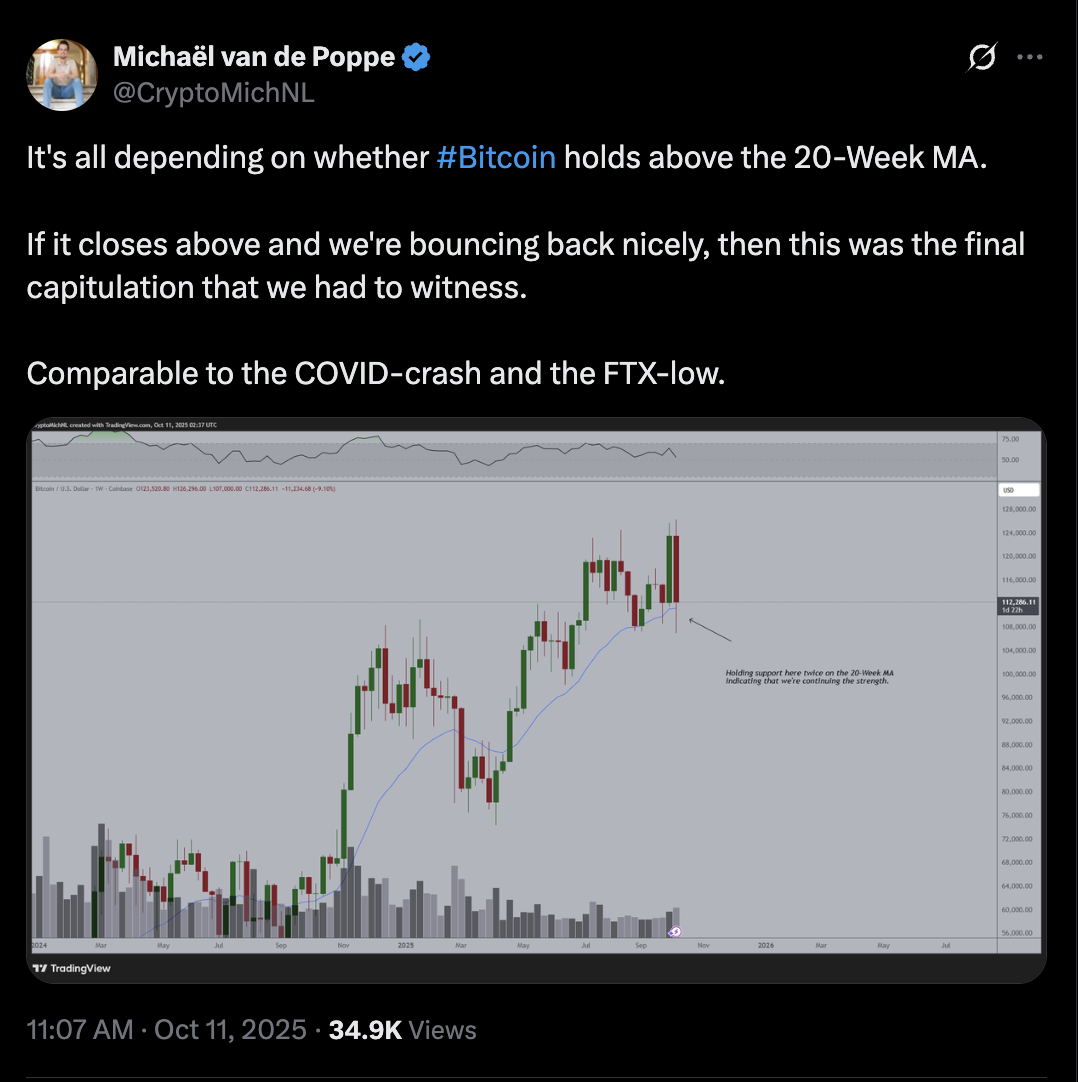
The pivotal point to monitor now is the 20-week moving average around $111,000, according to analyst Michaël van de Poppe.
 Source: X
If Bitcoin sustains above the 20-week MA support, this could signal the end of the capitulation phase, similar to the events following the 2020 COVID-19 crash and along the lines of the FTX crash.
This may also lay the foundation for a substantial upward trend, with estimates placing the target between $140,000 and $150,000 by year’s end.
BTC Sharks Capitalize on the Dip
While numerous smaller traders faced liquidation during the $5.39 billion fallout on Friday, significant purchasers, the so-called ‘sharks,’ took the opportunity to buy. The daily Shark Net Position Change, which monitors wallets with 100 to 1,000 BTC, has spiked to 190,296, reaching a peak not seen since September 2012, according to Glassnode data.
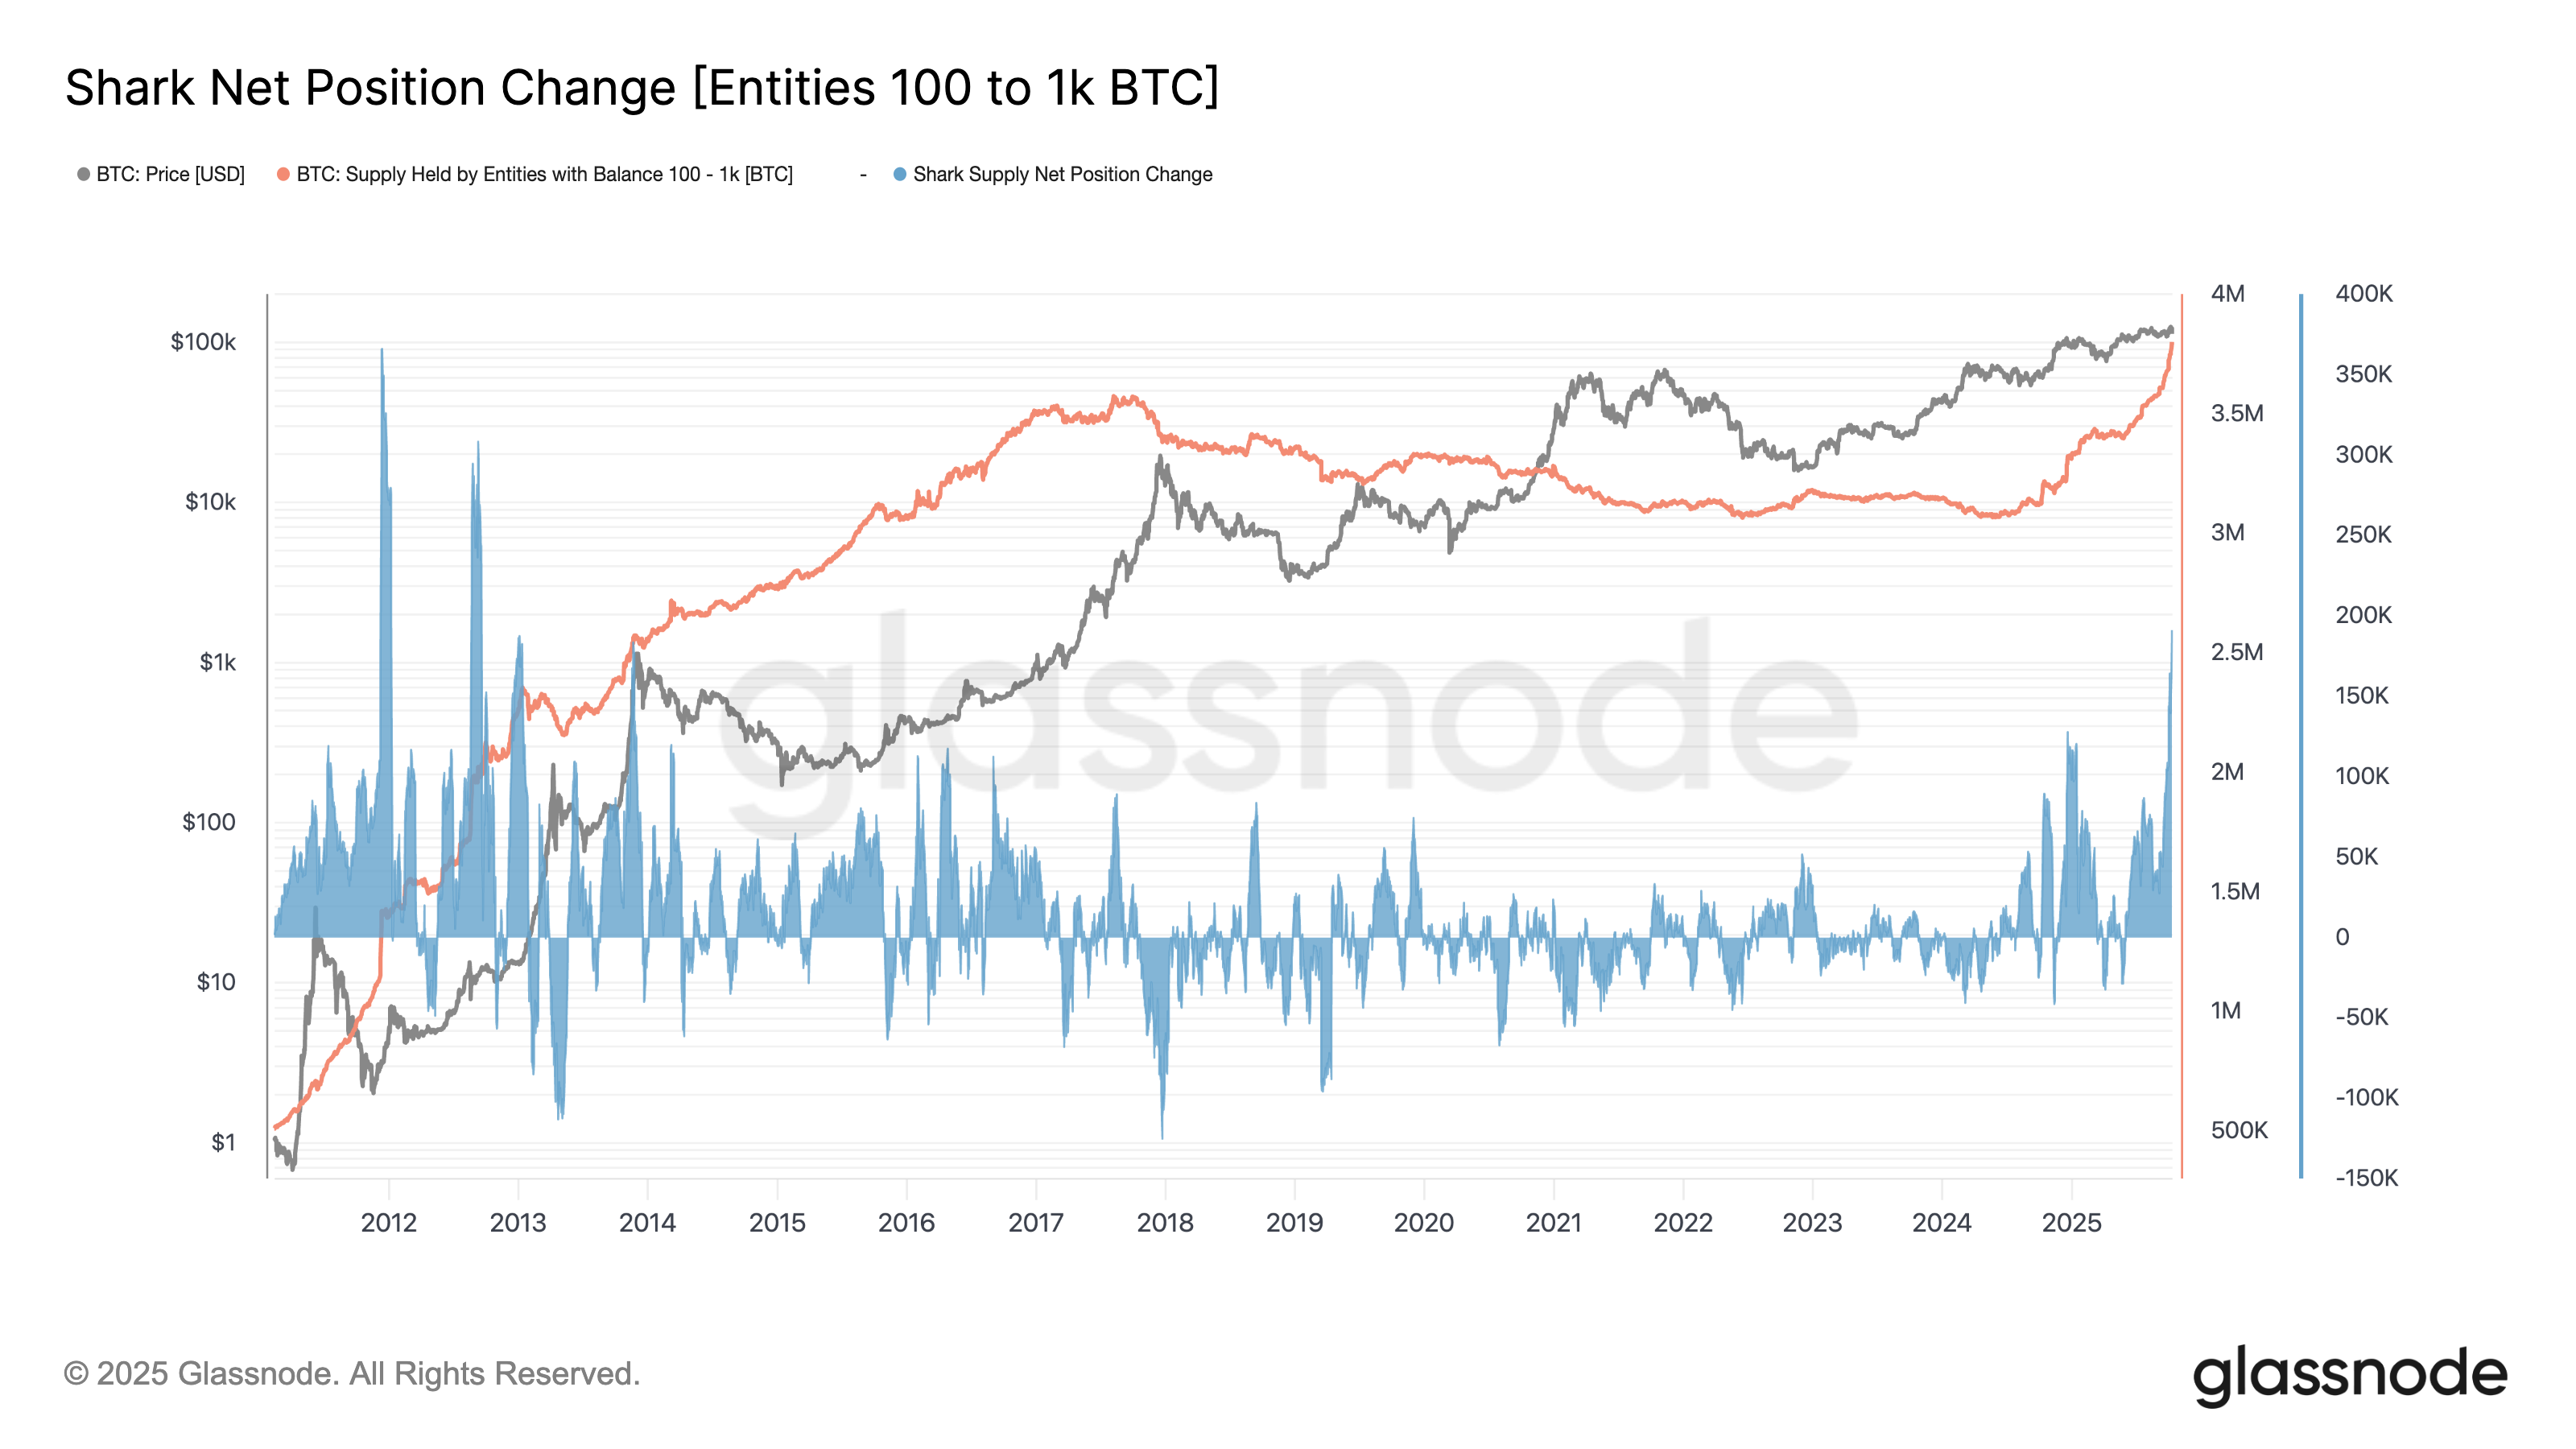 Bitcoin’s Shark Net Position Change. Source: Glassnode
Furthermore, the Bitcoin supply held by this group has skyrocketed in 2025, hitting a record high Friday, despite the price drop, indicating that experienced investors exhibit less panic.
Related: Bitcoin slump may rebound up to 21% in 7 days if history repeats: Economist
The actions of these larger entities may facilitate Bitcoin’s next significant recovery if the trend persists.
Bitcoin Bollinger Bands Indicating Potential
Recent corrections in Bitcoin may merely reflect a mid-cycle cooldown rather than the indicators of a prolonged bear market, according to chartist The Great Mattsby.
In prior Bitcoin bull markets, the uptrend ceased only after the monthly Bollinger Bands, which represent volatility, fully expanded. These bands widen during significant market swings and contract as price movements diminish.
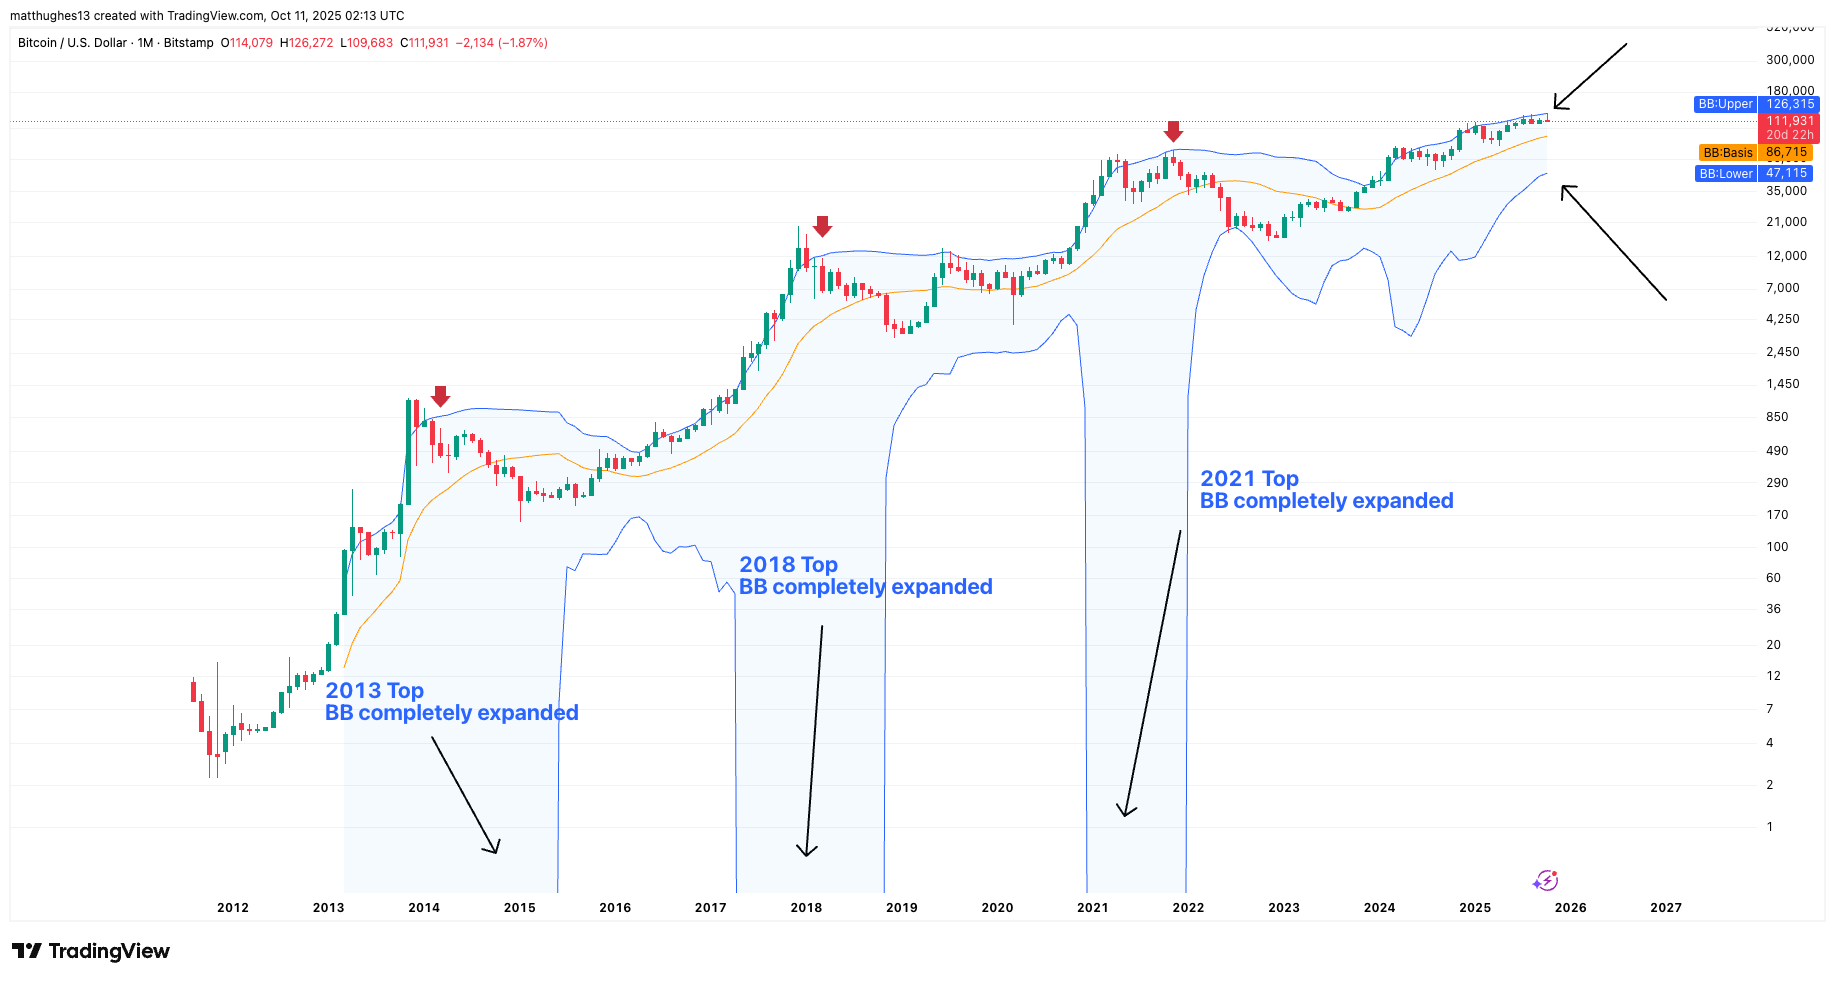 BTC/USD monthly price chart. Source: TradingView/The Great Mattsby
Historically, Bitcoin’s peaks in previous cycles, including 2013, 2018, and 2021, occurred when monthly bands were maximally stretched, indicating excessive volatility.
Currently, however, these bands are still on the tighter side, or “squeezing,” implying that price rallies could occur if historical patterns hold true.
The Great Mattsby remarked:
Using history as our guide, bear markets don’t start when the monthly Bollinger Bands are still squeezing. They begin at the culmination of their expansion.
This article does not serve as investment advice or recommendations. All investments and trading decisions carry risks, and readers are advised to conduct their own research before making decisions.
