Bitcoin Price Forecast: Is BTC's Trend Turning Bearish Following the Recent Decline?
An analysis of Bitcoin's price movement following a significant drop from all-time highs, highlighting market sentiment and possible future trends.


Bitcoin was unable to maintain its upward momentum and missed the opportunity to reach new all-time highs of over $126,000, resulting in a substantial pullback that has left the market on edge. Investors are exhibiting signs of anxiety as the recent decline has disrupted the optimistic outlook many had for further gains, indicating a potential shift towards a bearish trend.
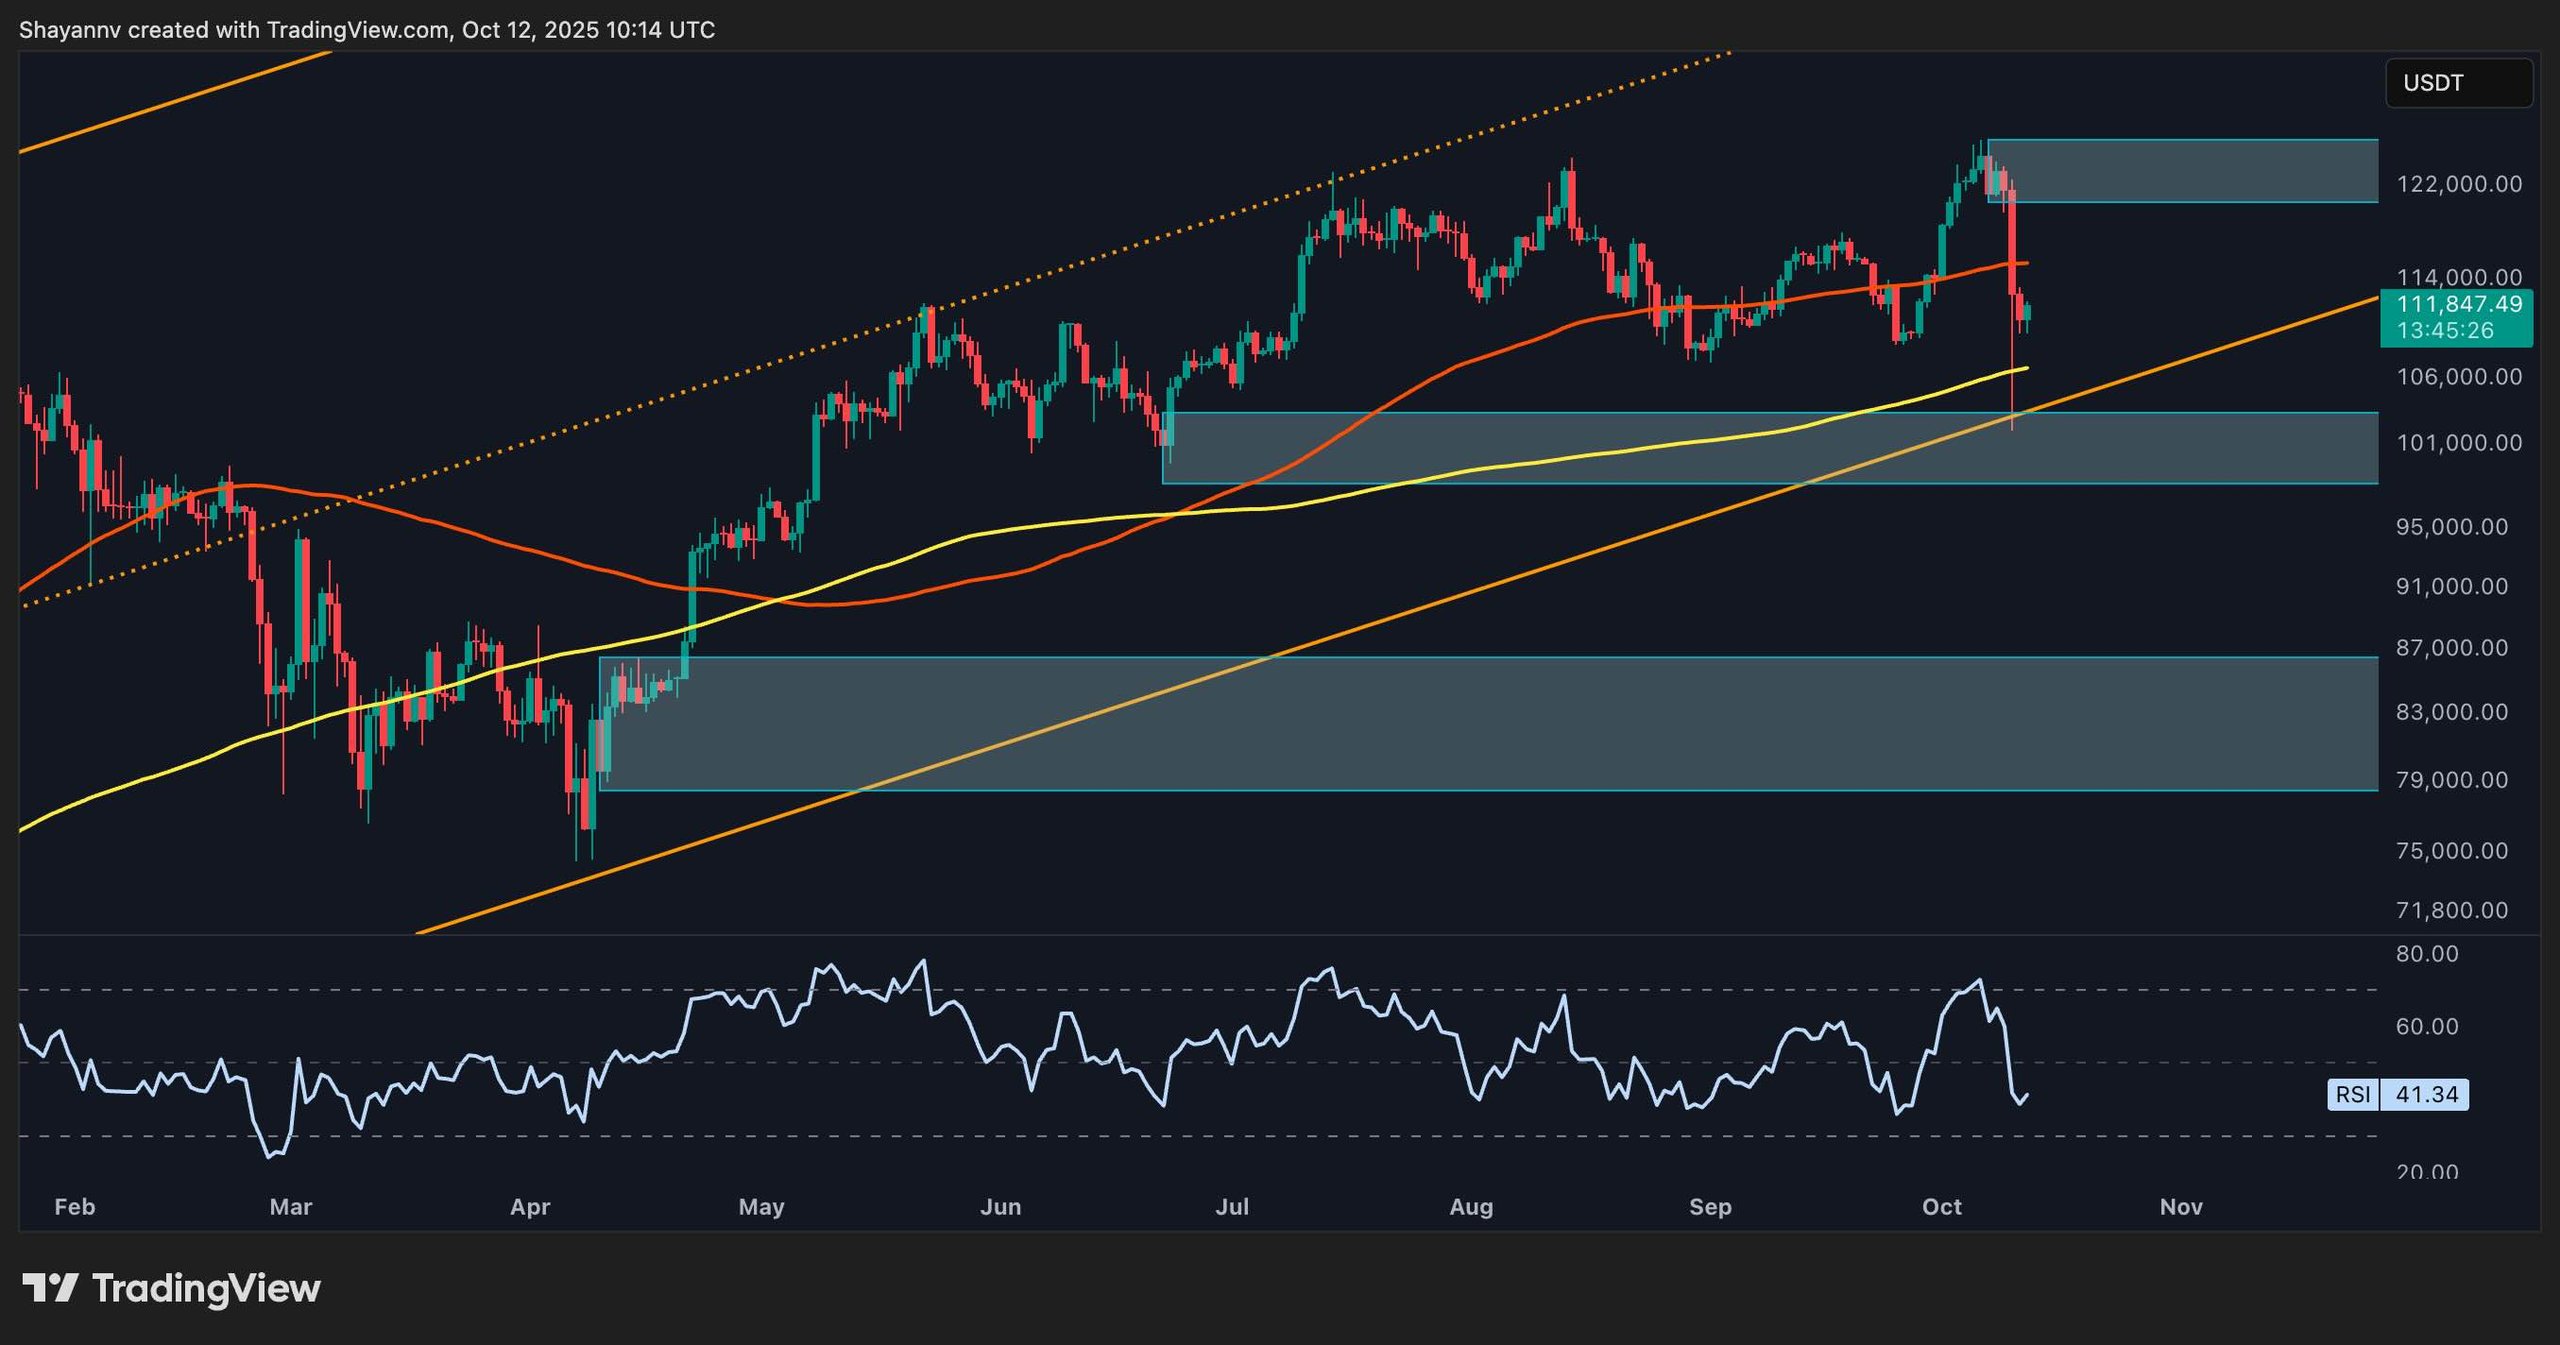
Daily Chart Analysis
In the daily chart, Bitcoin (BTC) could not successfully surpass the $126,000 mark and has instead dropped swiftly into the $100,000 territory, only to subsequently recover temporarily. The failure to stay above the previous all-time high, along with the breach of the 100-day moving average, suggests a significant loss in bullish momentum.
The critical support zone now stands around $100,000, which correlates with both a trendline support and the 200-day moving average. With the RSI hovering near 41, it implies that there is still potential for further downside if buyers do not step in soon.
Daily BTC Chart
4-Hour Chart Analysis
The 4-hour analysis shows that Bitcoin has found a temporary support level around $110,000 following the significant sell-off. This area previously acted as an accumulation zone prior to the last surge, making it a key level to watch closely.
The RSI remains weak at around 32, signaling limited buying pressure. Immediate resistance is identified near $117,000, where past support has now turned into resistance. A rejection at this level could lead to another decrease, potentially targeting the $105,000 mark, which aligns with the lower boundary of the ascending channel. A break below this channel could result in a protracted downturn for Bitcoin and the broader crypto market.
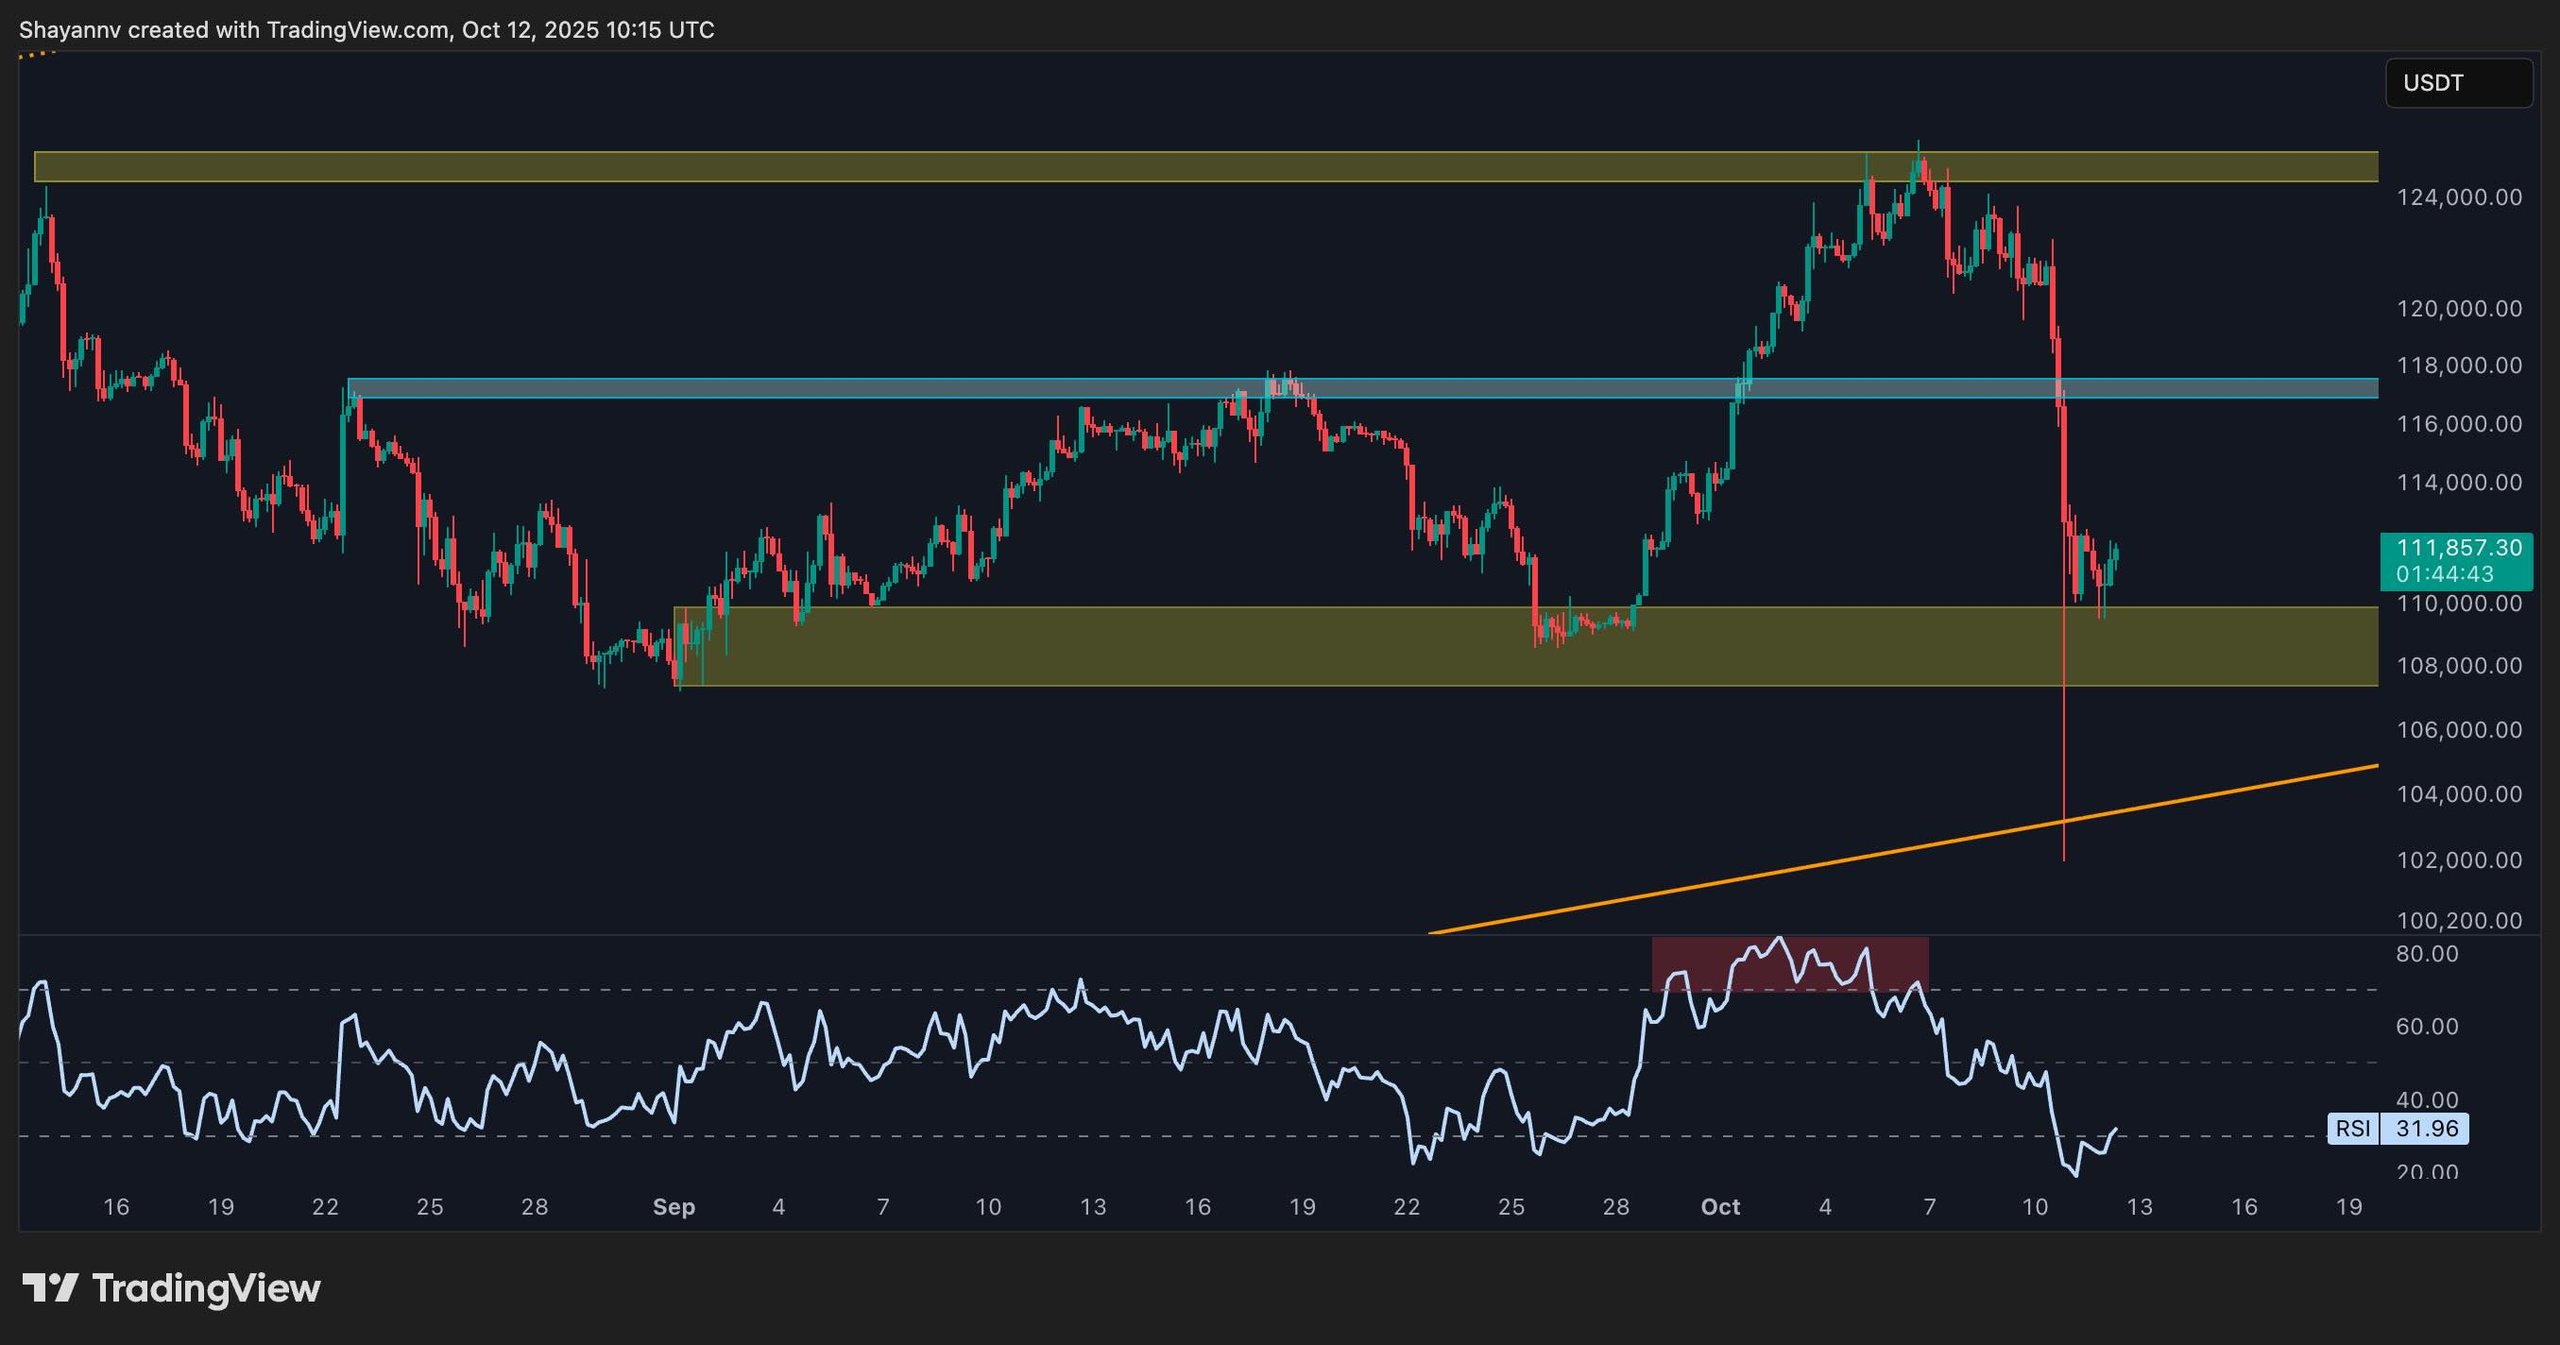 4-Hour BTC Chart
Sentiment Analysis
Long Liquidations (7-day Moving Average)
The liquidation chart reveals a remarkable spike in long liquidations, the highest ever recorded, coinciding with Bitcoin’s failure to achieve a new peak. This liquidity crunch has forced several overextended traders out of the market, vastly reducing open interest.
Historically, such liquidation events can indicate short-term price bottoms; however, given the current sentiment, investors are cautious about re-entering the market aggressively. The prevailing fear-driven sentiment implies that while a relief bounce may occur, faith in a sustaining upward trend has notably diminished. This might be signaling the potential end of this bullish phase in the market, particularly if the price closes below $100,000.
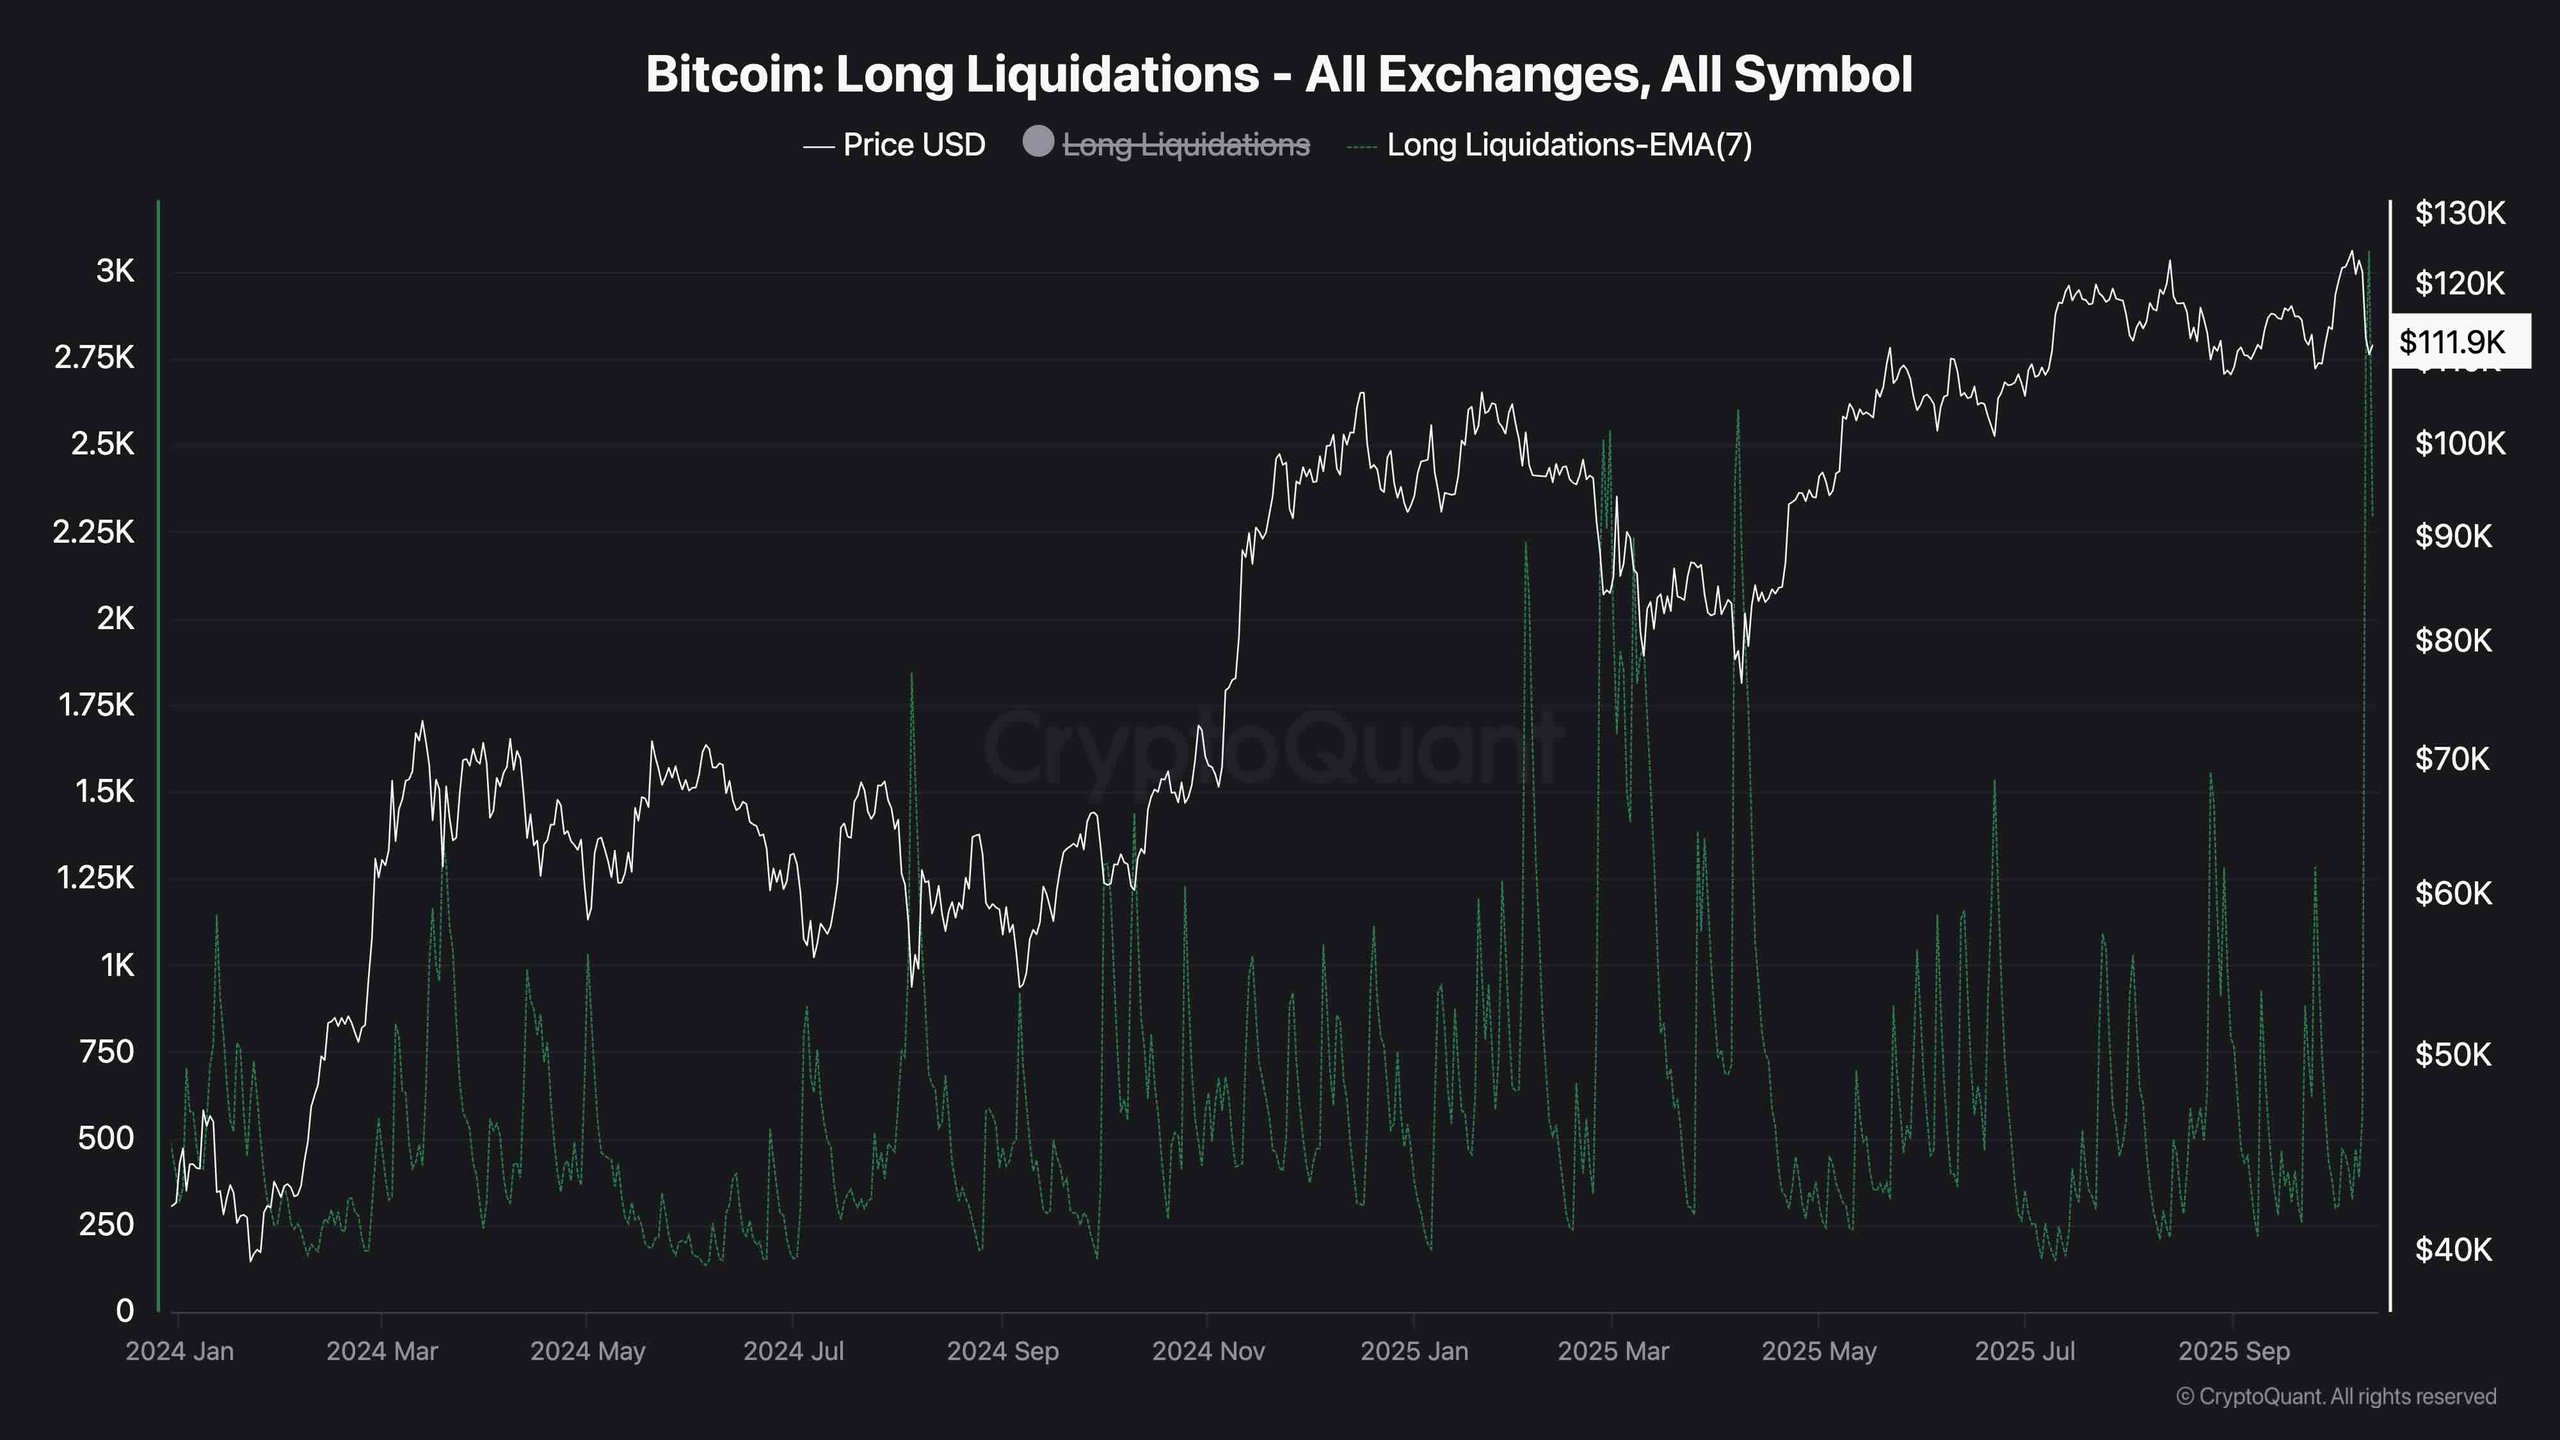 Liquidation Chart
