Ethereum's Recovery Gains Traction: An Analysis of Price Movements
A detailed analysis of Ethereum's current price movements following macroeconomic fluctuations. Key resistance levels and potential future targets are discussed.


Following last week’s liquidation events, Ethereum is showing early signs of recovery. Despite the recent price drops in the cryptocurrency market, ETH has managed to maintain a crucial support level and target significant resistance zones.
Technical Analysis
Daily Chart
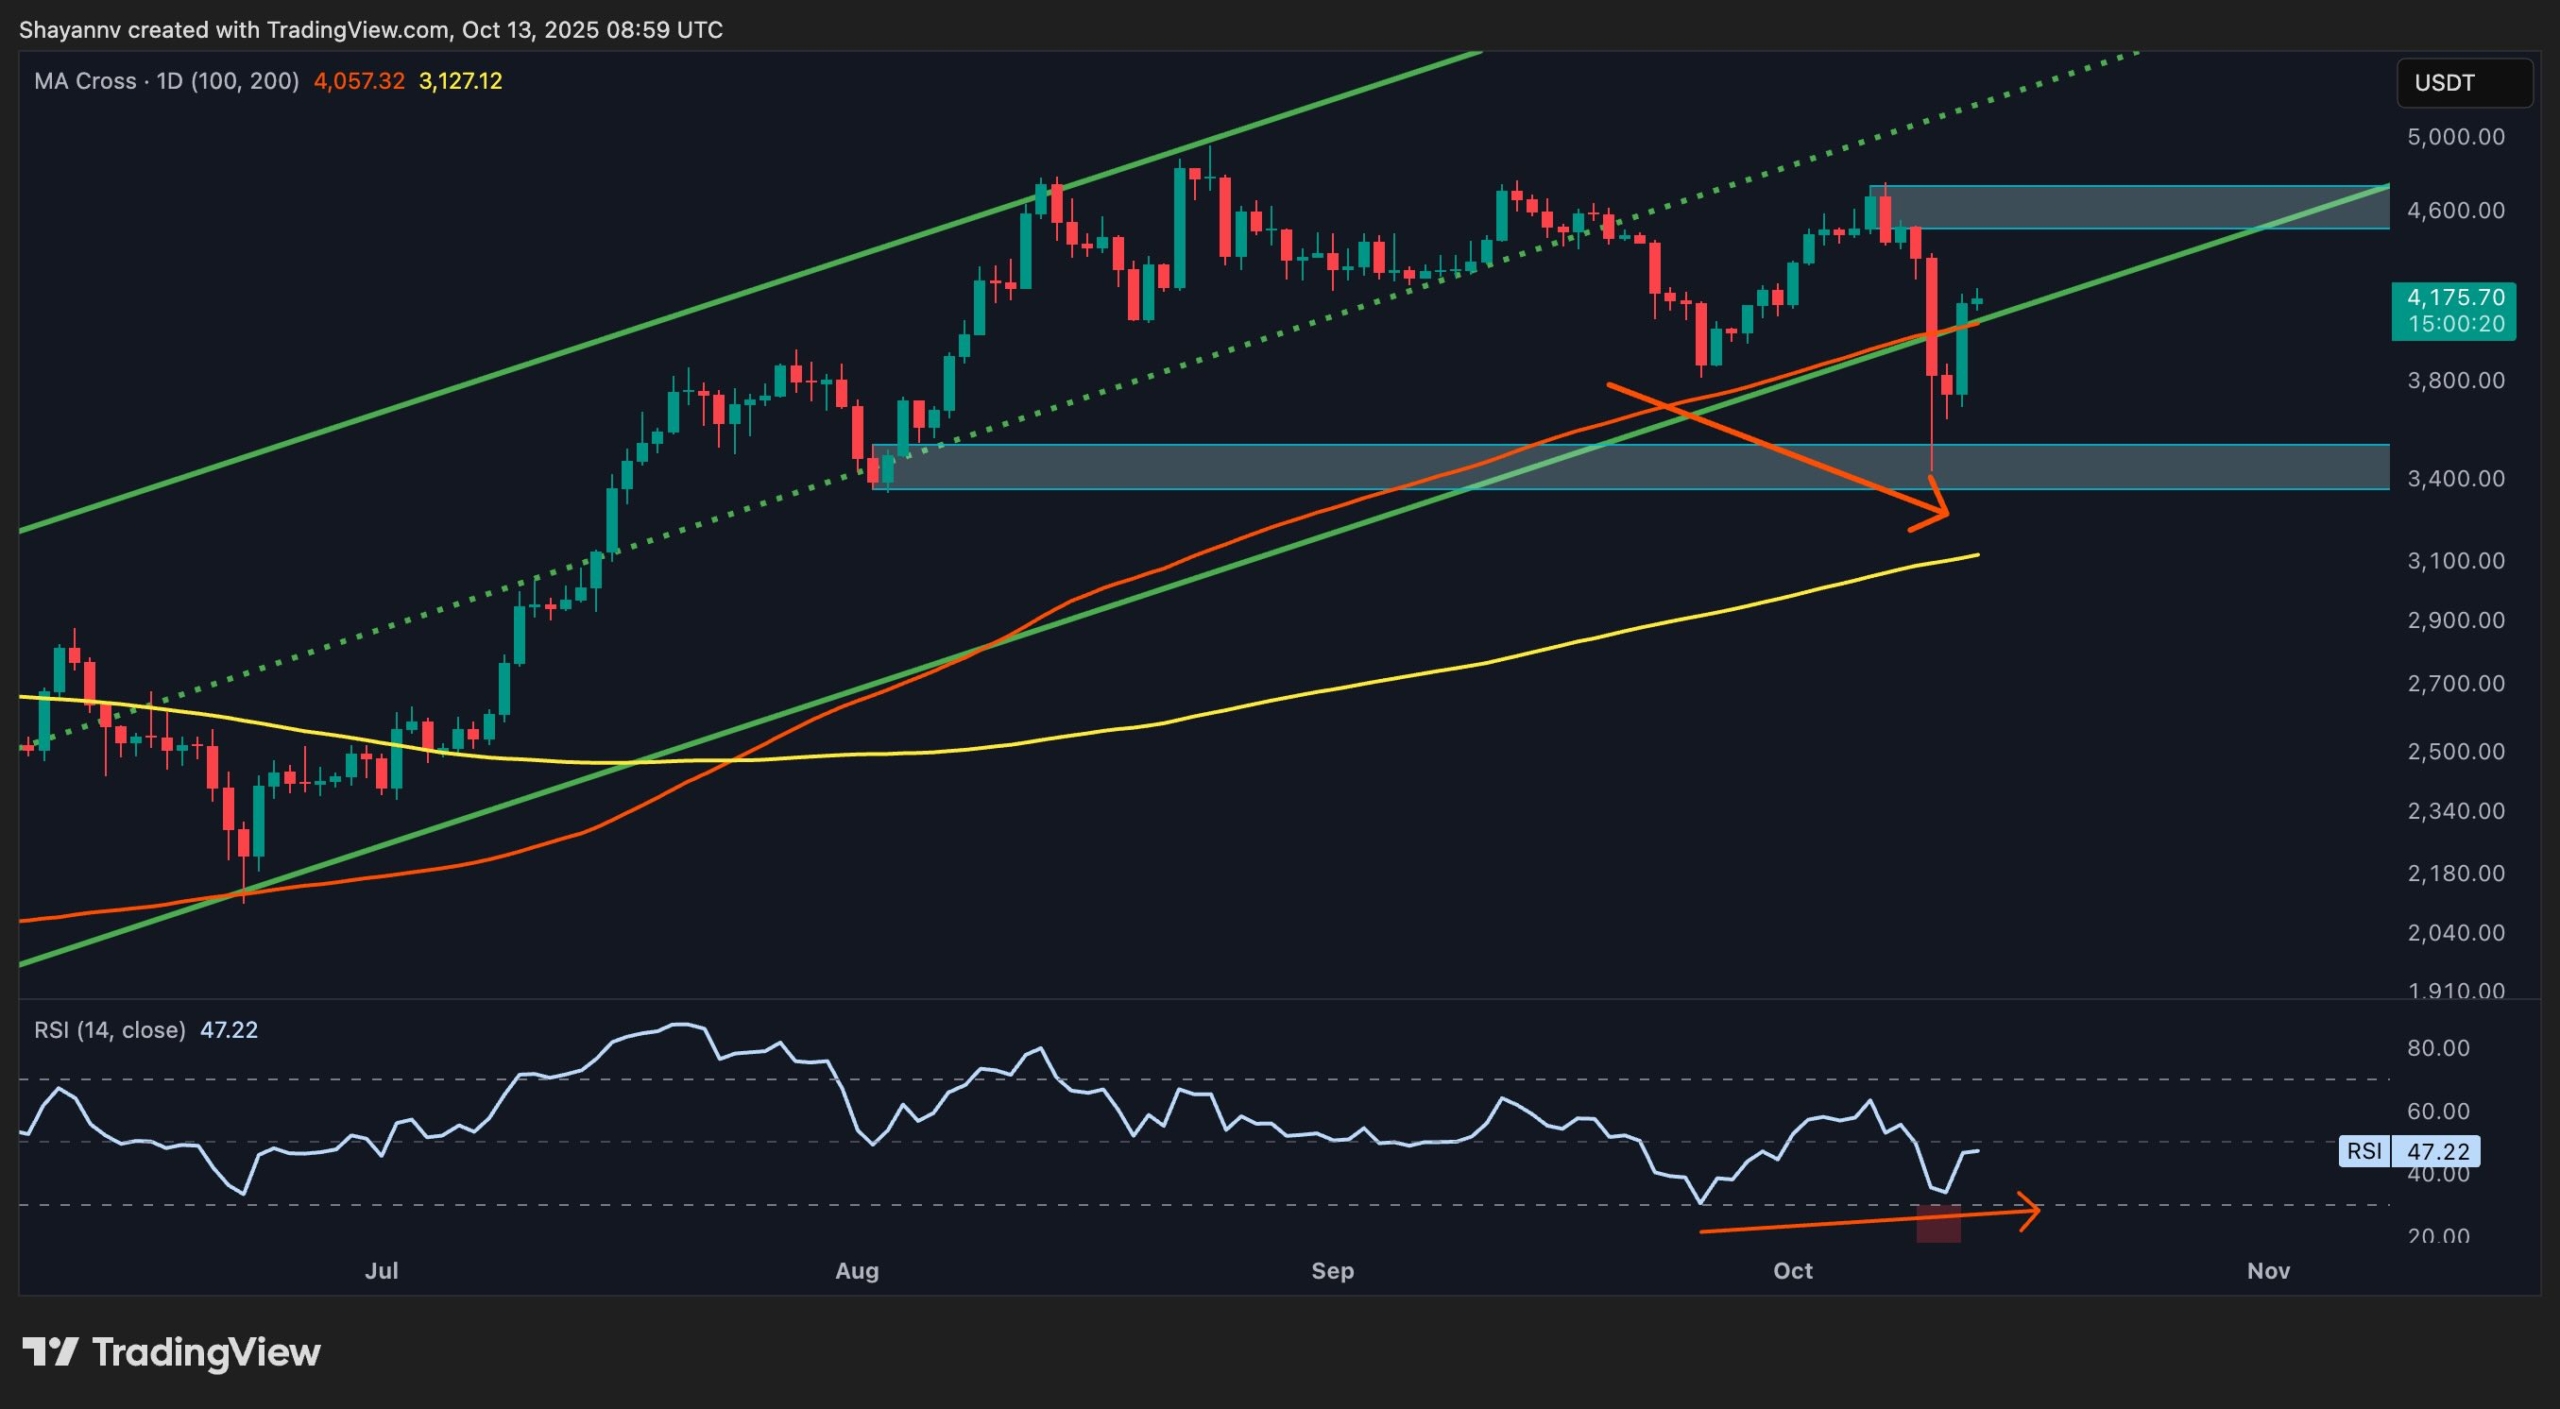
On the daily chart, Ethereum rebounded strongly from the critical $3.4K demand area, aligning with the 200-day moving average. This level has proven to be significant support, and the price surge past the $4K mark indicates that buyers are keen on regaining control.
Ethereum faces resistance in the $4.2K-$4.3K range, where previously disrupted market structures coincide with key Fibonacci retracement levels. If the price manages to close above $4.3K, it could pave the way for further movement towards the $4.6K-$4.7K area.
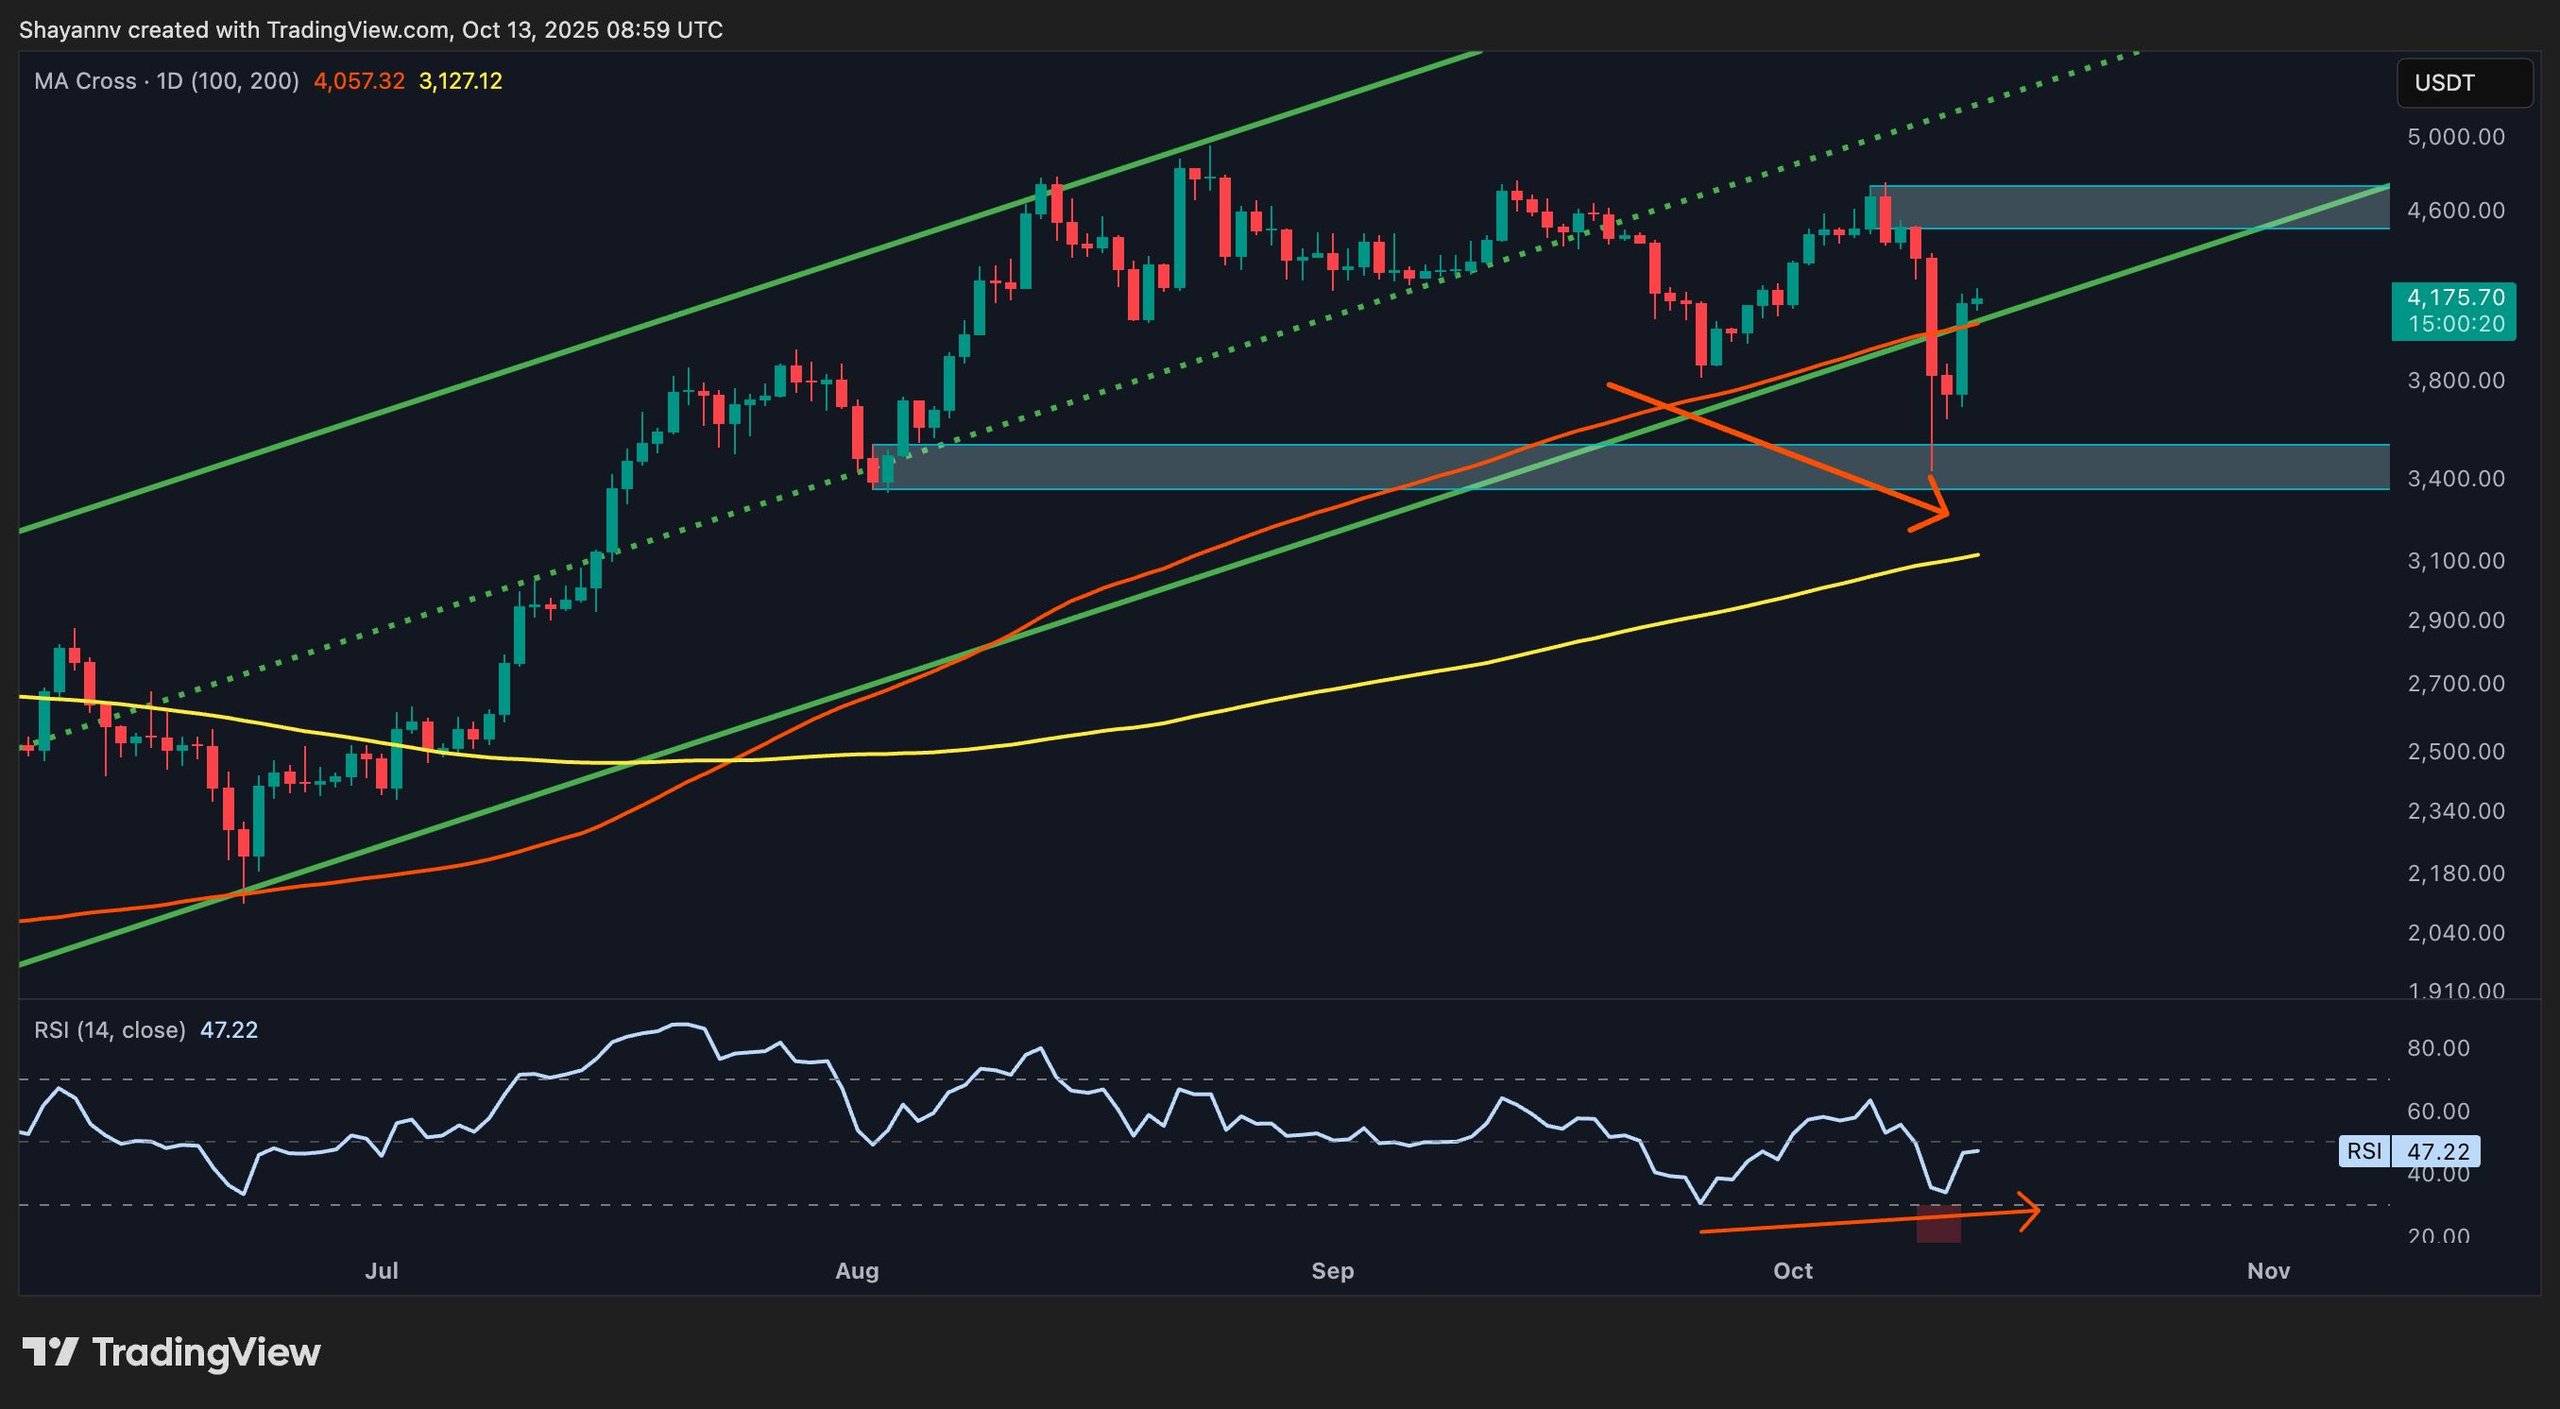 Ethereum Daily Chart
4-Hour Chart
On the shorter 4-hour timeframe, Ethereum has bounced back above its earlier ascending trendline, turning this level into temporary support. The price now targets the $4.25K Fibonacci retracement zone, while the $4K-$4.1K region serves as a crucial decision point. Staying above these levels indicates ongoing bullish momentum.
Sentiment Analysis
Recent data from Binance indicates that last week’s crash resulted in a substantial liquidation cluster between $3.4K and $3.6K. This phase acted as a cleanse for the market, potentially setting up for more stable growth. The absence of significant liquidity below the current price suggests the market is poised for a cautious recovery.
As Ethereum strives to overcome its resistance at $4.3K, the market sentiment appears favorable, which could lead to higher price targets in the near future.
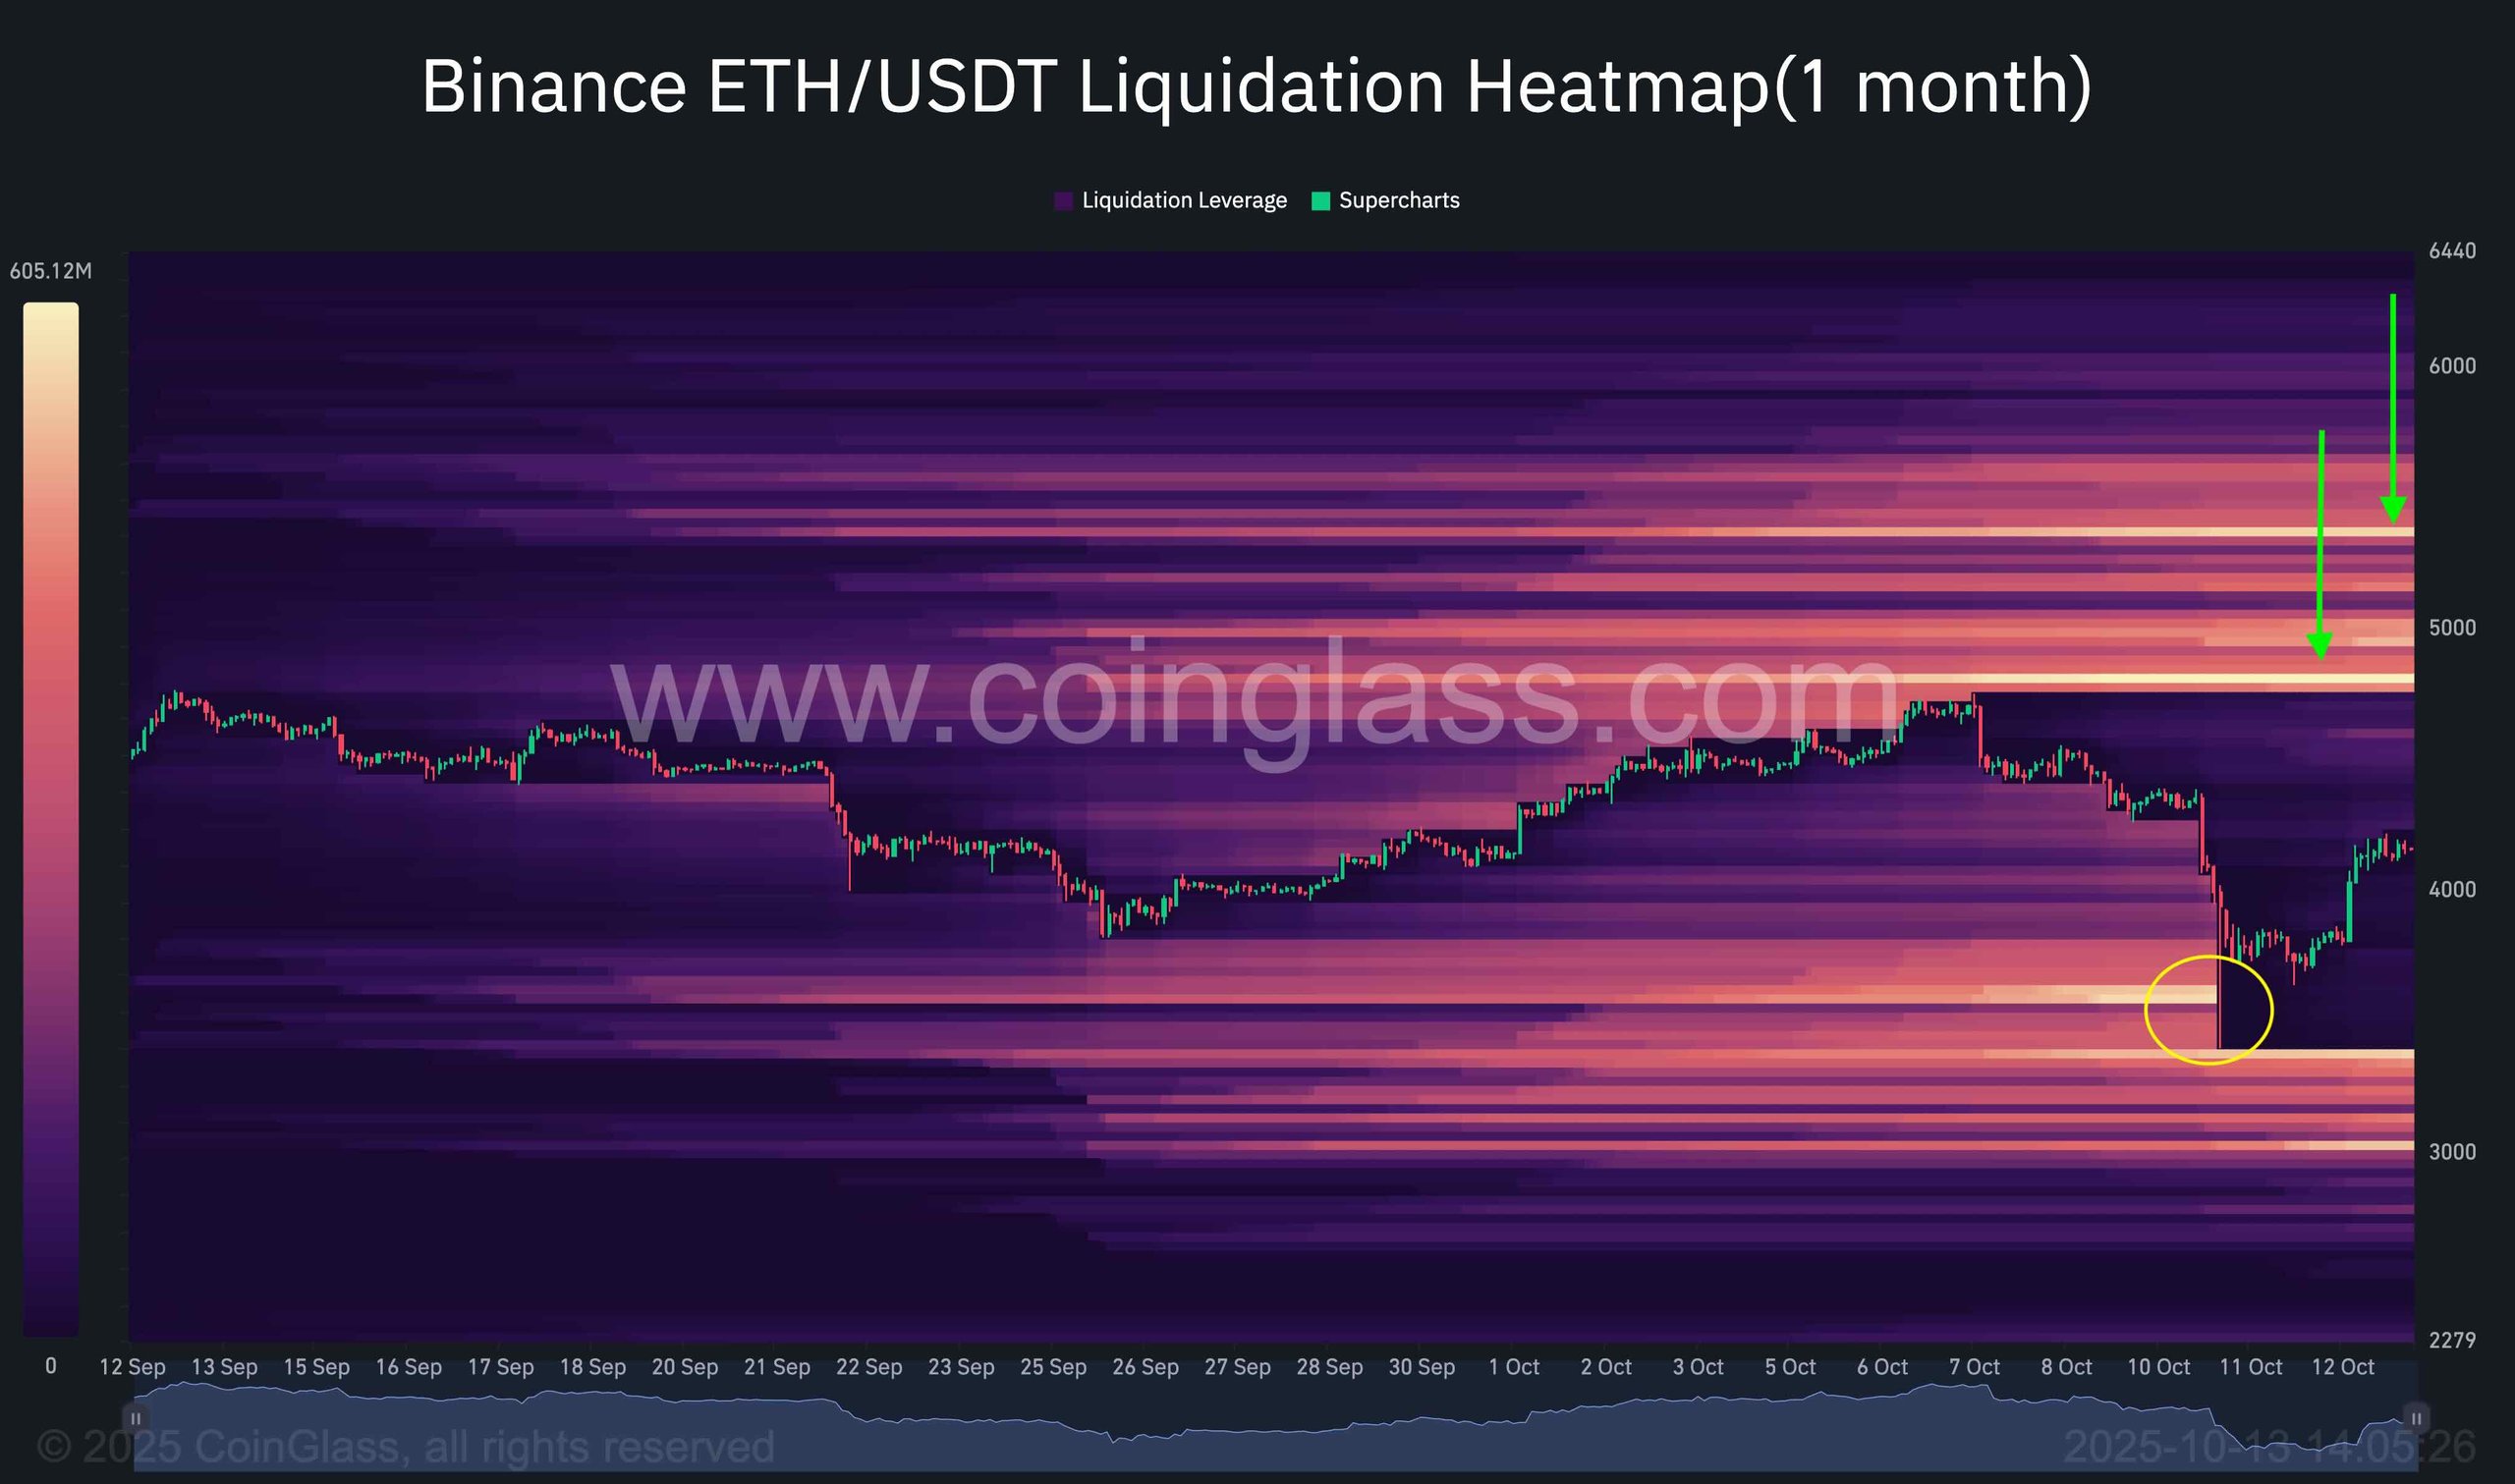 Binance Liquidation Heatmap
