
Bitcoin’s price fluctuated around $114,000 as traders kept an eye on whale movements and essential support levels. Key takeaways include:
- Bitcoin is currently facing a sell-off as a major whale increases its short position, now totaling 3,500 BTC.
- Short-term holders are feeling the price strain, having a cost basis slightly below $114,000.
- Traders are closely monitoring key moving averages for signals on potential support bases.
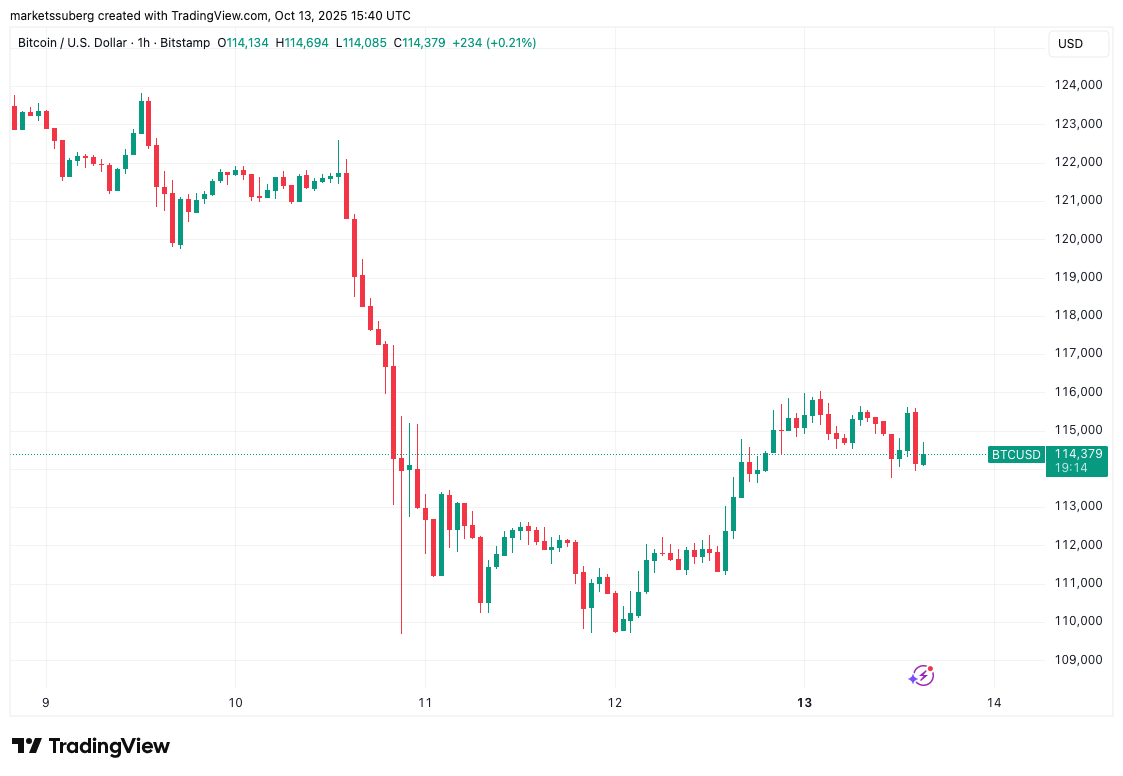 BTC/USD Chart
BTC/USD one-hour chart. Source: Cointelegraph/TradingView
BTC/USD Chart
BTC/USD one-hour chart. Source: Cointelegraph/TradingView
Major Whale’s Short Position Expansion
Recent data from Cointelegraph Markets Pro and TradingView indicates BTC/USD struggled after peaking at $116,000.
Markets remained stable despite recent comments from U.S. officials regarding a possible U.S.-China trade agreement. Treasury Secretary Scott Bessent announced upcoming discussions with China.
“We believe this is a tactical escalation (by Beijing) to shape pre-summit bargaining, not a strategic decoupling,” Morgan Stanley analysts noted, as cited by sources including Reuters.
Amidst awaiting market cues, a significant Bitcoin whale capitalized on a recent $20 billion liquidation by adding to its short position just before trade tensions became public.
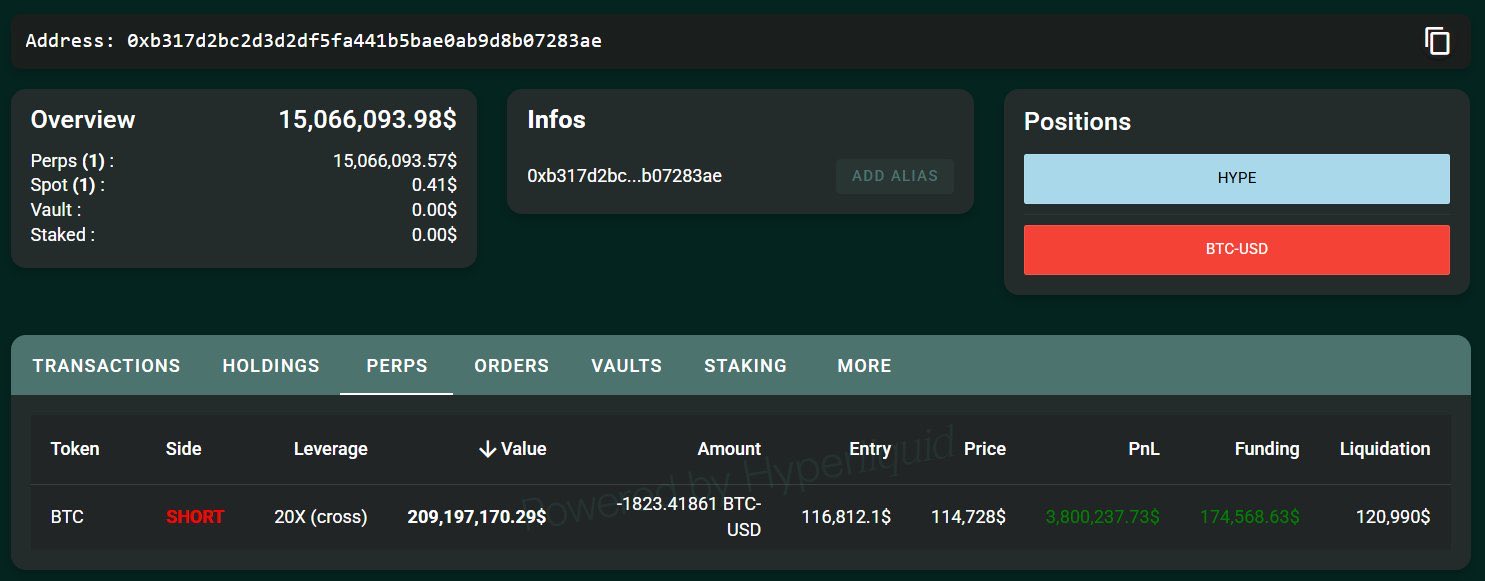 Whale Position
Bitcoin whale short position. Source: Max Keiser/X
Whale Position
Bitcoin whale short position. Source: Max Keiser/X
Price Movements
Bitcoin’s price continues to hover around critical support levels, closely tracked by short-term holders.
Onchain analytics show the cost basis for these holders stands at $113,861. Monitor the 30, 90, and 200-day simple moving averages as they carry significant weight in ongoing market trends.
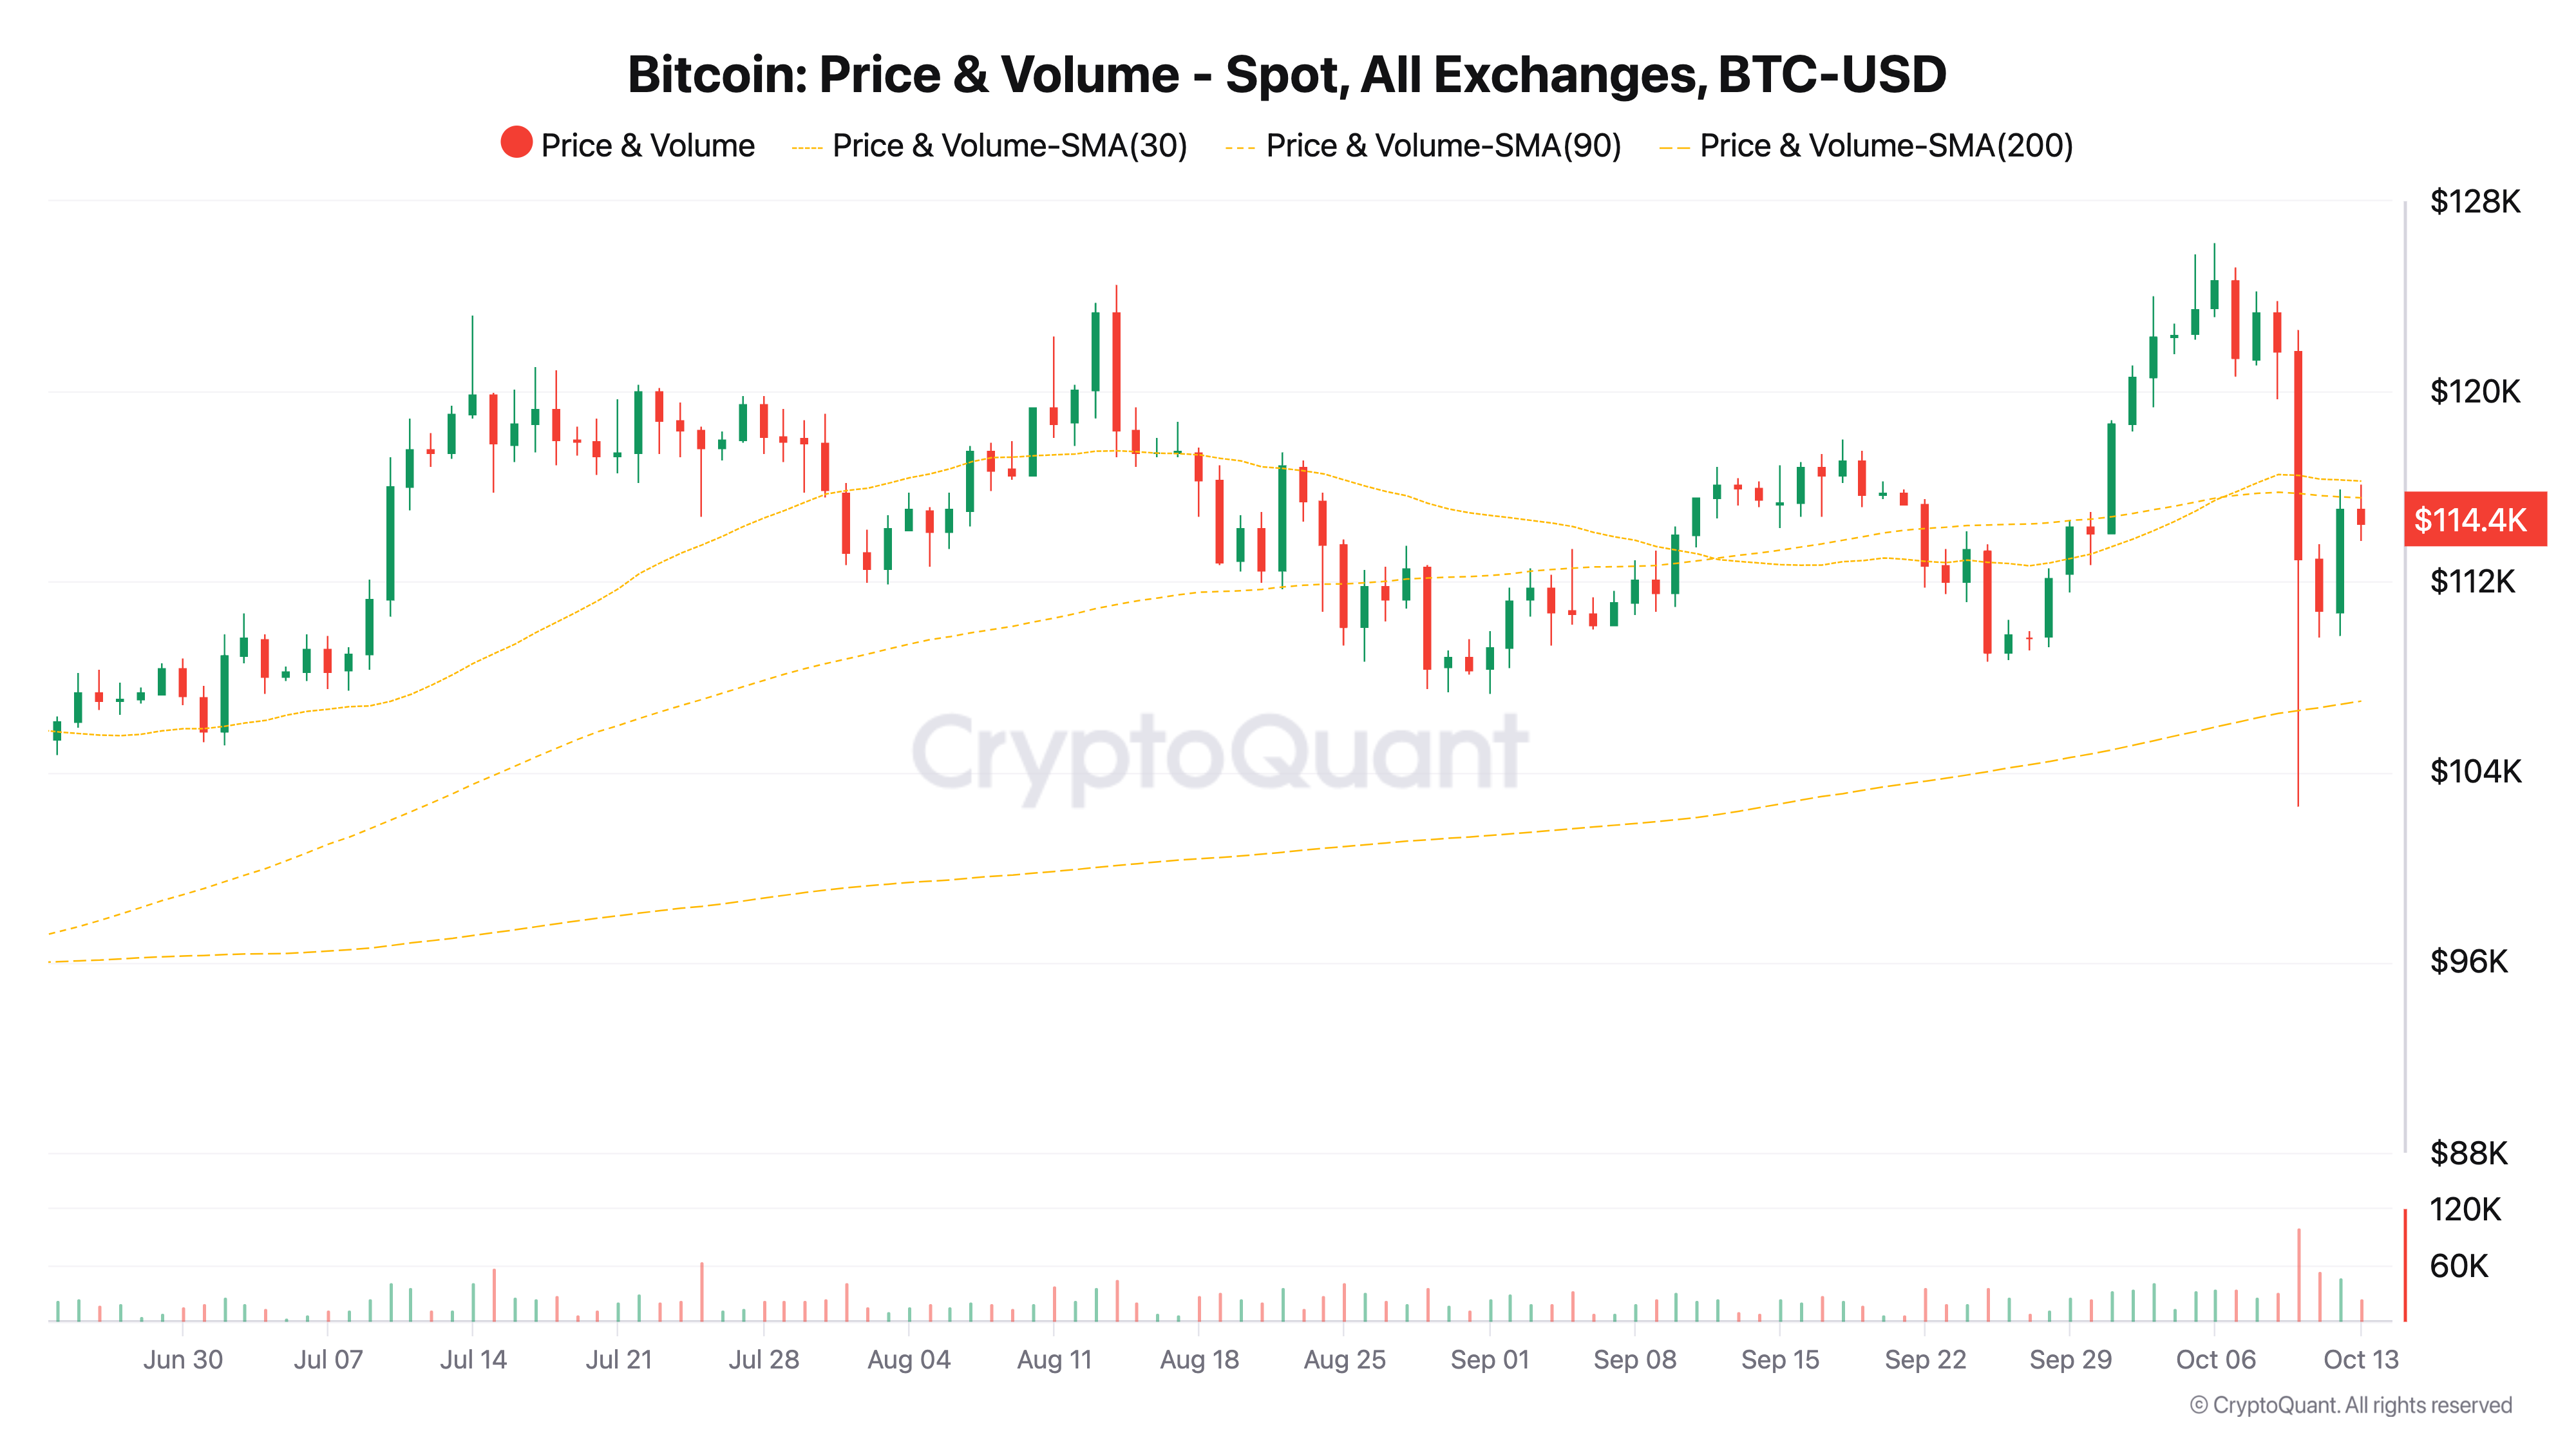 BTC Moving Averages
BTC/USD one-day chart with 30, 90, 200SMA. Source: CryptoQuant
BTC Moving Averages
BTC/USD one-day chart with 30, 90, 200SMA. Source: CryptoQuant
This article is for informational purposes only and does not constitute investment advice.
