
Zcash Soars 520% in a Month: Will the Rally Persist?
Zcash's price has surged dramatically, hinting at potential continued growth despite concerns of a long-term correction.


Key Highlights:
- Zcash’s dramatic 520% increase has pushed the market into overbought territory.
- For ZEC to continue rising toward $336, it must maintain a position above $245.
Zcash (ZEC) has experienced a spectacular ascent of over 520% in just one month, successfully resisting a broader crypto downturn that saw a $20 billion liquidation over the weekend.
The privacy coin is now close to the $300 mark, a level not observed since December 2021, marking it as one of the top performers in the market.
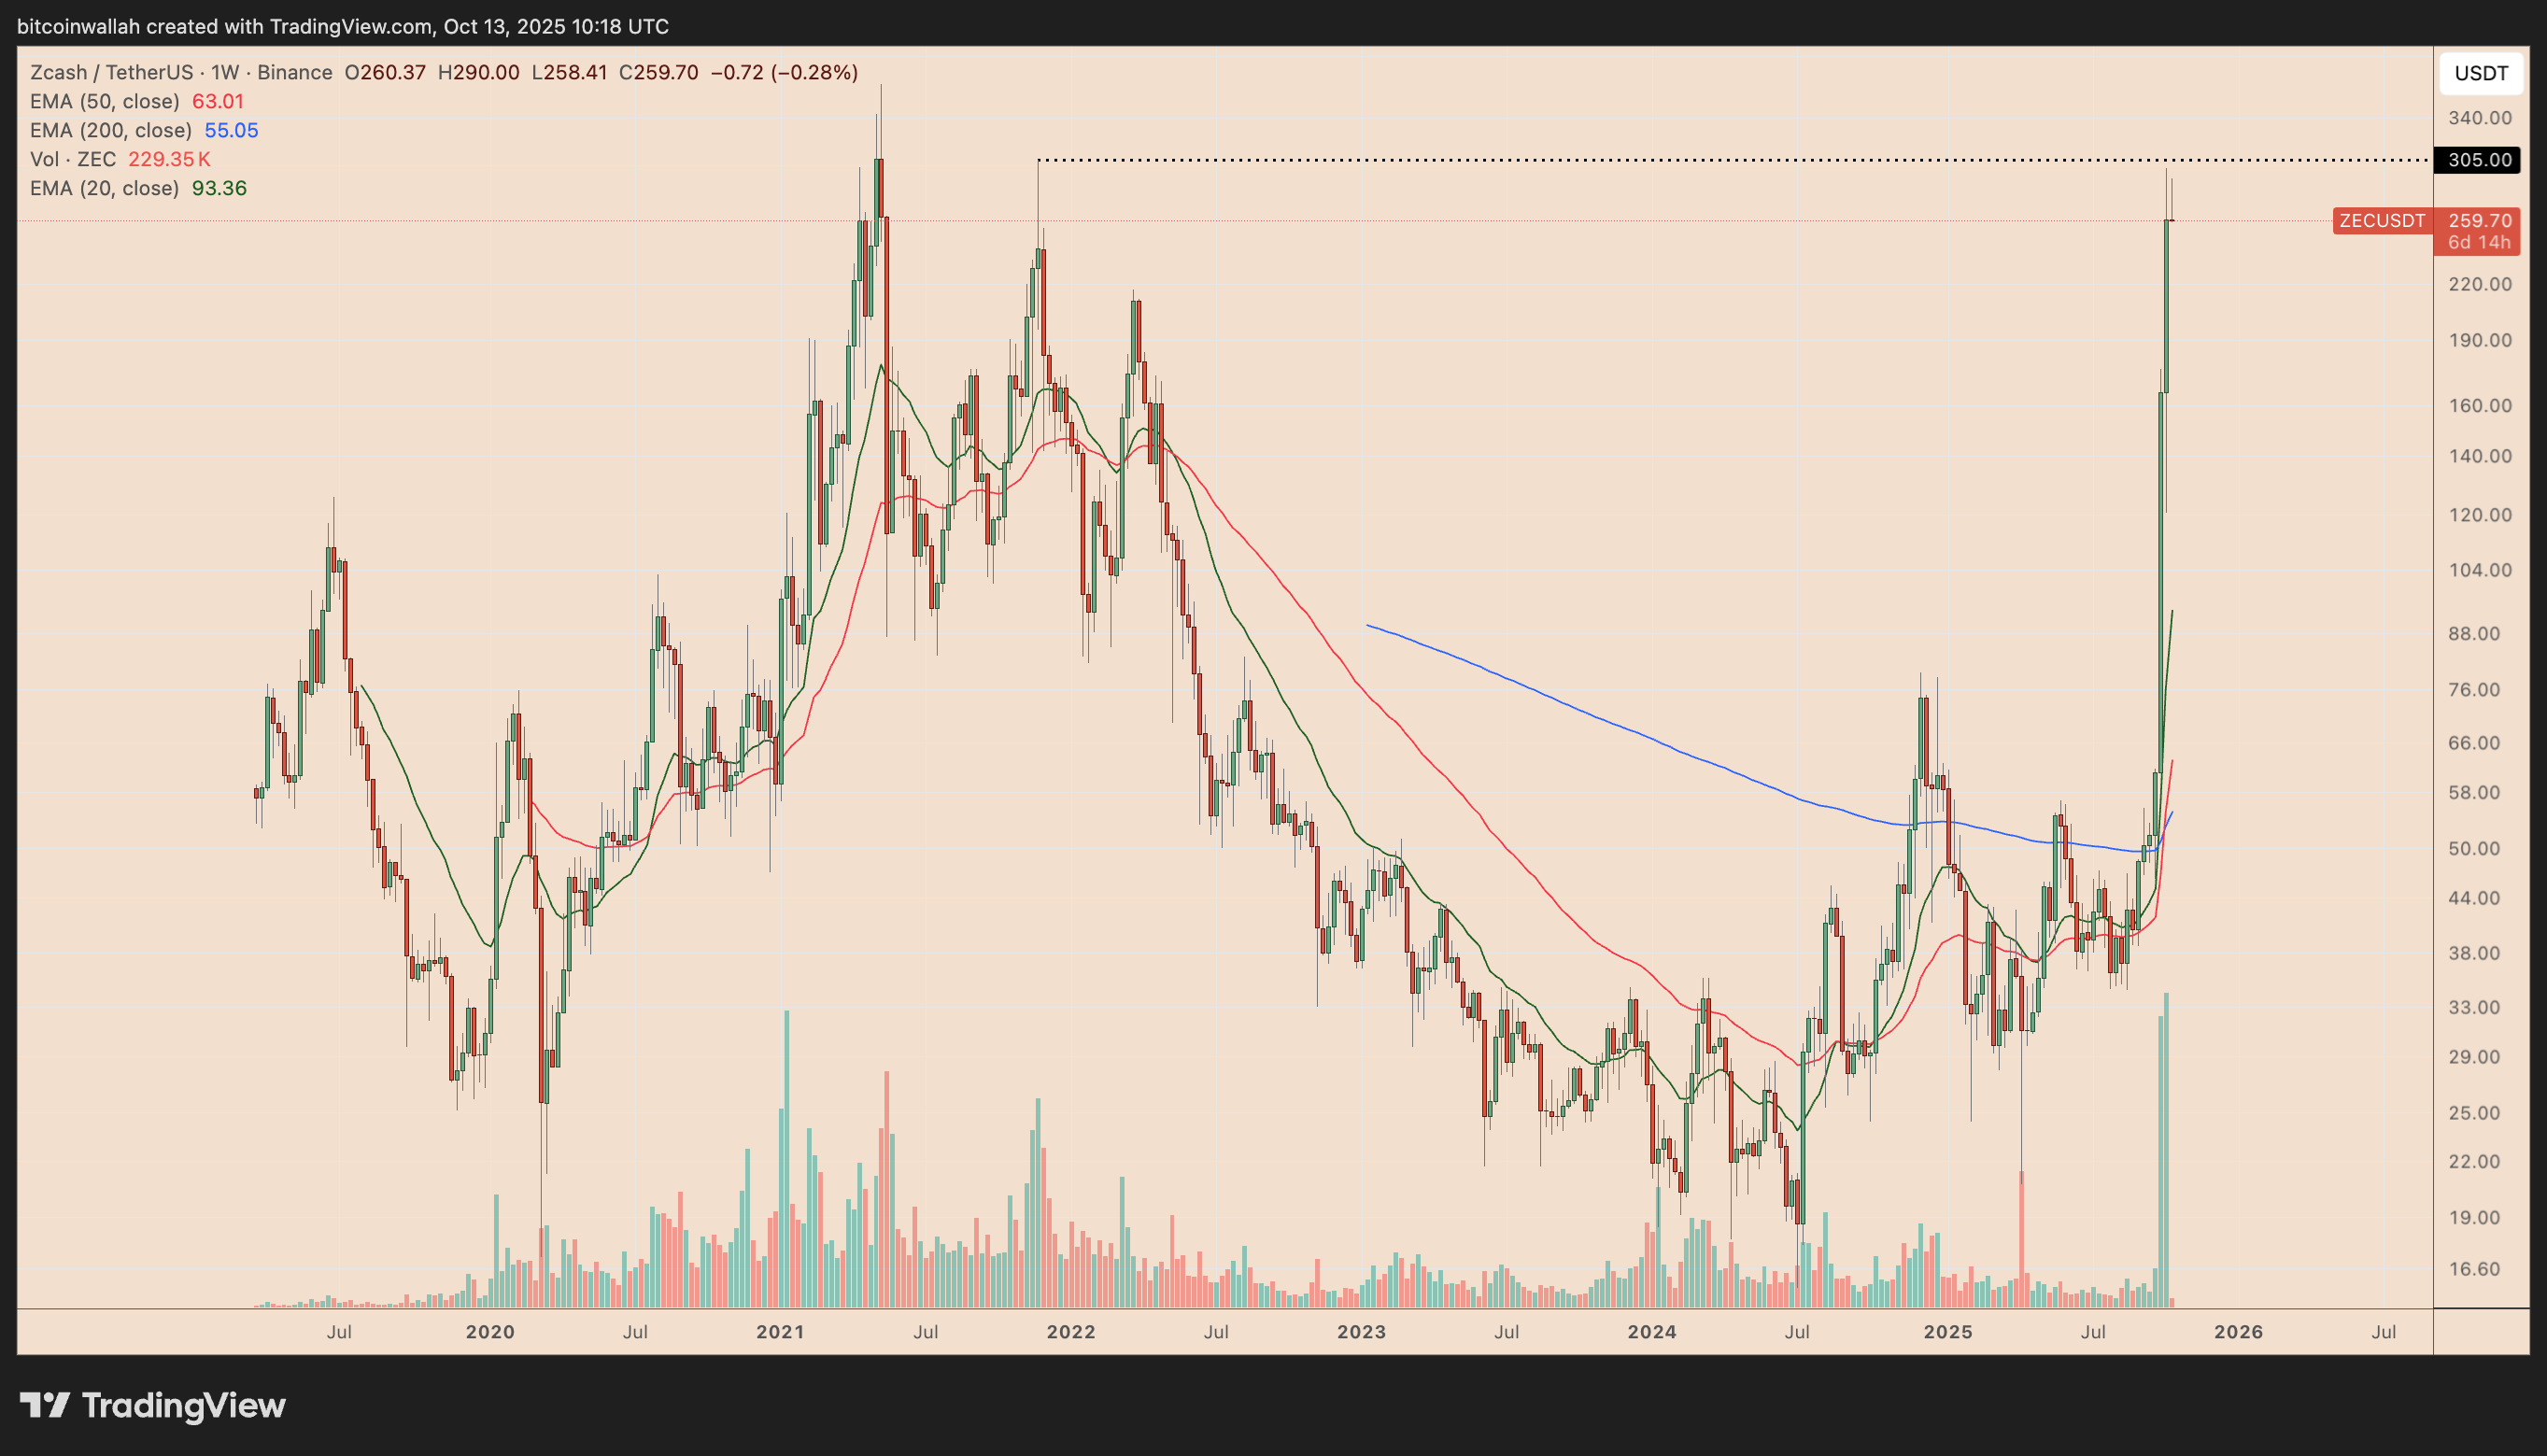 ZEC/USDT weekly price chart. Source: TradingView
Can ZEC’s price increase further, or does it need to cool off?
ZEC Technical Indicators Suggest Another Rally
Zcash’s explosive trend seems to be forming within a classic bull flag pattern, a signal that often leads to additional momentum. Recent candlestick patterns indicate a possible retreat toward the flag’s lower boundary around $237.
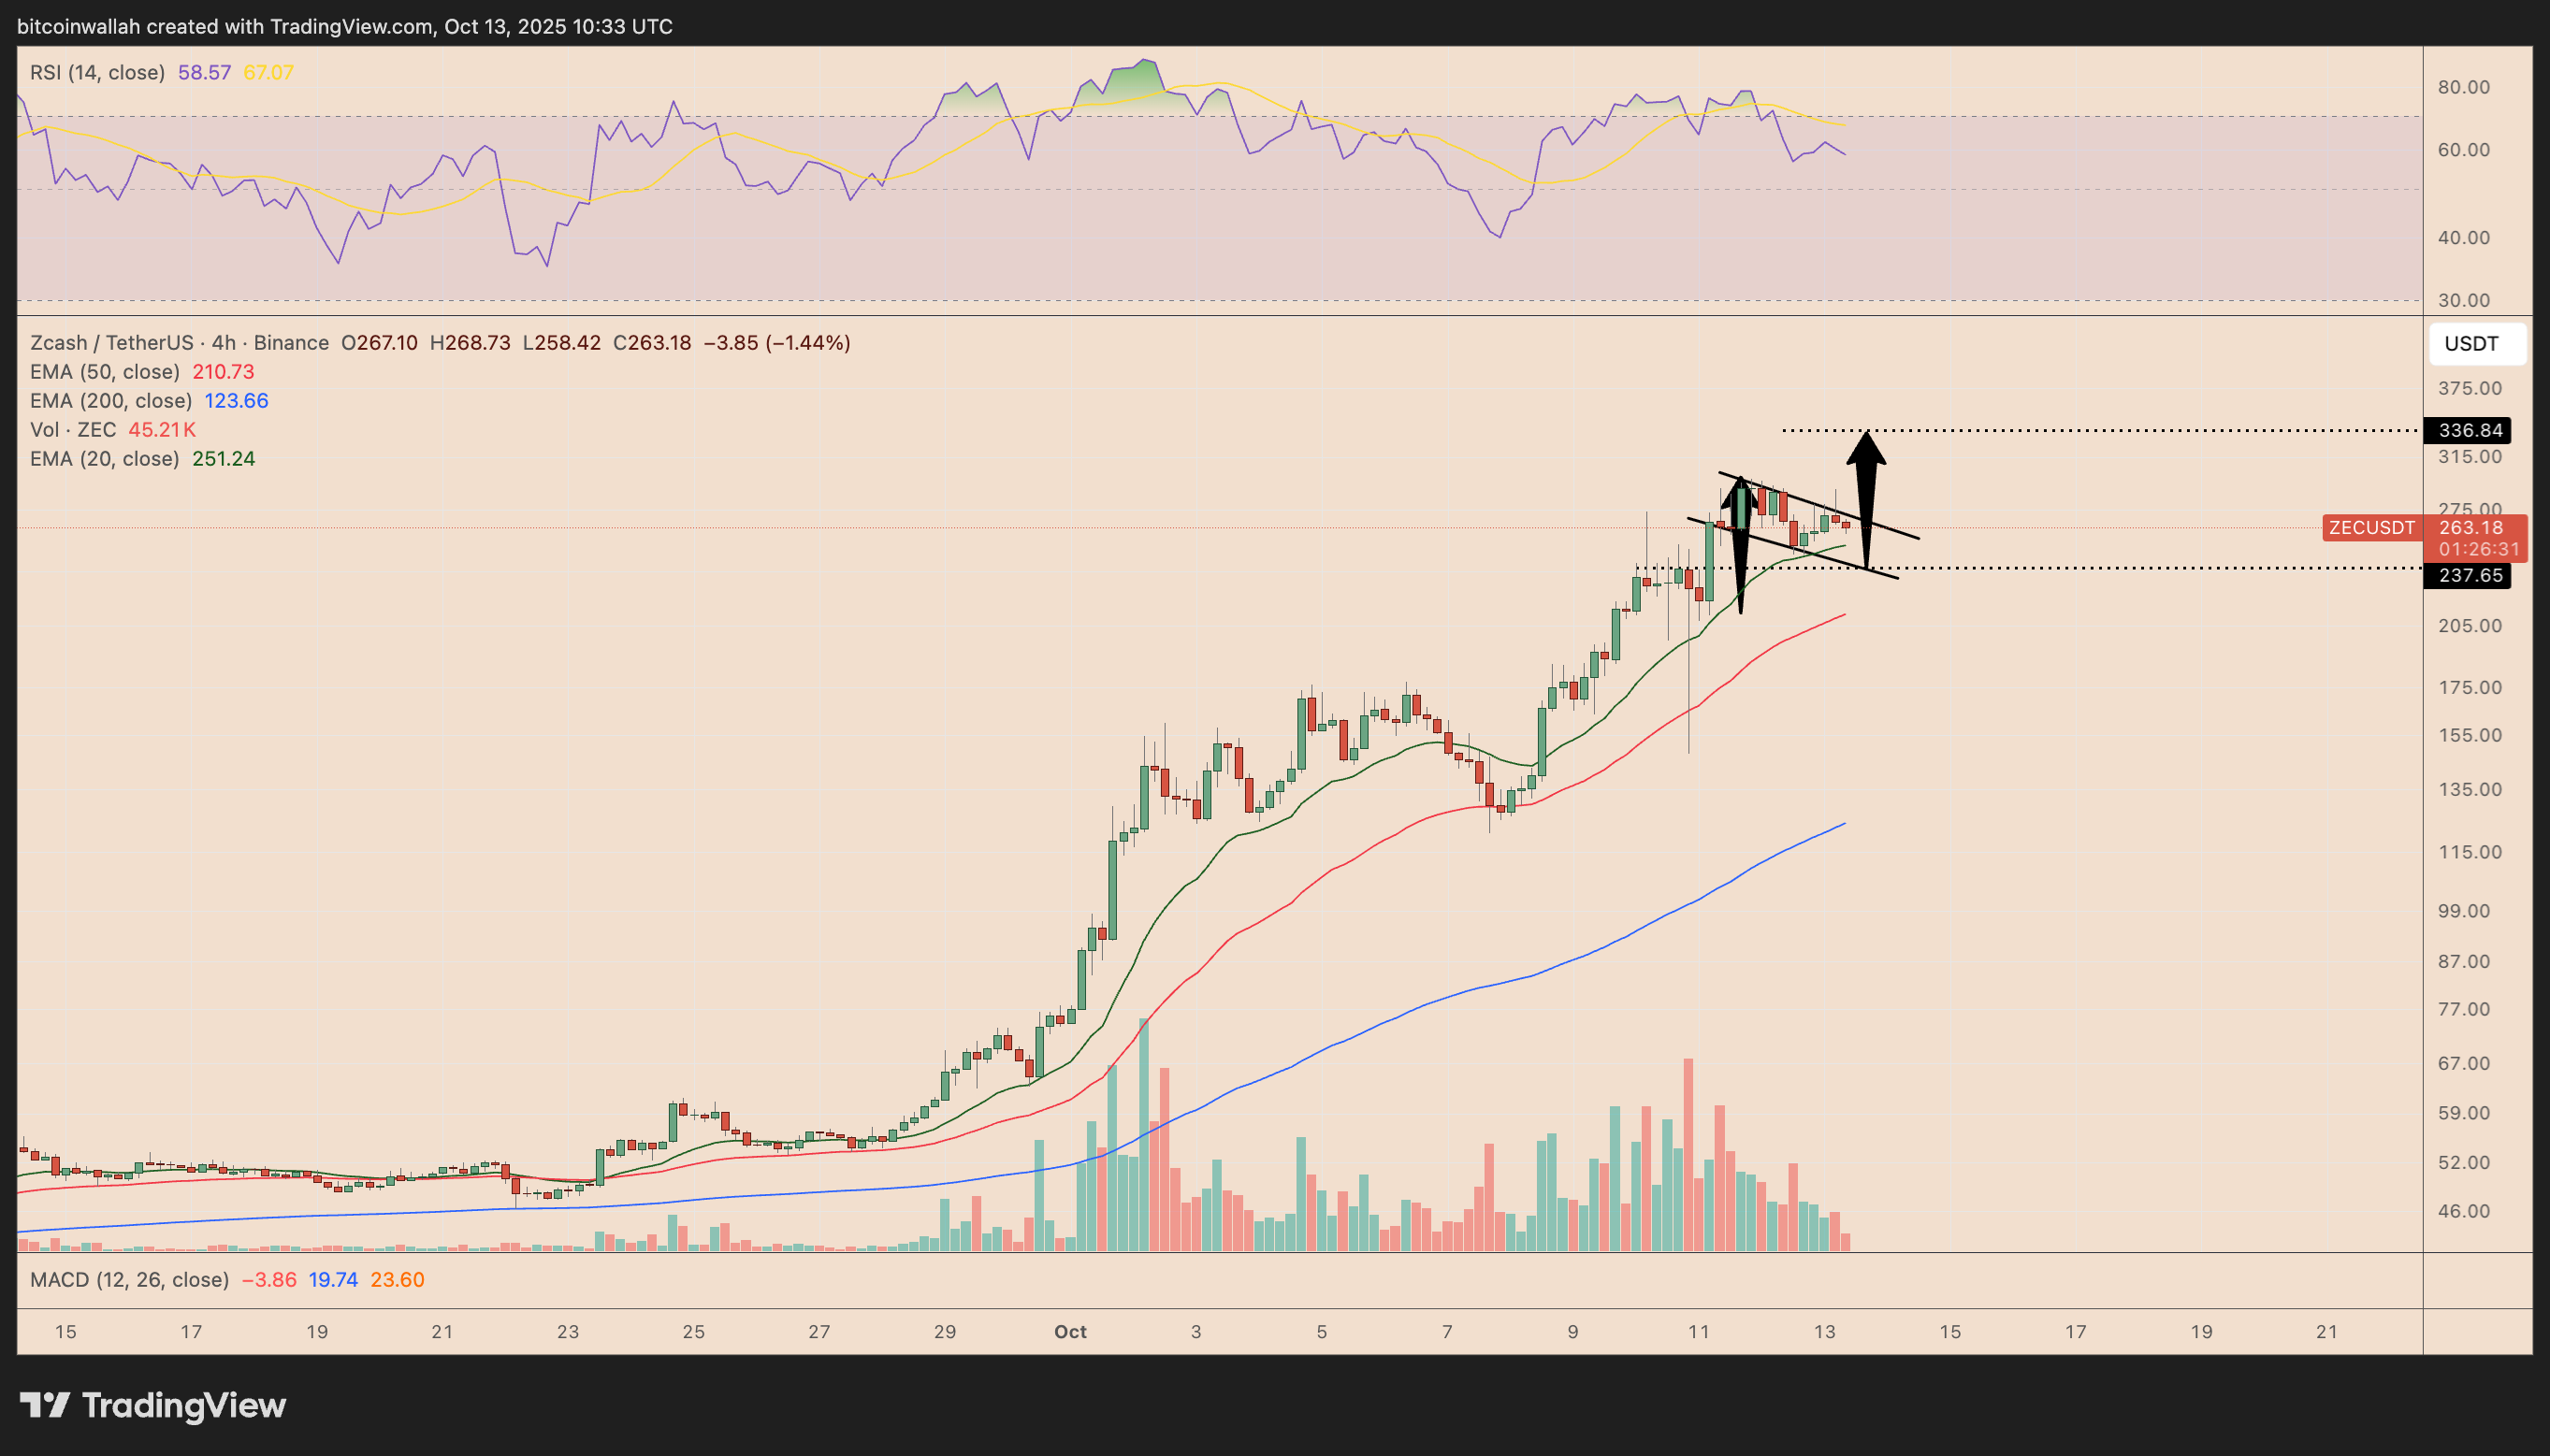 ZEC/USDT four-hour chart. Source: TradingView
If ZEC breaks above this pattern’s upper trendline, it could set a price target near $336 for October, approximately 25% above current levels. This positive trend continues as ZEC maintains healthy consolidation above its moving averages, indicating solid bullish momentum.
Bearish Considerations at $210
If ZEC’s price falls between its supports, particularly the flag’s lower trendline and its 20-period EMA, it may drop to the 50-period EMA around $210.75 this month. A significant $5.36 million in long liquidations near $244 poses risks for bulls.
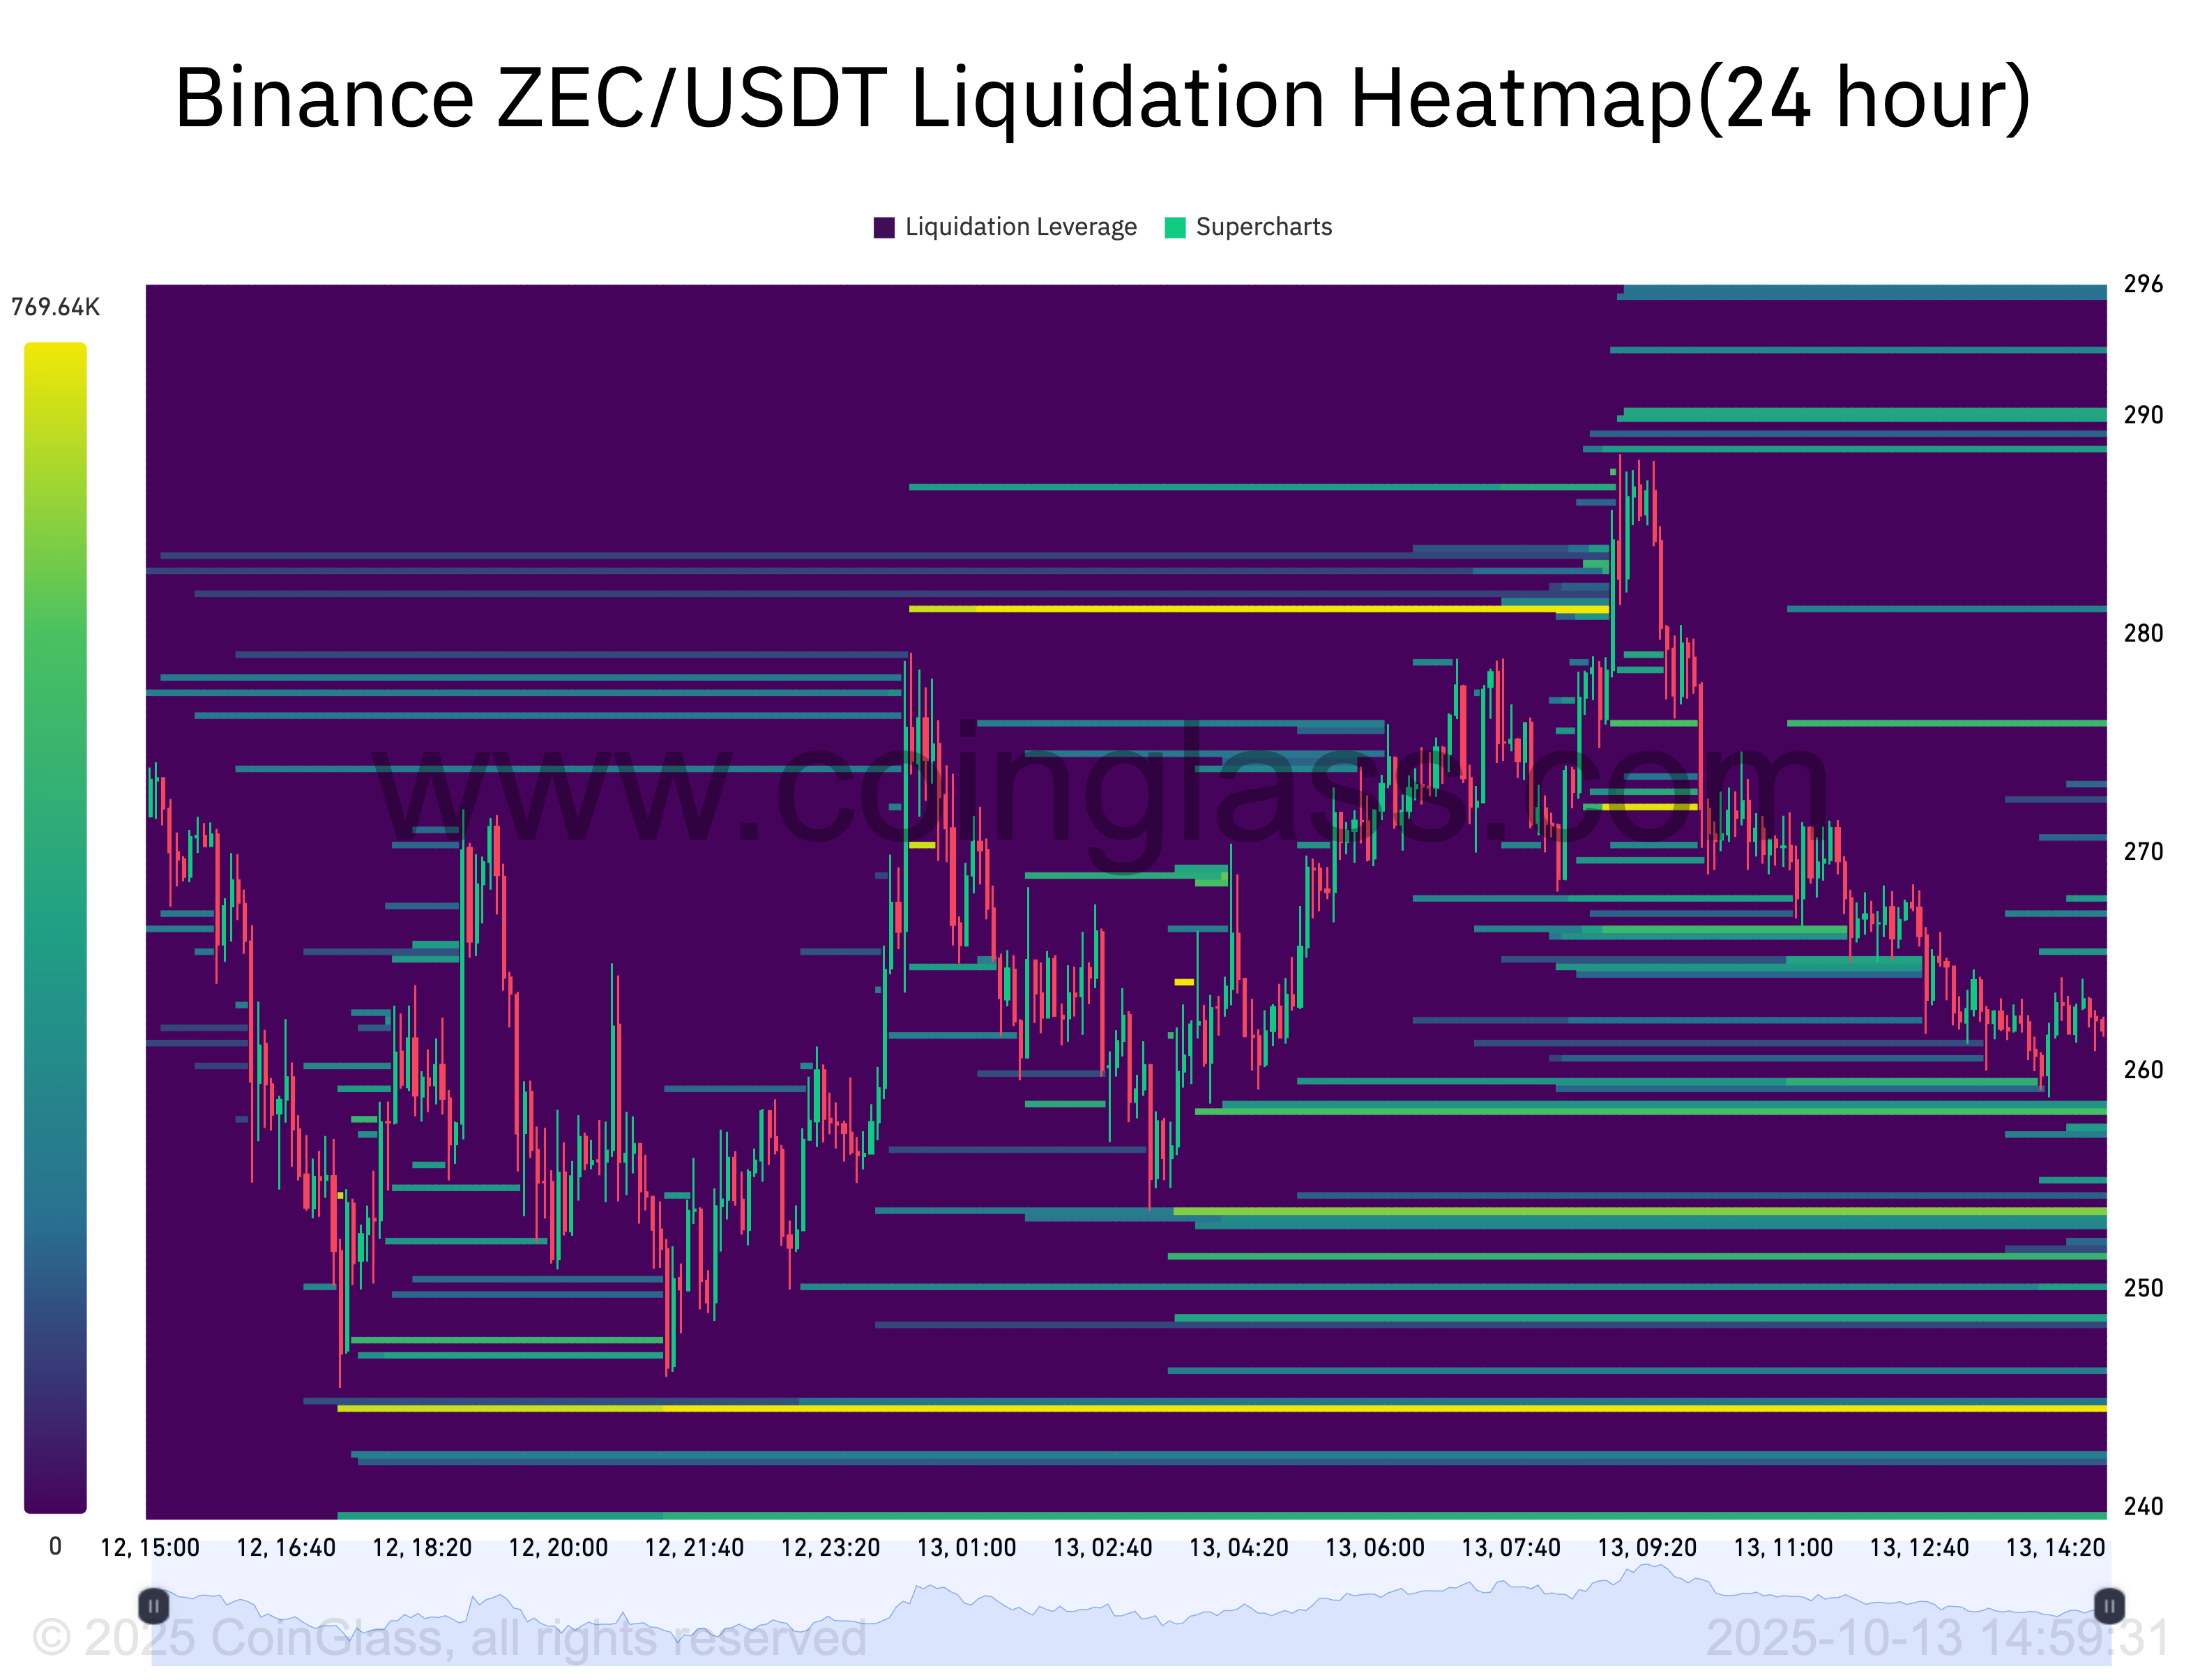 ZEC/USDT liquidation heatmap (24 hours). Source: CoinGlass/Binance
Falling below $244 could trigger further liquidations, leading to a more pronounced drop before a potential recovery.
ZEC Approaches Record Overbought Levels
Currently, Zcash is at historically high overbought levels according to its weekly chart, which could prompt a short-term reversal.
As of Monday, ZEC’s weekly Relative Strength Index (RSI) was above 92, the highest recorded. Previously, the peak was 78 in April 2021, subsequent to which ZEC dropped nearly 70% over the months that followed.
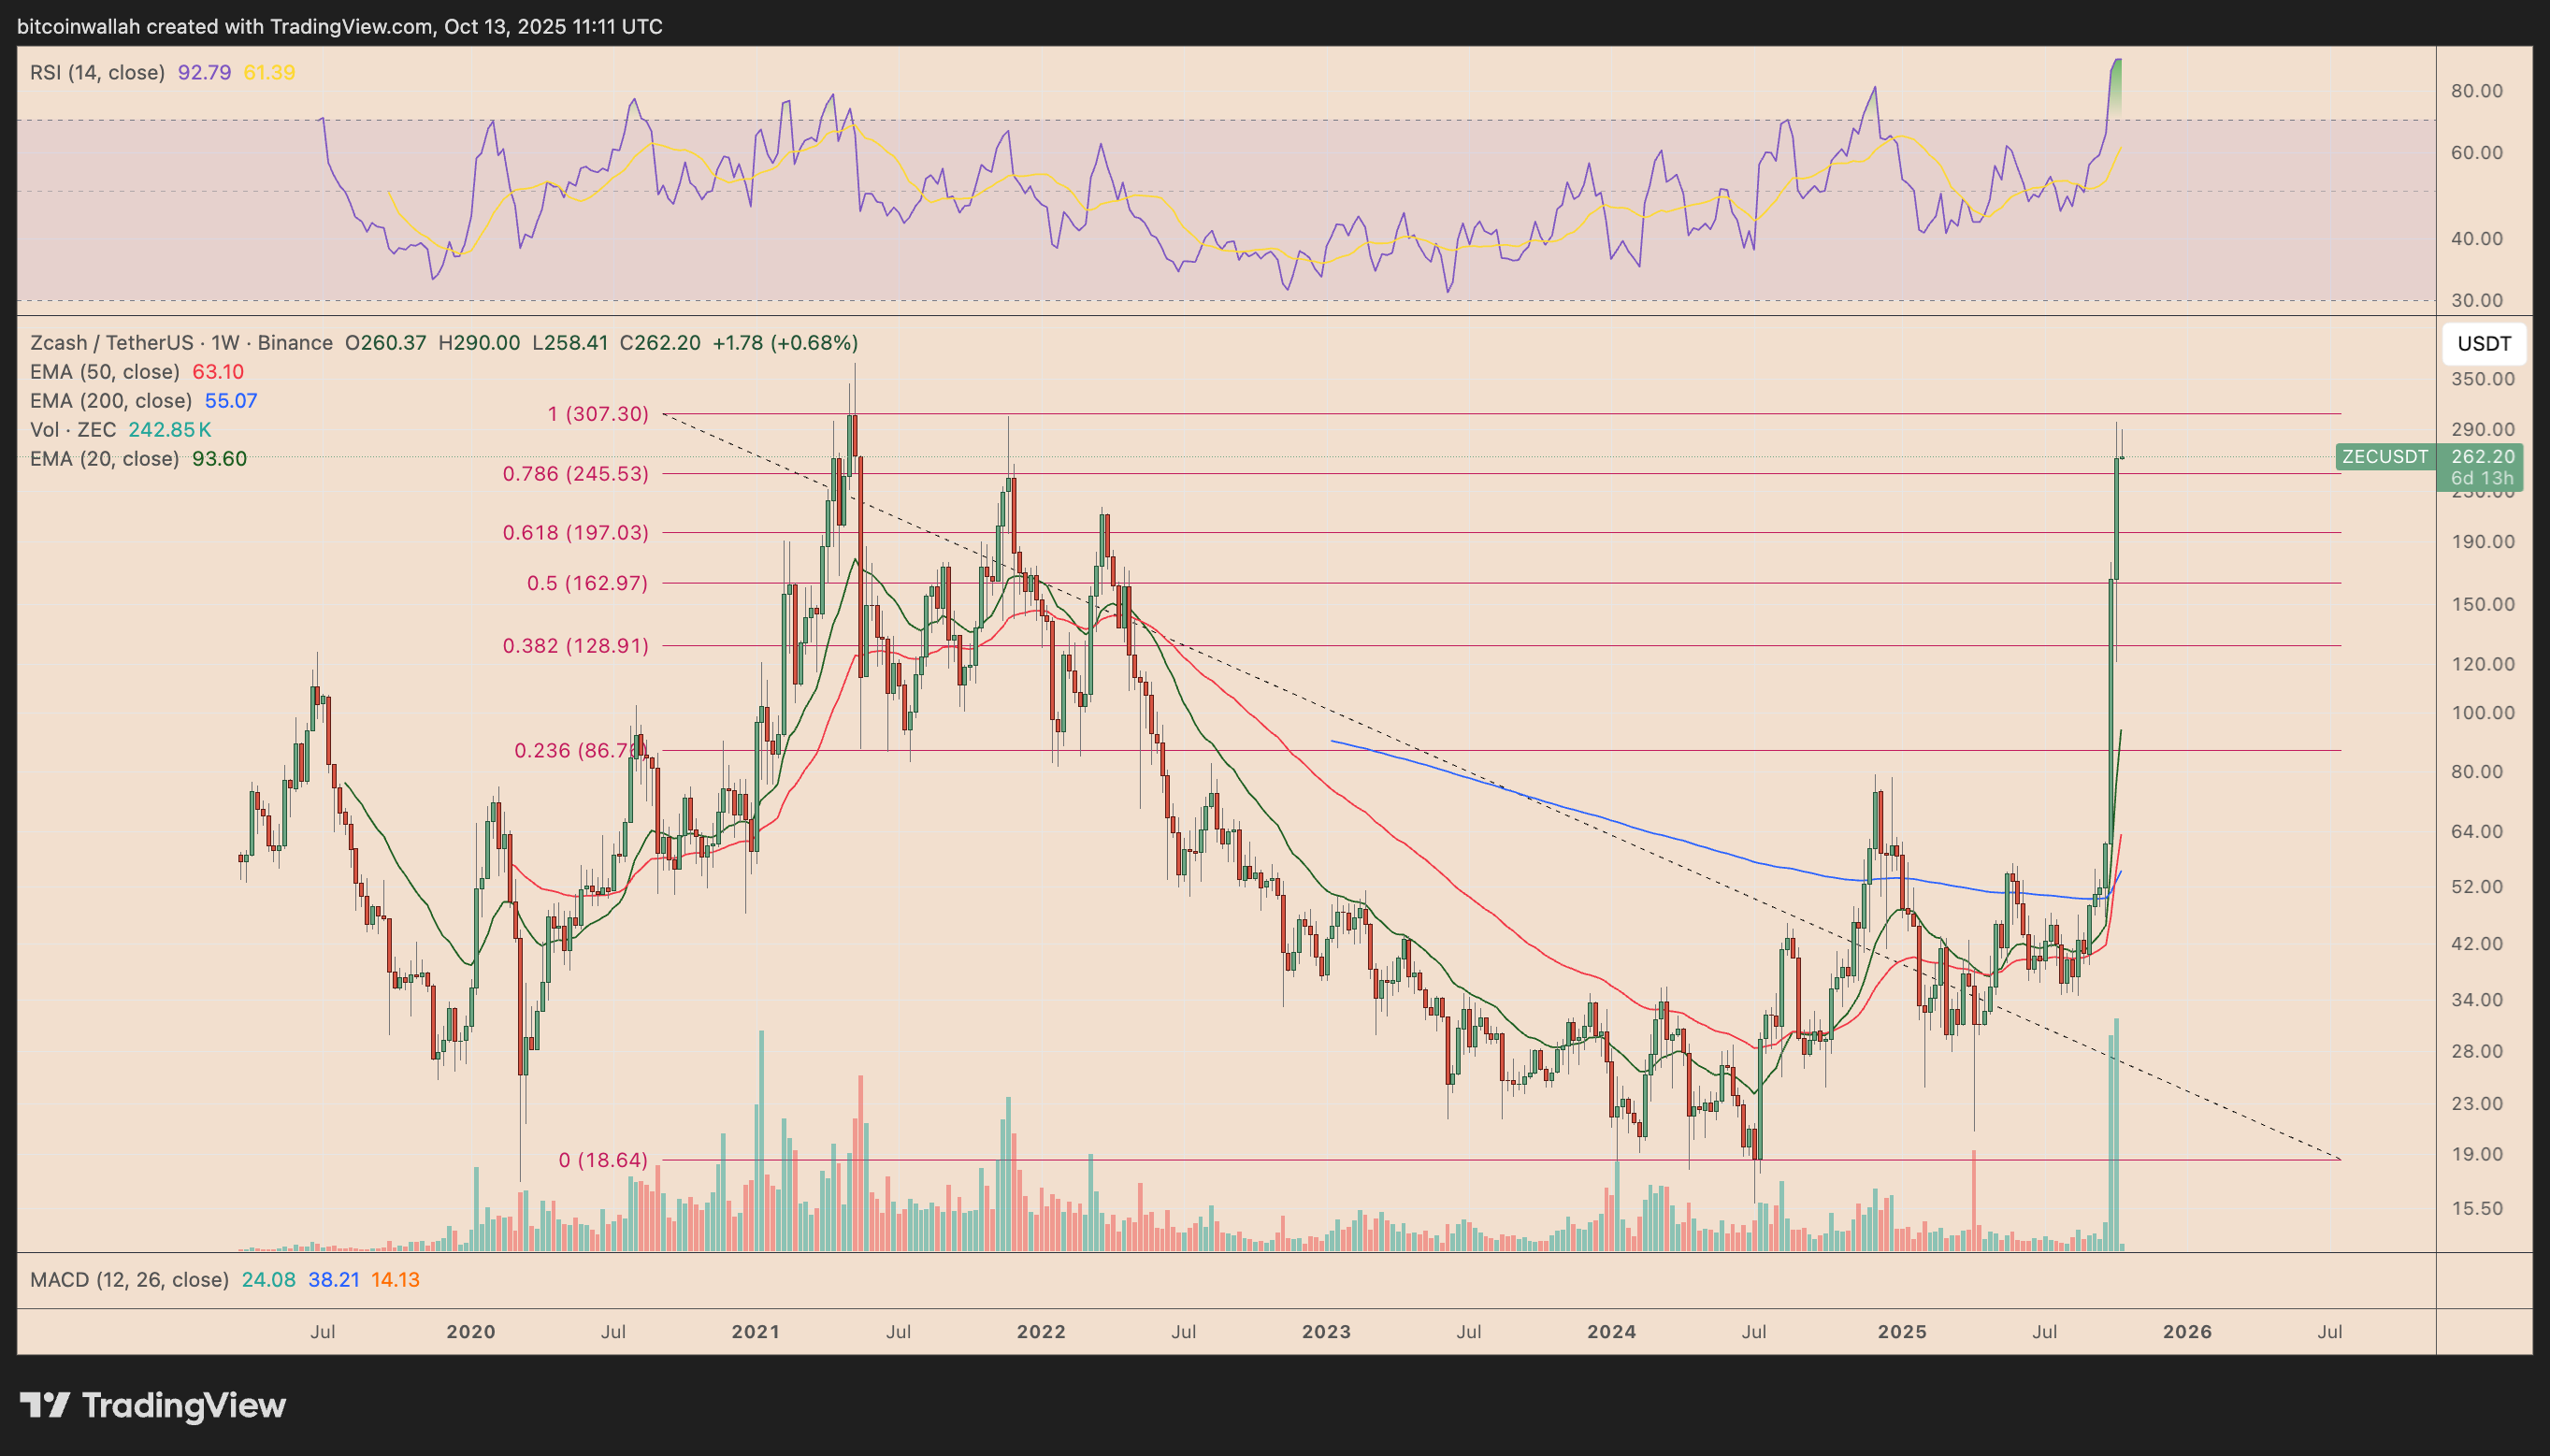 ZEC/USDT weekly chart. Source: TradingView
A similar cooldown may ensue, particularly if it fails to establish support near the Fib retracement at $245. Conversely, bouncing off the $245 level could send prices skyrocketing toward $307 or even retest ZEC’s 2021 peak near $375.
While analyst Altcoin Sherpa has indicated that any dip toward $200 might be a buying opportunity, he added that he is watching for prices around $230 or lower.
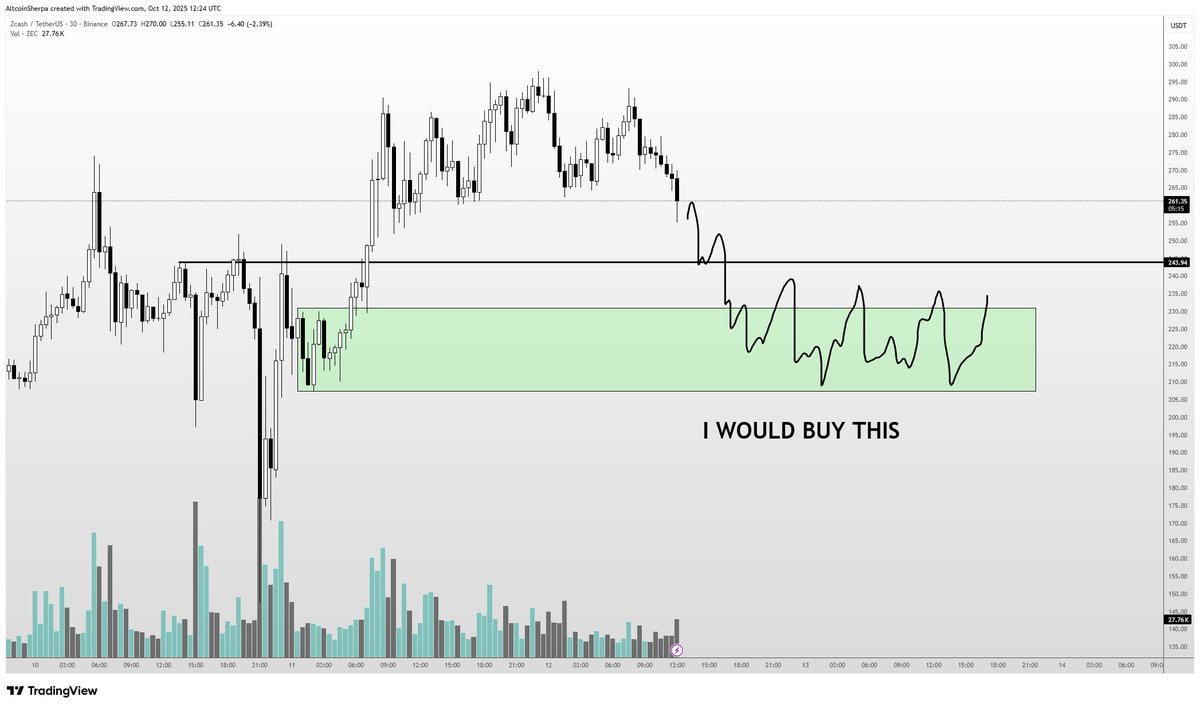 ZEC/USDT three-day chart. Source: Altcoin Sherpa/TradingView
“I’ll be interested if it comes down to $230 or lower,” he stated.
This article does not serve as investment advice. Every financial decision carries risk, and readers should conduct their own research.
