Bitcoin Price Analysis: Is BTC Fully Recovered After the Recent Decline?
An analysis of Bitcoin's price behavior post-recent downturn, exploring crucial support and resistance levels.


Bitcoin’s recent drop has settled into a phase of consolidation, with prices fluctuating within established ranges. Overall, the market seems to be cooling down following a sharp correction after a rally, although the recent decline to the 100-day moving average raises some short-term concerns.
BTC Price Technical Analysis
By Shayan
Daily Overview
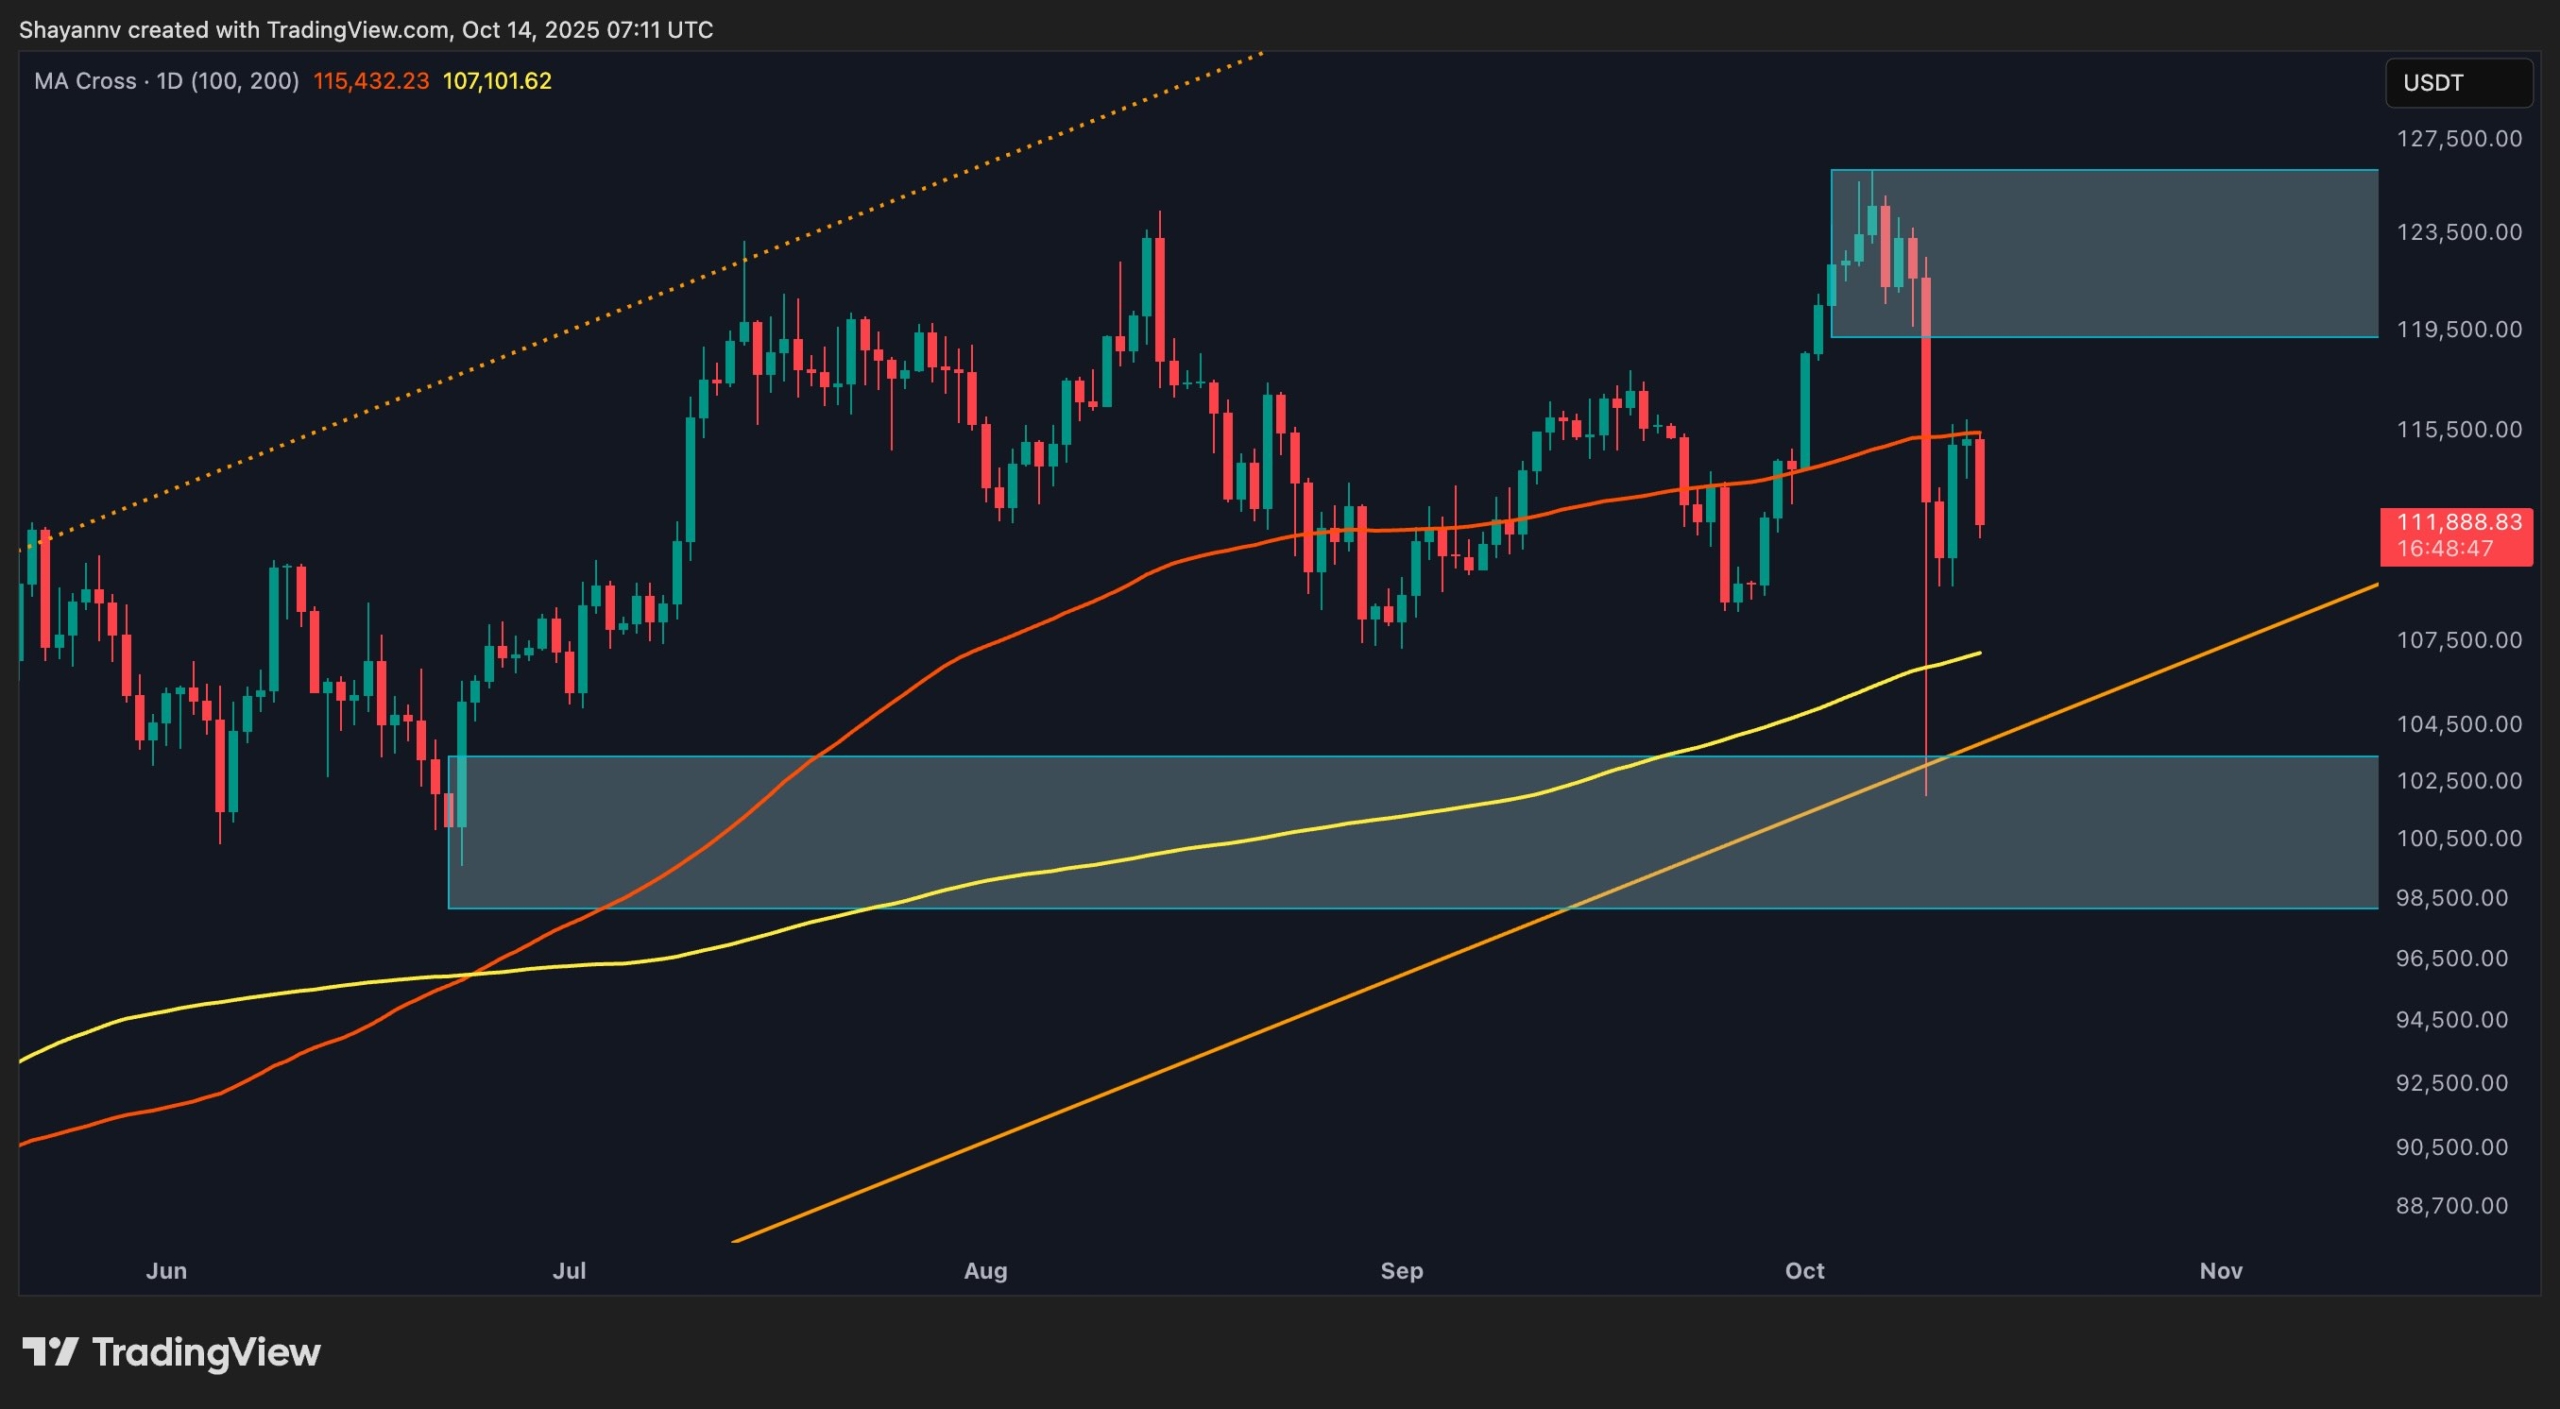
Currently, Bitcoin (BTC) has retraced to test the 100-day moving average around the $116K zone, where it is showing signs of temporary stabilization after last week’s drop. This area is a significant midpoint of the local structure, protecting the $107K–$109K demand zone, which remains vital for market defense.
A rejection from the supply zone of $124K–$125K triggered a liquidity sweep at previous high points, followed by a steep price retracement. Although this correction was sharp, the market structure hasn’t completely broken down yet; the $108K level continues to serve as static support, with the 200-day moving average at approximately $107K offering extra confluence.
Currently, Bitcoin appears contained between two moving averages, suggesting a period of consolidation. A persistent hold above the 100-day moving average could indicate a stabilization phase, potentially setting the ground for a gradual recovery. Conversely, falling below this threshold might lead to further declines towards the $104K–$102K macro support level.
 Daily Chart
4-Hour Chart
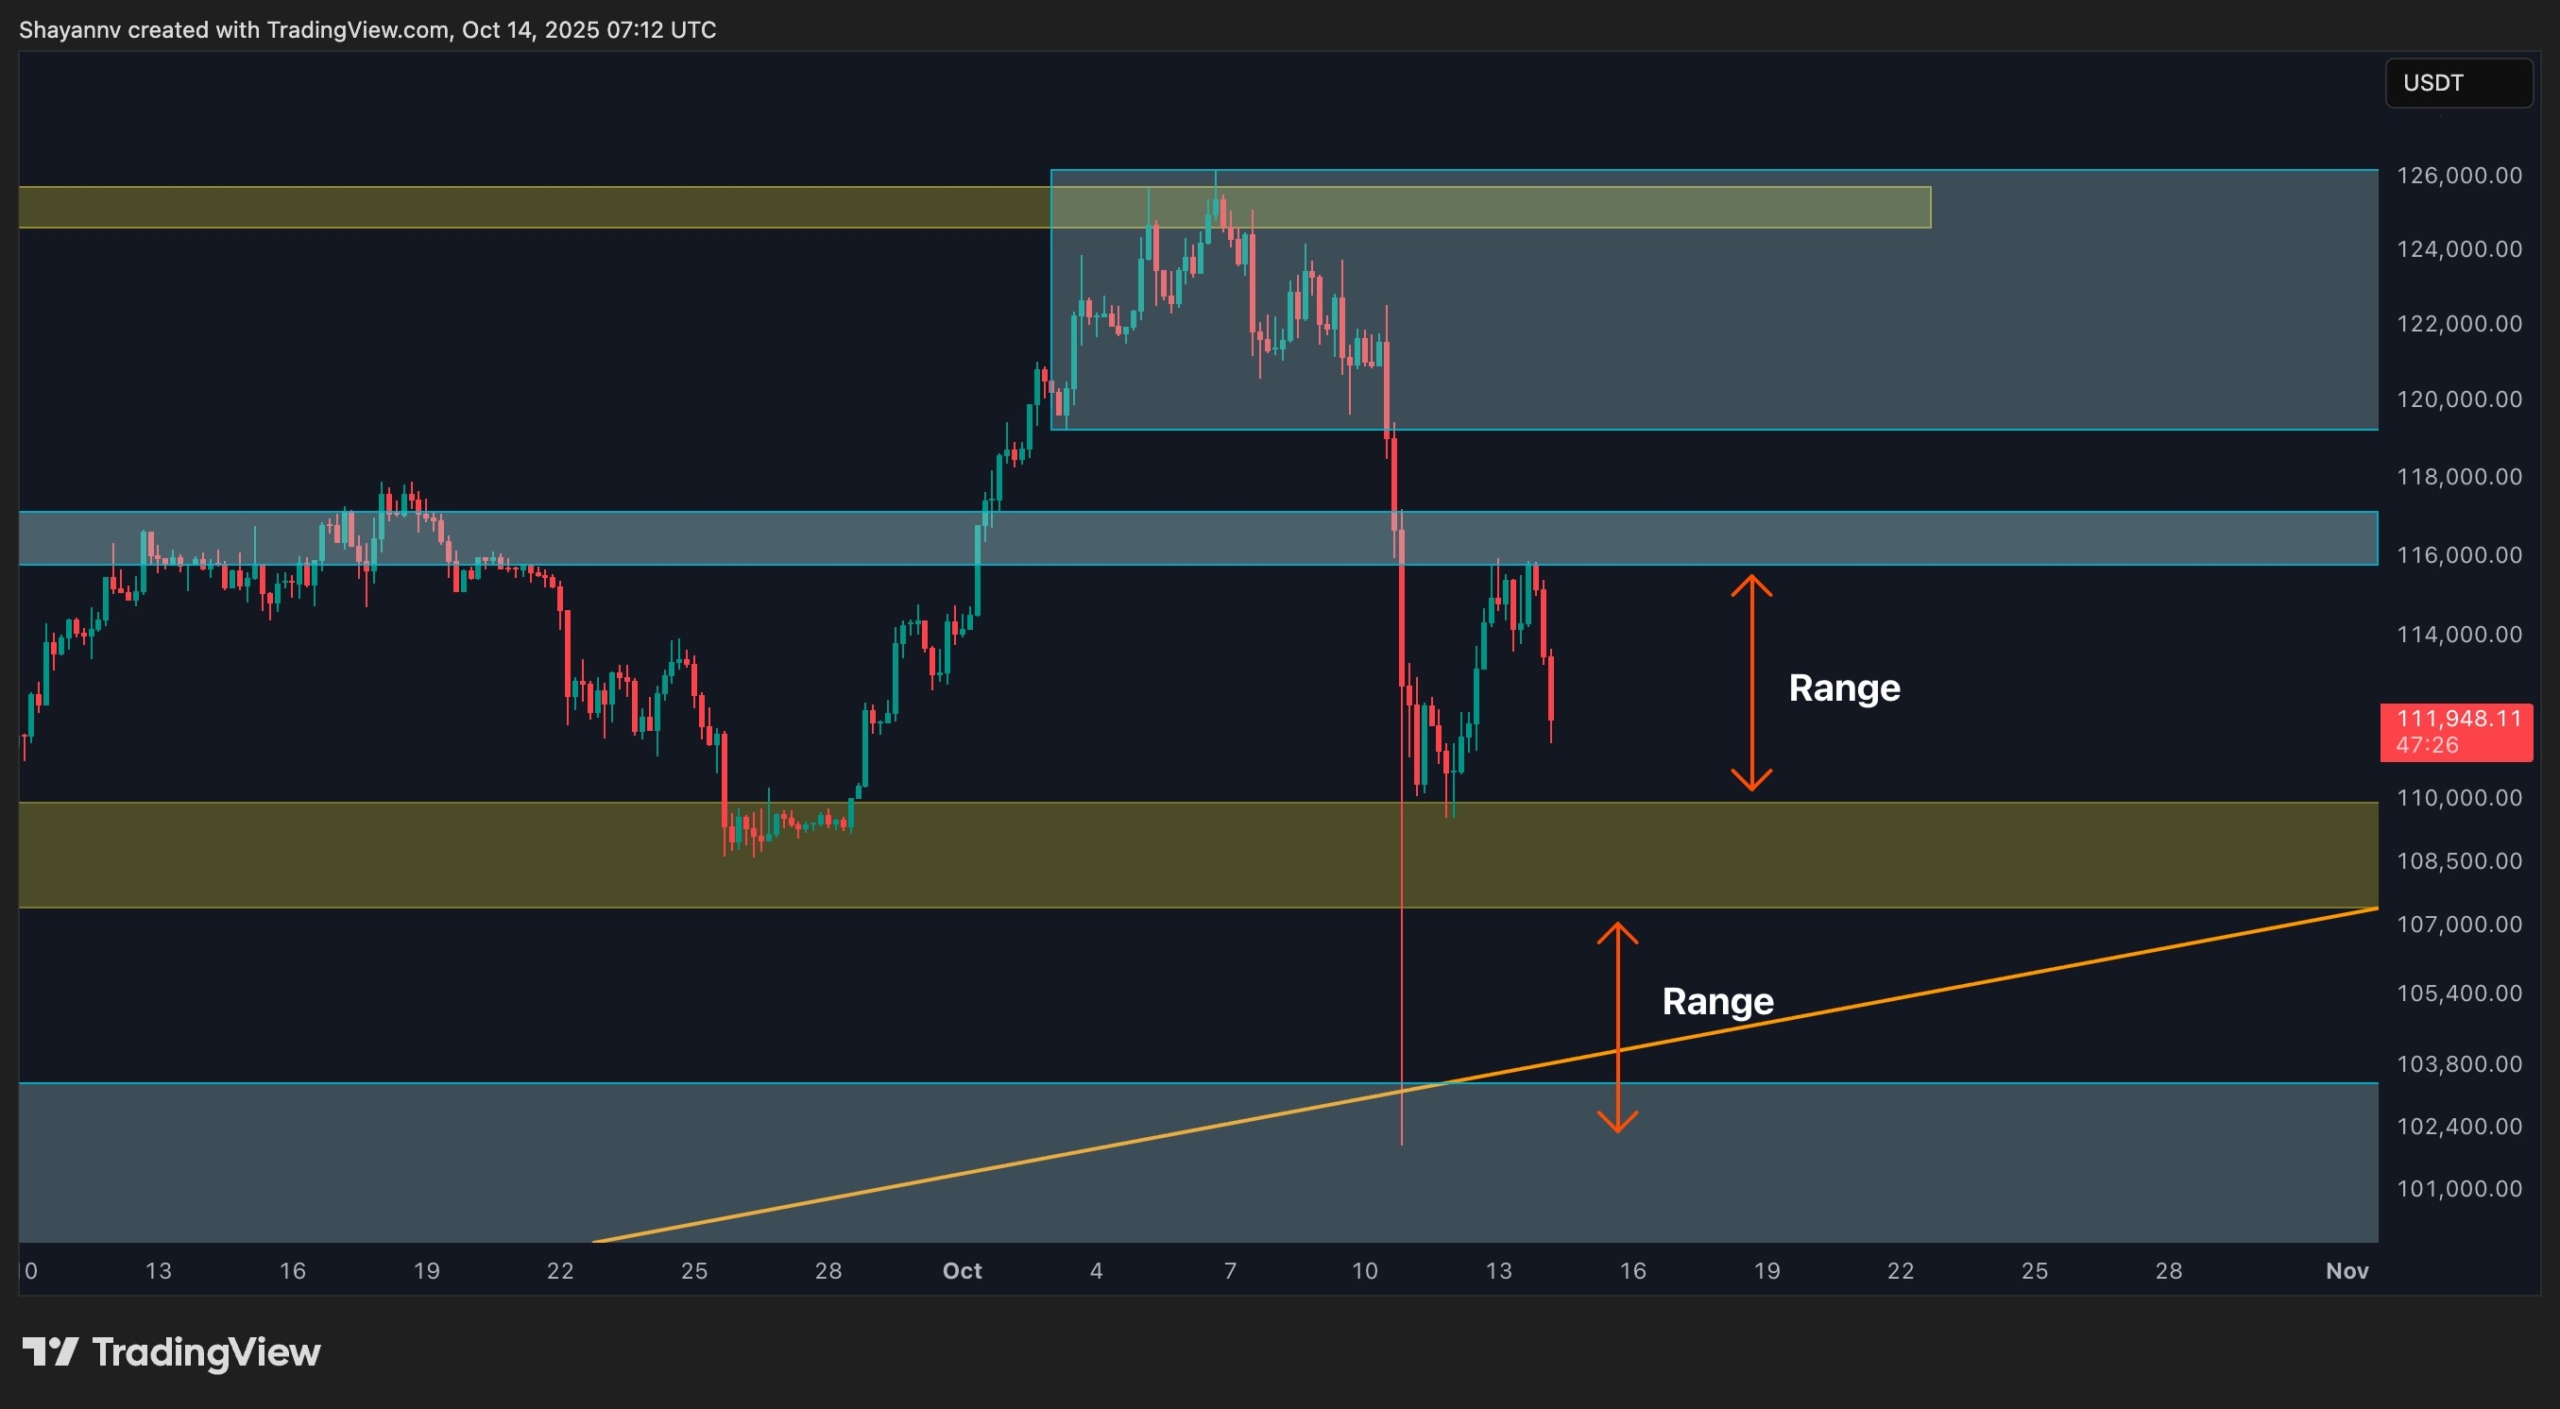
In the 4-hour timeframe, Bitcoin is navigating within a well-defined horizontal range, trapped between mid-range resistance at $116K and local support around $109K. The latest rejection at $116K marks the ceiling of this consolidation phase, while the lower boundary correlates with previous breakout support during the last upward momentum.
Repeated bounces from the $109K–$110K zone indicate that there are active buyers present, albeit momentum remains lackluster. A confirmed close above $116K could lead to a short-term breakout towards $120K, while dropping below $108K would likely sway sentiment to bearish, aiming for the liquidity zones at $102K–$104K.
 4-Hour Chart
On-chain Analysis
By Shayan
According to the 3-day Binance liquidation heatmap, a dense liquidity pocket exists between $115K and $118K, positioned just above the current market price. Significantly, this area holds short liquidations, indicating that if Bitcoin reclaims the midpoint, a swift price movement to absorb this liquidity could follow.
Conversely, the downside liquidity appears to have been cleared last week in the $108K–$110K range, suggesting minimal resistance below current levels. This situation reinforces the notion that Bitcoin may continue oscillating within its ongoing consolidation until either liquidity cluster is decisively activated.
In conclusion, the heatmap illustrates that short-term volatility is likely concentrated around the $109K–$116K corridor, with a liquidity-driven breakout possible once either boundary is challenged.
