
What Happens to Bitcoin Price If Support at $110K Breaks?
Bitcoin faces potential decline to $74,000 if $110,000 support is breached, signaling a deeper evaluation of market trends.


Key Insights:
- Bitcoin may drop to $96,500–$100,000 if the $110,000 support fails.
- Current on-chain and technical indicators suggest a healthy mid-cycle reset instead of a complete trend reversal.
Bitcoin’s recent recovery following a significant drop over the weekend exhibited signs of losing momentum as it dipped 4.65% to around $110,000. This decline mirrored a global equity market downturn triggered by China’s restrictions on five U.S. companies linked to a major South Korean shipbuilder, with warnings of further retaliatory actions.
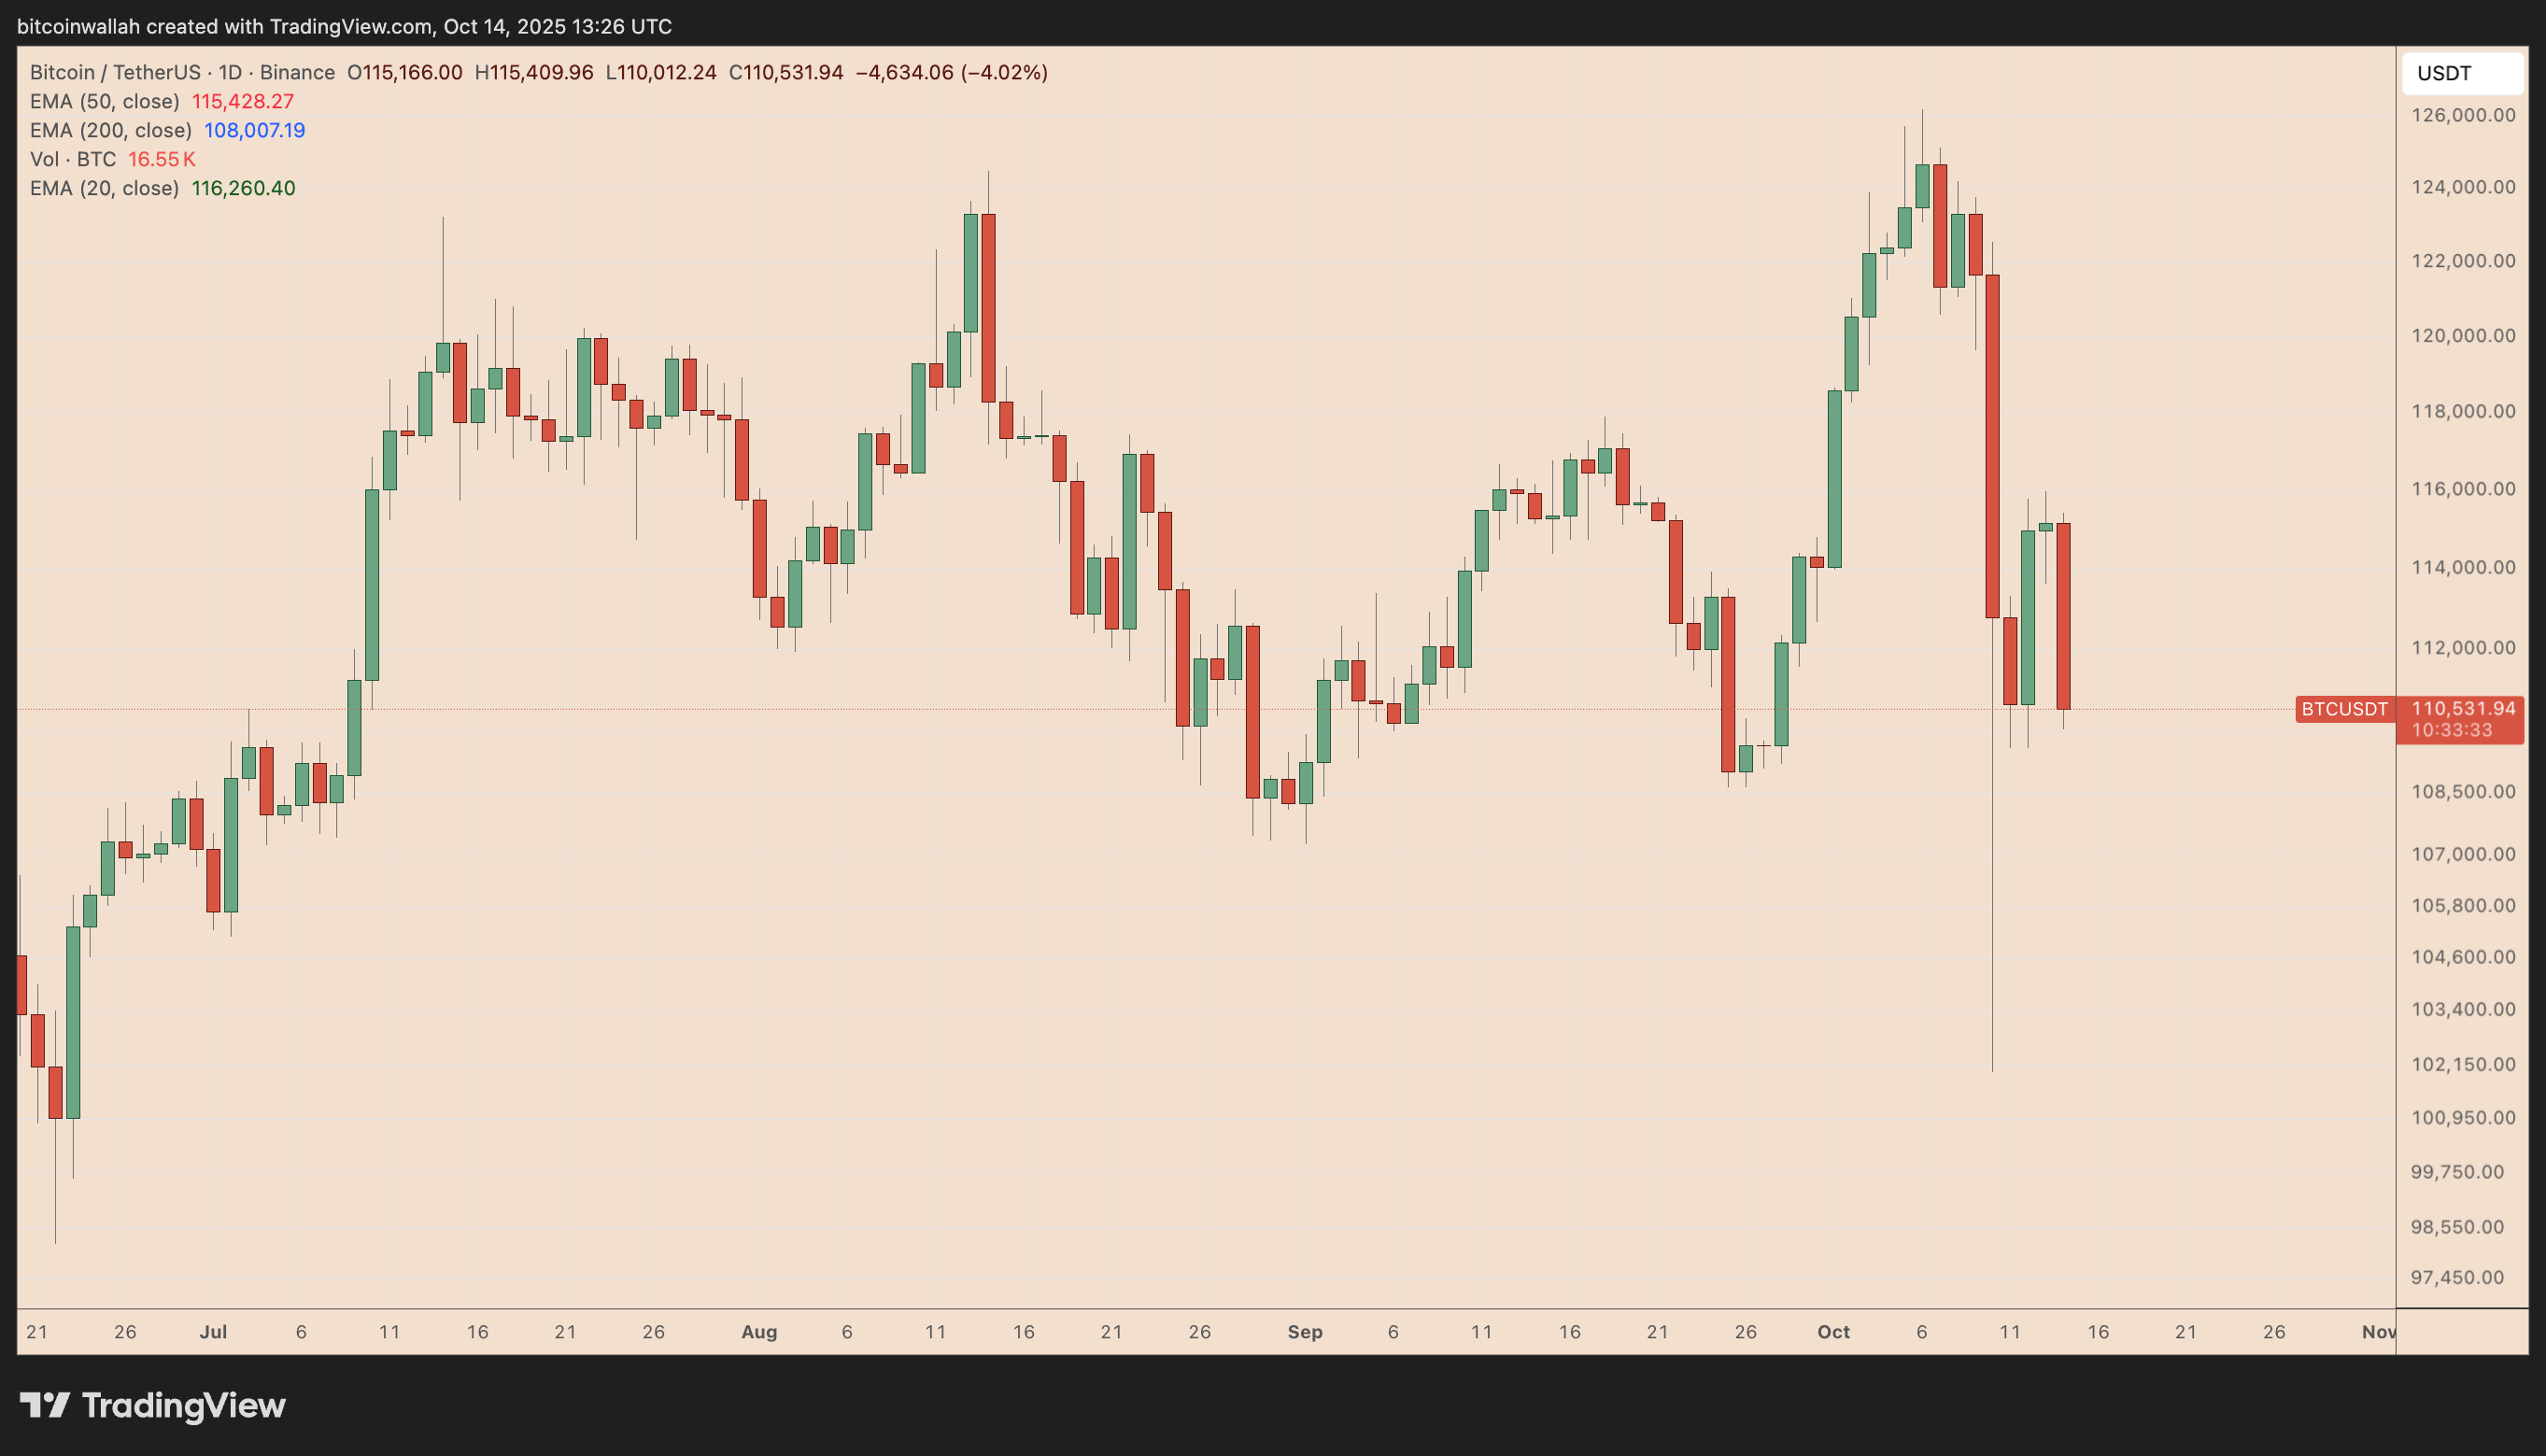 BTC/USD Daily Chart
BTC/USD daily chart. Source: TradingView.com
BTC/USD Daily Chart
BTC/USD daily chart. Source: TradingView.com
Historically, Bitcoin has fluctuated between resistance and support at the $110,000 mark in 2025. Prior dips led to drops of 19%–30%, while rebounds from this level spurred rallies of 12%–15%. Let’s explore the implications if the $110,000 support fails.
Bitcoin’s Broadening Wedge Indicates $100,000
Numerous analyses suggest that the likelihood of Bitcoin’s price retreating to $100,000 increases should the $110,000 support level falter. This view is supported by a “giant bullish channel” highlighted by chartist BitBull, plotting Bitcoin’s price movement within a broadening wedge.
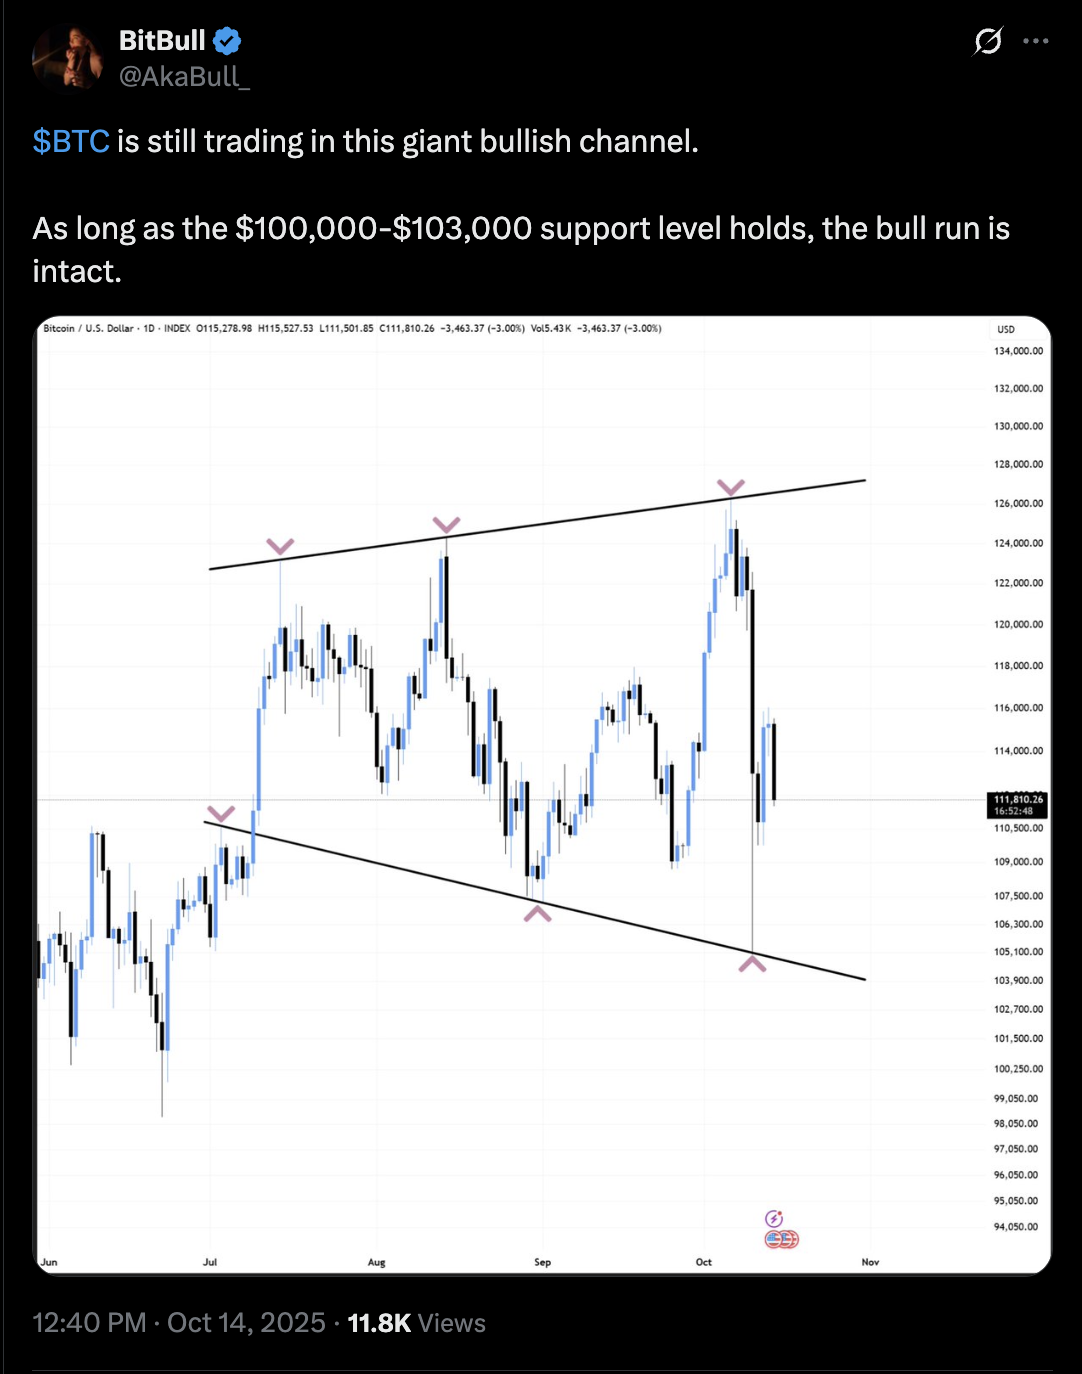 Source: X
As of Tuesday, Bitcoin was undergoing a corrective phase after testing the wedge’s upper trendline as a point of resistance. Historically, corrections have often tapered off near the lower trendline of the channel, which aligns with the $100,000-$103,000 zone.
Source: X
As of Tuesday, Bitcoin was undergoing a corrective phase after testing the wedge’s upper trendline as a point of resistance. Historically, corrections have often tapered off near the lower trendline of the channel, which aligns with the $100,000-$103,000 zone.
This area also coincides with Bitcoin’s 50-week exponential moving average, reinforcing its significance as a potential target.
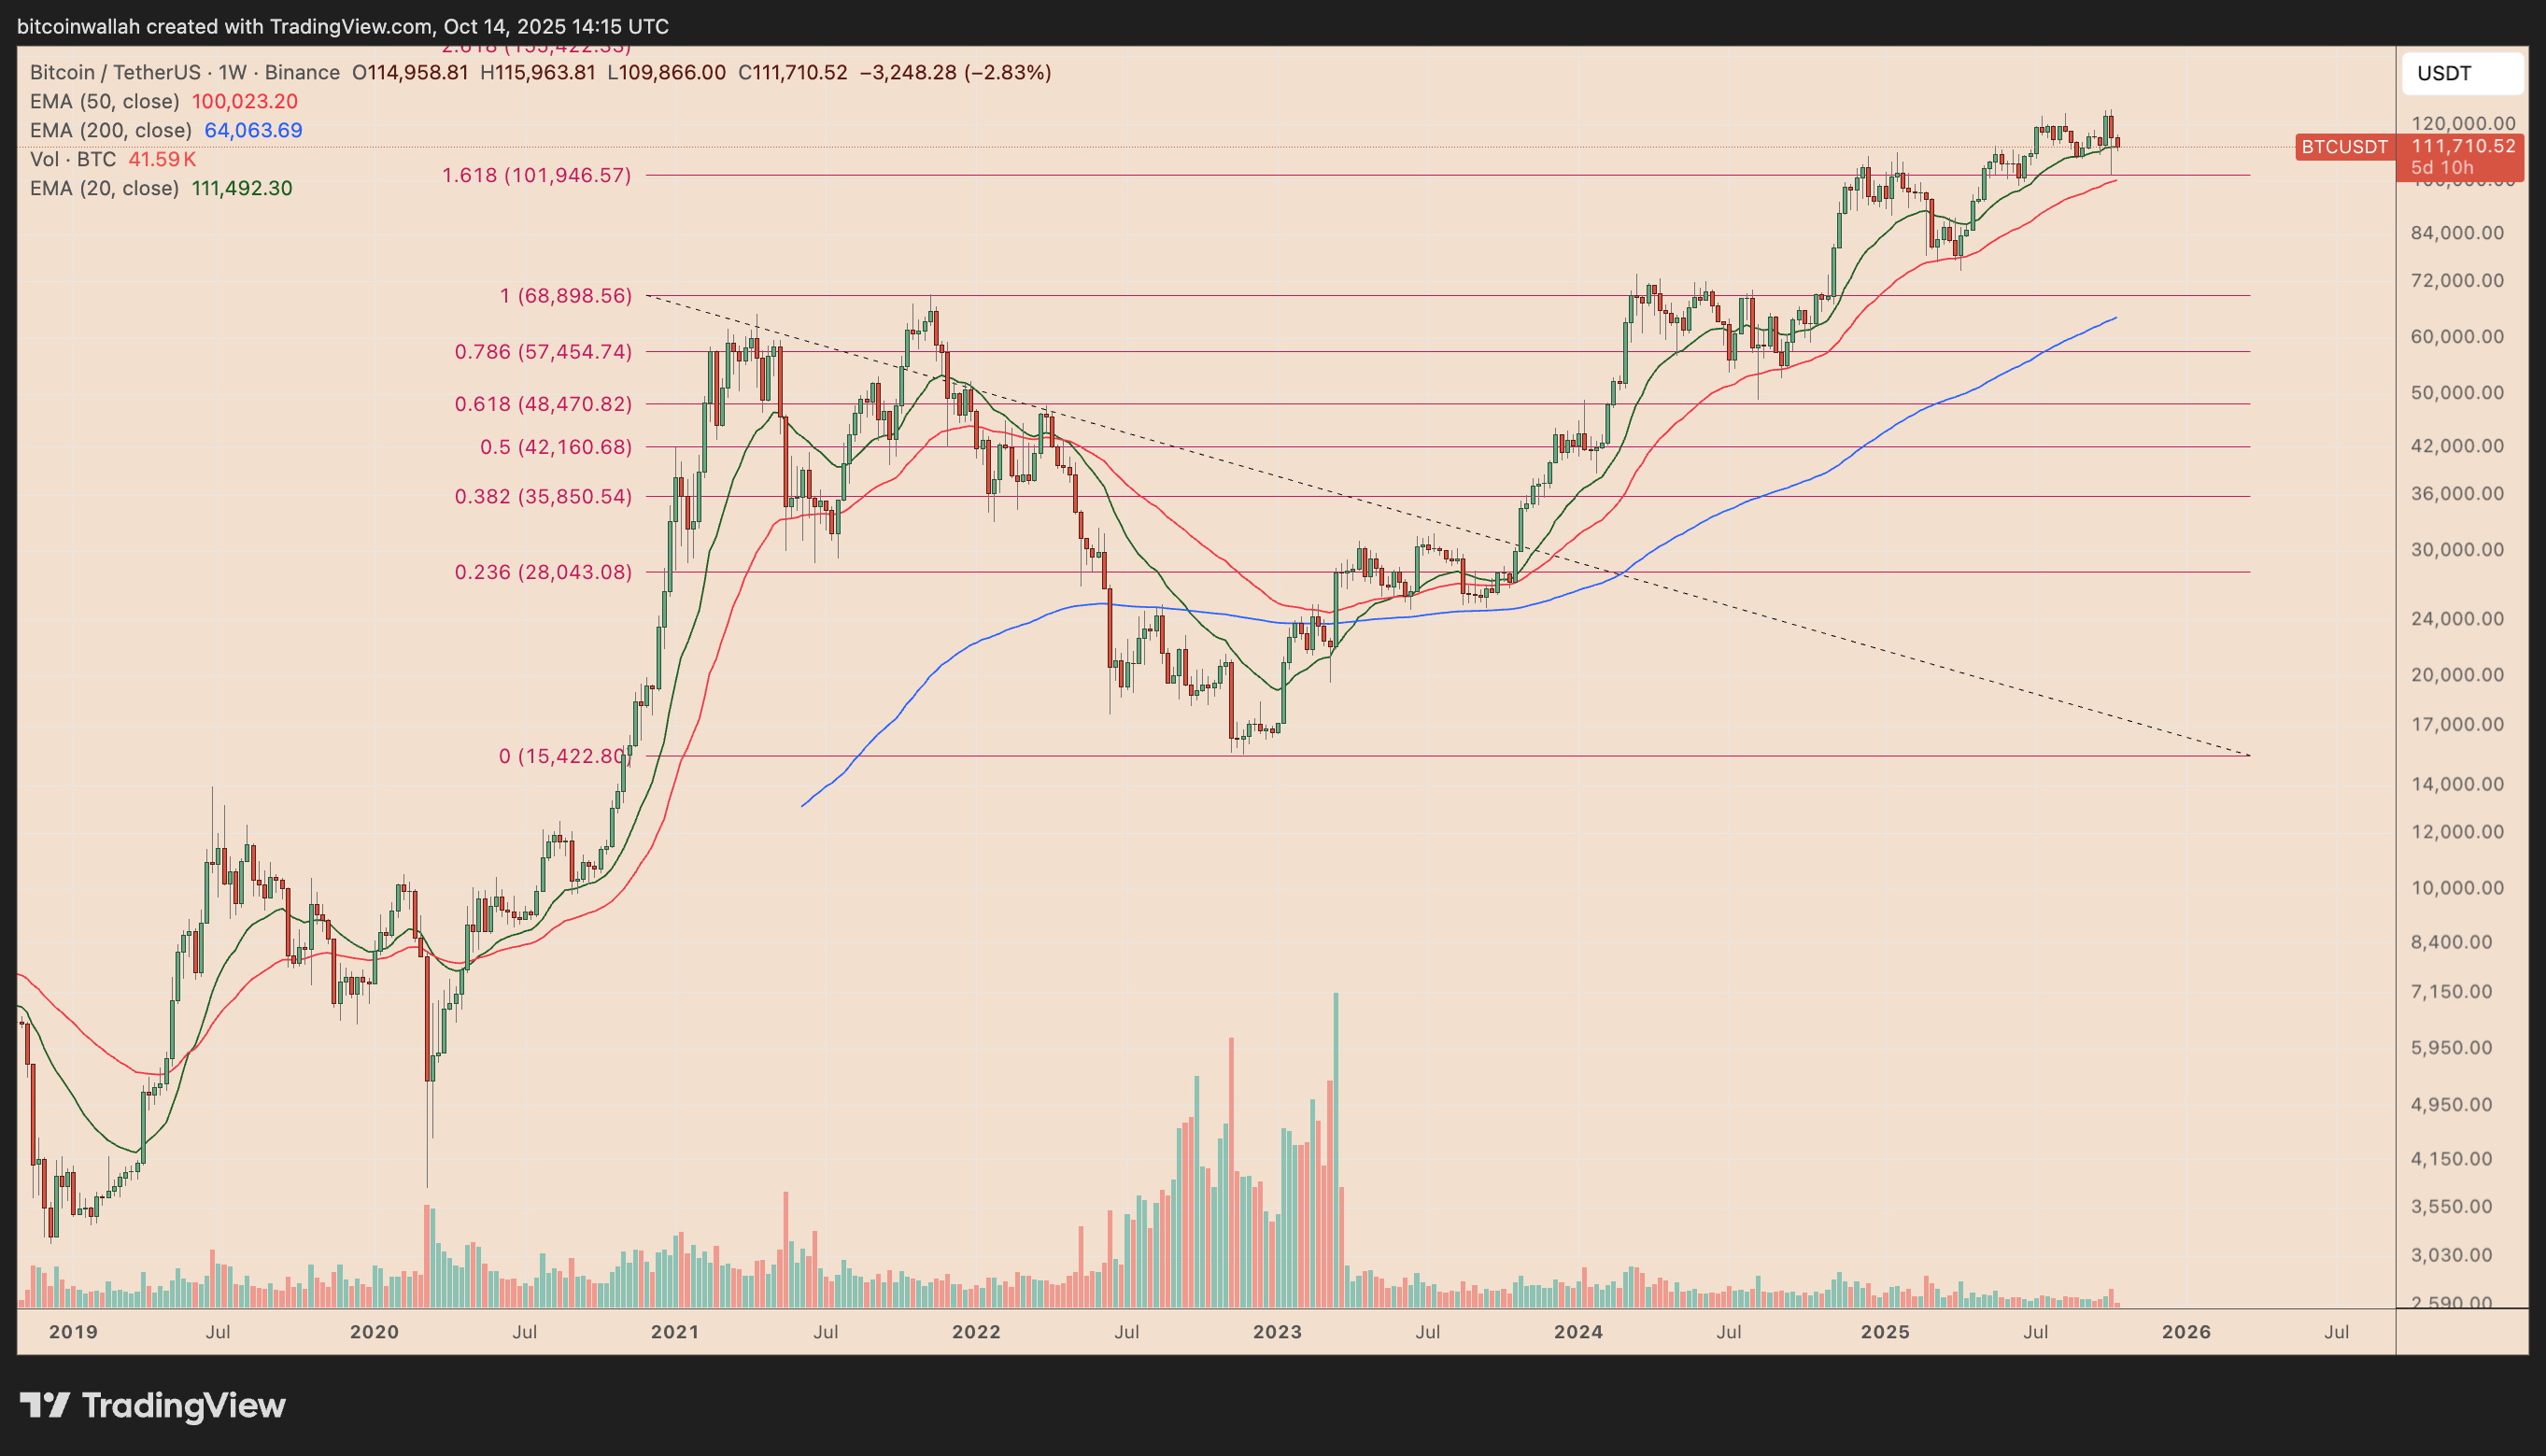 BTC/USD Weekly Price Chart
BTC/USD weekly price chart. Source: TradingView
BTC/USD Weekly Price Chart
BTC/USD weekly price chart. Source: TradingView
BTC Metrics Suggest $96,500 (or Lower)
According to Glassnode’s MVRV Extreme Deviation Pricing Bands, Bitcoin is currently trading below its +0.5 standard deviation band near $119,000. This model assesses how the current market price contrasts with Bitcoin’s “fair value,” derived from the average acquisition cost of current holders.
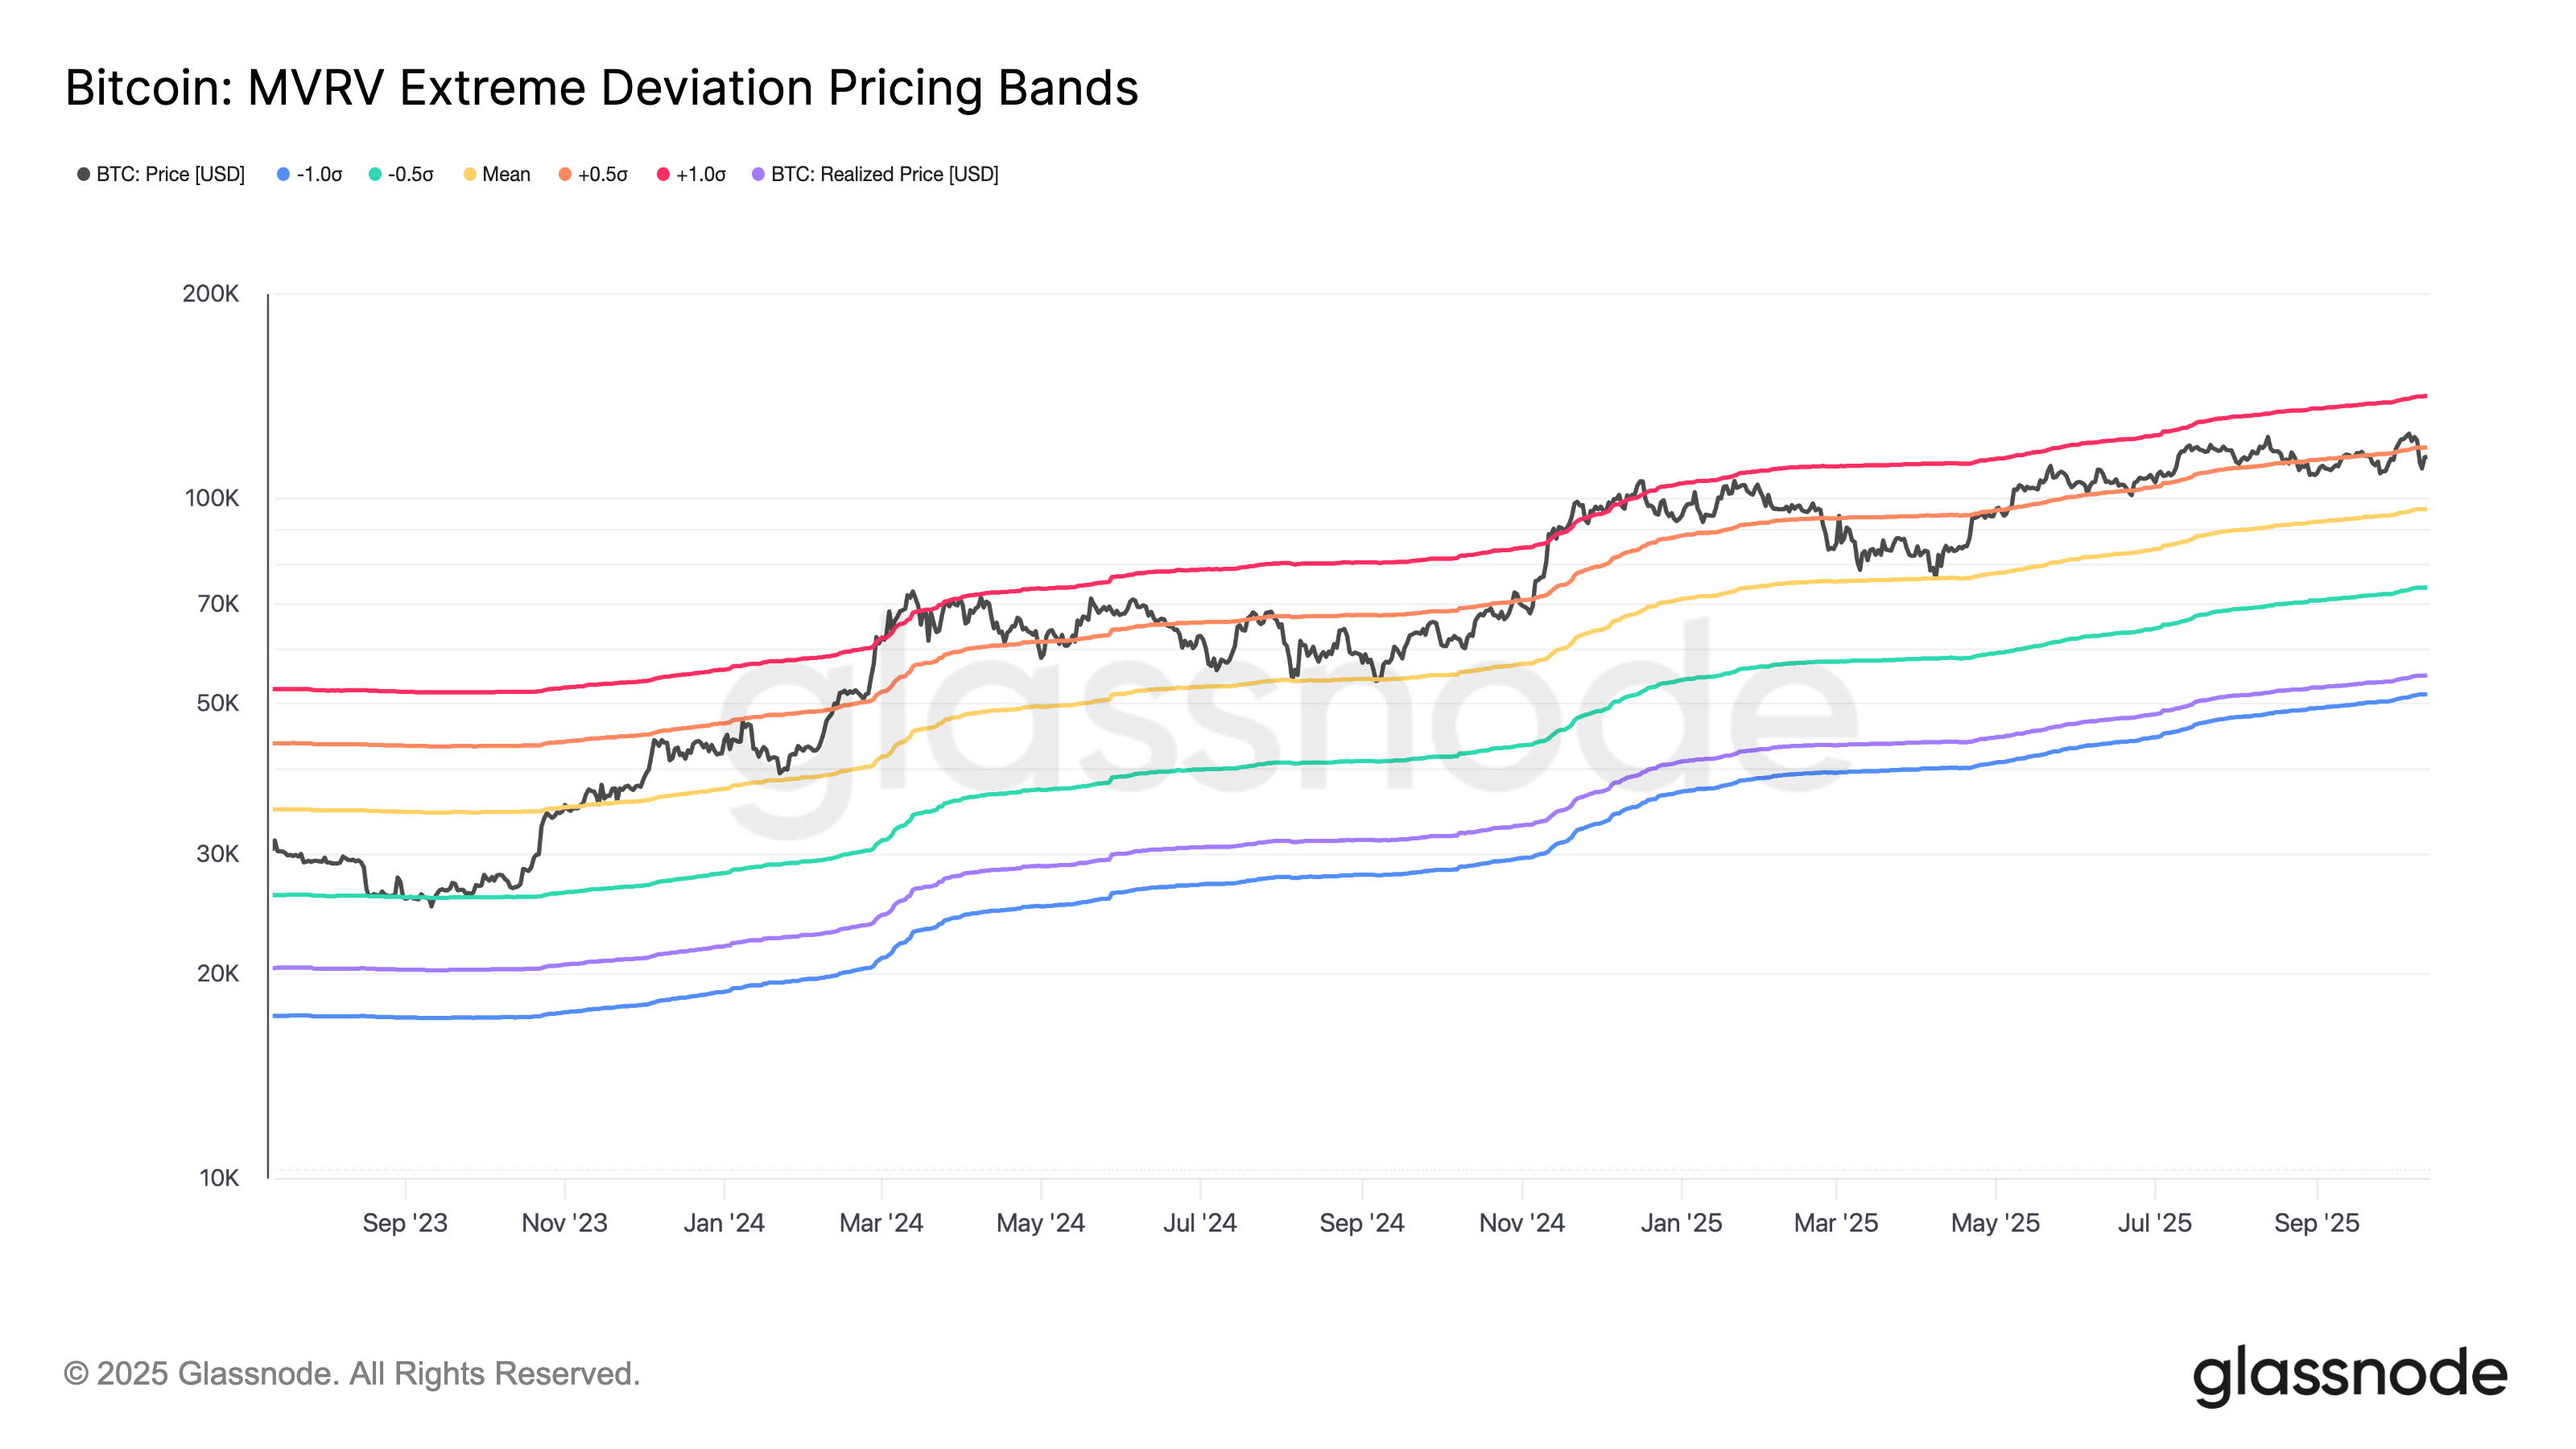 Bitcoin MVRV Extreme Deviation Pricing Bands
Bitcoin MVRV extreme deviation pricing bands. Source: Glassnode
Bitcoin MVRV Extreme Deviation Pricing Bands
Bitcoin MVRV extreme deviation pricing bands. Source: Glassnode
Historically, if Bitcoin falls below this +0.5σ support, the price typically reverts toward the mean band (yellow), which currently sits around $96,500. Previously, a similar situation happened during the December 2024–April 2025 downturn, where Bitcoin’s price plummeted from the +0.5σ level (~$66,980) to the mean band (~$53,900) prior to a steep rebound.
Related: 3 reasons why a Bitcoin rally to $125K could be delayed
This analysis indicates that the current trend might signify a mere cooling-off phase within a larger bullish market, aimed at shaking out excessive leverage and inflated valuations before the next upward momentum. Nonetheless, a drop beneath the mean reversion target could initiate a bear market, with a subsequent target around $74,000.
This article does not constitute investment advice. Every financial decision and trade carries inherent risks, and individuals should perform their own due diligence before proceeding.
