


XRP’s recent performance shows a bullish outlook, as analysts express increasing confidence in the cryptocurrency’s potential to stage a rally if vital support levels are regained.
Key Highlights:
- XRP must convert the 200-day SMA and the resistance range of $2.70-$2.80 into support to aim for prices over $3.00.
- Analysts rate a 57% chance of an upward movement to between $9.50 to $27, while there exists a 43% chance of a decline to $0.50.
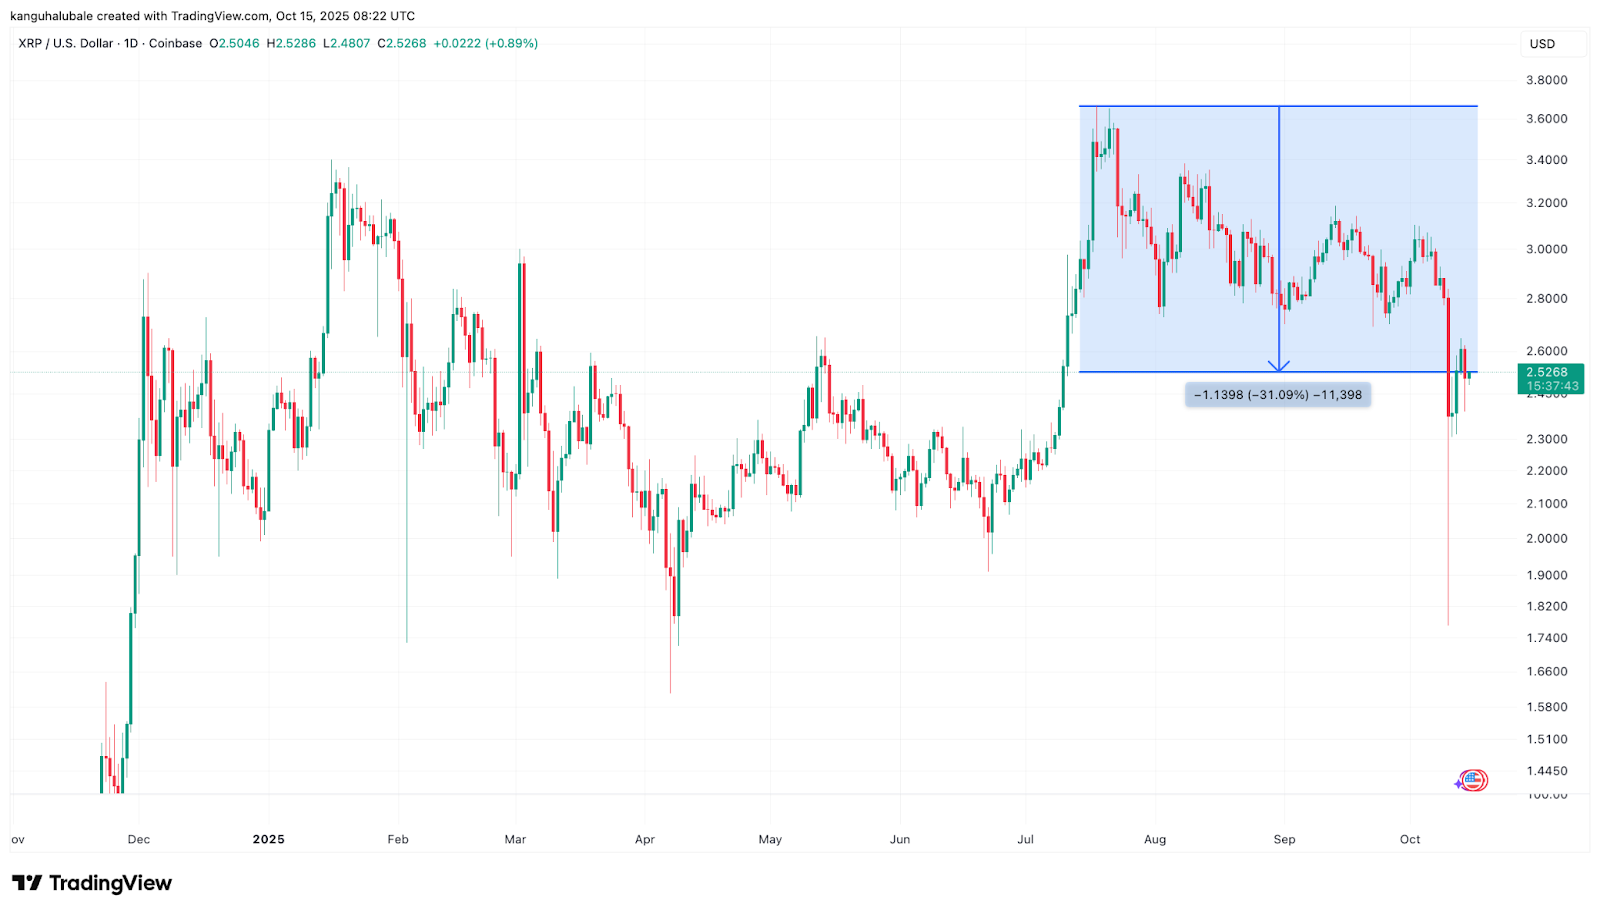
XRP has faced a significant downturn of over 31% since reaching a peak of approximately $3.66 in July. This decline includes a 12.5% decrease in the past week, bringing its price down to $2.50.
 XRP/USD daily price chart
. Source: TradingView
XRP/USD daily price chart
XRP/USD daily price chart. Source: TradingView
Will XRP be able to maintain the $2.50 support and continue its upward trajectory?
Key Moving Average Resistance
To achieve higher highs surpassing $3.00, XRP must shift the $2.70-$2.80 resistance zone to support levels. The daily chart shows that closing above the 200-day simple moving average (SMA) at $2.58 is essential.
In historical patterns, reclaiming this trendline has often preceded substantial recoveries in XRP’s price, as illustrated earlier this July.

According to Cointelegraph’s report, bullish momentum is needed to push prices over the 20-day exponential moving average (EMA) situated at $2.72.
57% Chance of Price Breakout
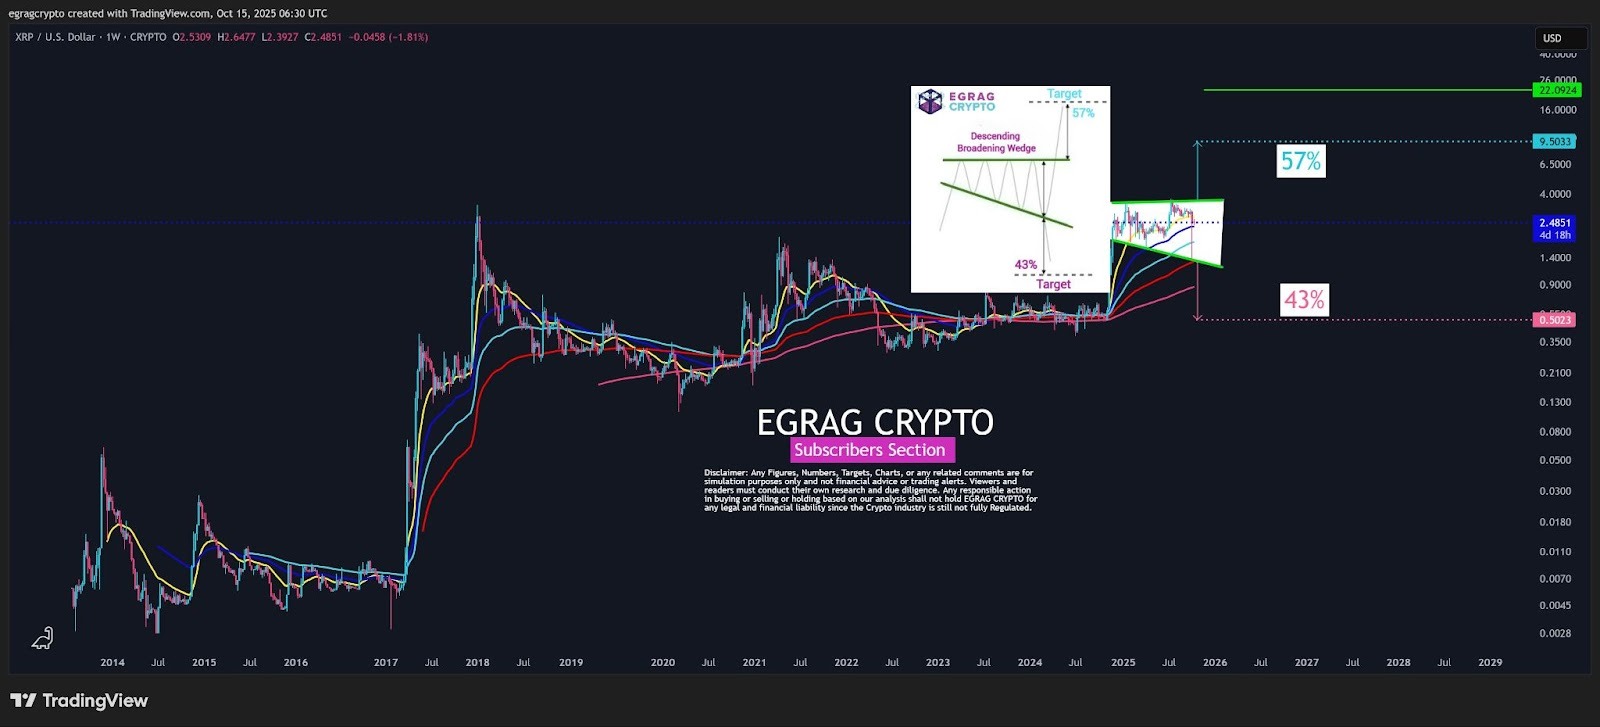
Analysis indicates a potential rebound from current price levels if XRP/USD maintains above $2.50, as highlighted by technical analyst Egrag Crypto. He showcased a chart portraying that XRP is trading within a “descending broadening wedge,” which reportedly has a 57% probability of an upward breakout.
If this forecast materializes, XRP could advance towards the target range of $9.50.
Egrag Crypto remarked:
“I believe we’re heading towards a minimum of $9, with an average target of $20 and a high-end target of $27 this cycle.”
 XRP/USD weekly chart
. Source: Egrag Crypto
XRP/USD weekly chart
XRP/USD weekly chart. Source: Egrag Crypto
The broadening wedge formation also suggests a 43% chance of a downturn that could result in prices falling as low as $0.50, presenting a suitable opportunity for re-entry, the analyst concluded.
Additionally, Elliott wave analyst XForceGlobal conveyed that XRP remains bullish on a macro level. He interprets the current price phase as a “confirmation stage” prior to XRP’s major bullish movement into wave 3 of its cycle.
“From a timing perspective, it’s looking great.”

Various technical indicators, especially on longer timeframes, hint at a possible bullish reversal for XRP price.
Please note: This article does not serve as investment guidance or recommendations. All investment actions carry risk, and readers should perform their own due diligence.
