


Key Takeaways
- Crypto charts showcase open-high-low-close (OHLC) data.
- OHLC details assist traders in monitoring price variations and identifying engaging opportunities.
- The X-axis represents timeframes, while the Y-axis reflects price levels, either linearly or logarithmically.
- Volume bars beneath the chart affirm market engagement.
- Candlestick charts are the most favored for their detail, whereas line charts are excellent for quick insights, and bar charts supply an alternative OHLC layout.
- Recognizable patterns like head and shoulders, double tops and bottoms, triangles, flags, pennants, and wedges reflect trader emotions and can indicate possible trend reversals or continuations.
As we enter 2025, the cryptocurrency market remains a blend of opportunities and obstacles. Prices are still highly volatile, influenced by new regulations, technological innovations, and trends in artificial intelligence.
For those just getting started, the crypto landscape might seem daunting. However, once you master reading crypto charts, understanding the market dynamics becomes much clearer.
This guide breaks down the essentials of reading crypto charts, including crucial patterns, tools, and strategies. Whether your goal is to project Bitcoin’s (BTC) next surge or investigate upcoming altcoin trends, you’ll acquire the skills necessary to interpret price movements effectively. This structured approach will help you establish a firm groundwork for crypto trading and dodge typical pitfalls.
Fundamentals of Crypto Charts
Crypto price charts are visual tools allowing traders to observe price movements across various timeframes, offering insights into trends, volatility, and trading opportunities. OHLC data forms the bedrock of technical analysis, empowering traders to keep track of price changes over defined periods.
Key Components
Grasping the layout of crypto charts is vital for traders. Primary elements of crypto charts are:
- X-axis: Managing diverse timeframes is crucial for aligning short-term trades with a broad perspective. Charts can be customized from one-minute to monthly intervals.
- Y-axis: The price scale can be either linear or logarithmic. Logarithmic scales are preferable for long-term crypto assessments as they accentuate percentage-based changes more distinctly.
- Volume Bars: These indicators illustrate market activity, validating chart patterns by confirming whether a breakout or reversal is supported by substantial trading engagement.
Essential Chart Types
Several chart types underpin technical analysis. The primary ones include:
- Candlestick: The most extensively utilized type, demonstrating OHLC data in a solitary bar.
- Line: This chart type offers a rapid overview of general trends by connecting closing prices over time.
- Bar: Serving as a simpler alternative to candlesticks, this displays the OHLC framework in an easier format.
As AI technology flourishes, charts that incorporate on-chain data such as wallet interactions and total value locked (TVL) are gaining traction. These advanced charts provide traders richer insights into changing market dynamics.
Popular Chart Patterns in Crypto Trading
Chart patterns, formed by price movements, aid traders in projecting future market trends. These formations mainly fall into two categories: reversal patterns, indicating a potential change in the existing trend’s direction, and continuation patterns, suggesting the trend will likely resume after a temporary pause.
Listed below are five standard patterns every crypto trader should familiarize themselves with:
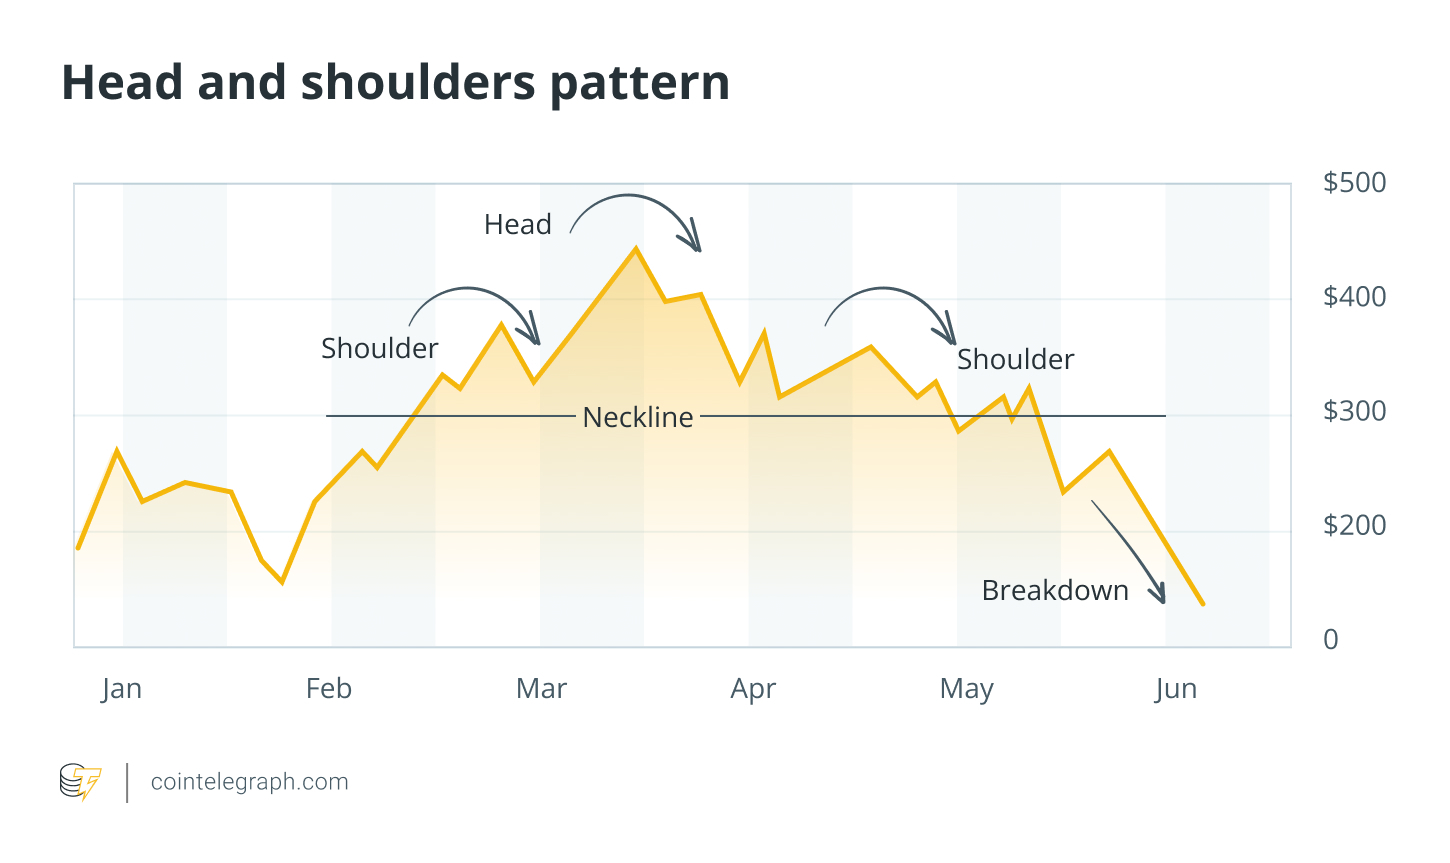
1. Head and Shoulders
- Displays three peaks: a central one (the head) flanked by two smaller peaks (the shoulders), connected by a neckline.
How to Interpret:
- A drop in volume on the right shoulder signals weakening momentum. A price dip beneath the neckline marks a bearish reversal confirmation, while an upward breach indicates a bullish inverse. Measure the gap from the head to the neckline to forecast movements.
Example:
- This pattern commonly occurs in altcoin corrections following major hype cycles. In early 2025, Cardano (ADA) created a head-and-shoulders formation post-governance enhancement buzz, hinting at a temporary bearish trend.
 Head and Shoulders
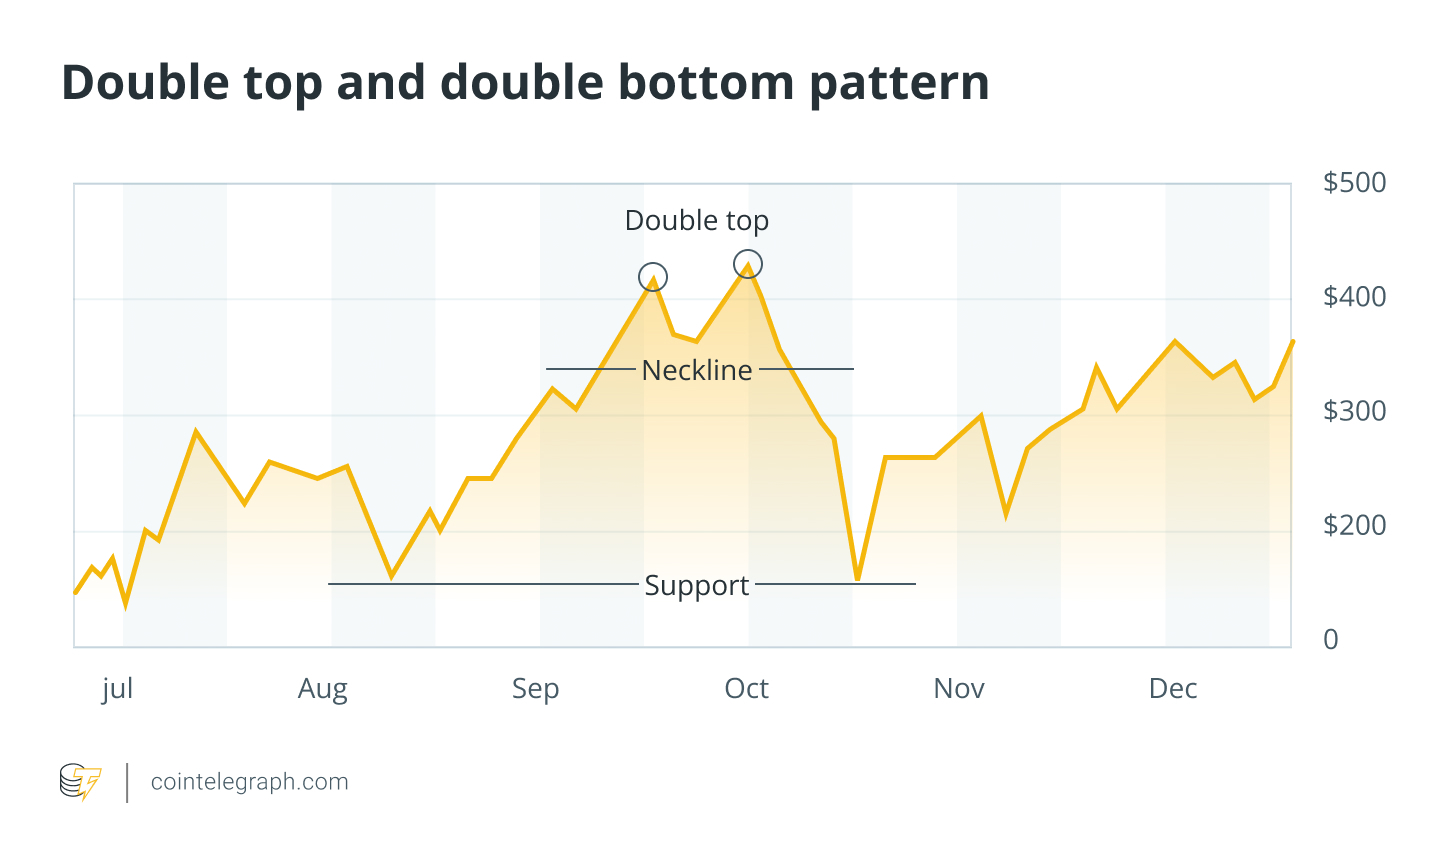
2. Double Top and Double Bottom
- The double top shape resembles an “M” near resistance, predicting a potential bearish shift, whereas a double bottom takes the form of a “W” near support, suggesting a potential bullish turn.
Example:
- This pattern can often manifest during memecoin pump-and-dumps. Dogecoin (DOGE) exhibited a double top formation in mid-2025 after a surge driven by social media, followed by a significant downturn.
 Double Top
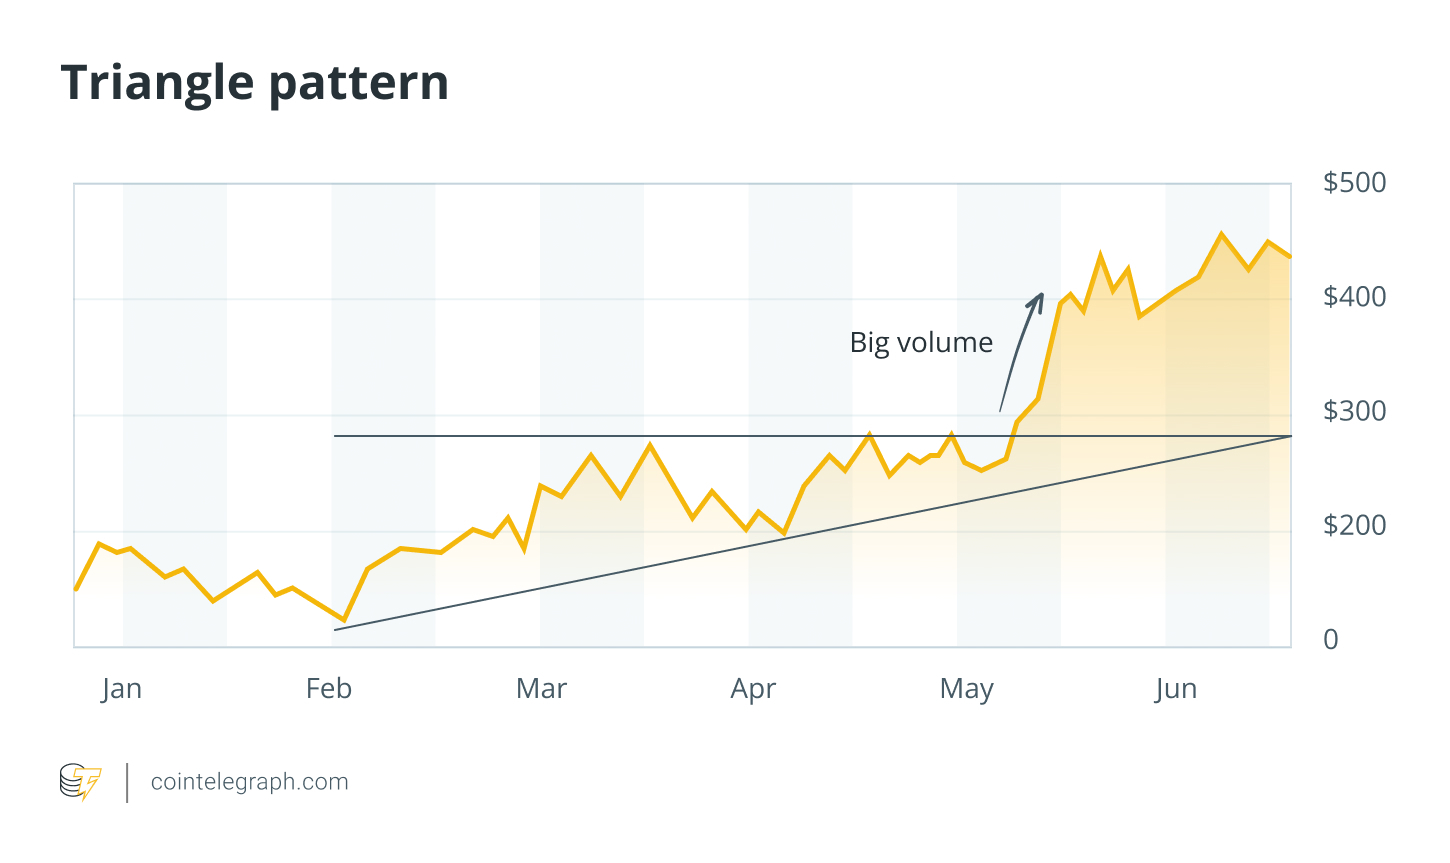
3. Triangle
- Triangles form from converging trendlines during price movements. They can be ascending (bullish), descending (bearish), or symmetrical (neutral).
- Example: In early 2025, Ether’s (ETH) charts showed a symmetrical triangle reflecting uncertainty surrounding DeFi regulations.
 Triangle
4. Flag and Pennant
- These patterns indicate brief halts following sharp price fluctuations. Flags are displayed as narrow, parallel channels, while pennants appear as compact triangles.
- Example: In 2025, Solana’s (SOL) price trajectory formed a bullish flag throughout rapid ecosystem expansion, signaling trend continuity.
 Flag and Pennant
5. Wedge
- Wedges occur when price actions converge along upward (rising wedge, typically bearish) or downward (falling wedge, usually bullish) sloping trendlines.
- Example: In 2025, during elevated speculative conditions, Arbitrum’s (ARB) price displayed a rising wedge pattern before a market correction.
 Wedge
Wedge
Conclusion
Successfully trading cryptocurrencies requires sound risk management and disciplined strategies. It is vital to interpret patterns in conjunction with reliable indicators and pertinent news for enhanced accuracy. Always commit only a fraction of your total capital to safeguard against sudden market shifts. By adopting a structured and informed trading approach, you can navigate the complexities of the crypto landscape effectively.
