
Ethereum Market Dynamics: Bearish Indicators or a Bullish Rally Ahead?
Ethereum faces potential bearish signals while support levels are being closely monitored by analysts.


Ethereum is currently displaying mixed signals on the charts, with analysts keeping an eye on crucial technical levels and momentum indicators.
While risks of a downturn have surfaced, some indicators point to possible support near current trading prices. The crypto asset is holding steady above the $3,900 mark, a level that numerous traders are carefully monitoring.
Bearish Momentum Develops on Weekly MACD
Ali Martinez pointed out that Ethereum is nearing a bearish MACD crossover on the weekly chart, a pattern associated with significant price drops historically. The last occurrences of this signal resulted in price declines of 43% and 61%. Furthermore, the MACD histogram is indicating a downward trend, signaling diminishing momentum.
Ethereum $ETH is on the brink of a bearish MACD crossover on the weekly chart. The last two occurrences led to drops of 43% and 61%. pic.twitter.com/RRIjFeR63k
— Ali (@ali_charts) October 16, 2025
As of now, Ethereum’s price is hovering around $4,000, reflecting a decrease of 4% over the past day and 10% over the last week. The crossover has not been officially confirmed. If it does, many anticipate a more substantial correction.
RSI in Oversold Territory with Active Flag Pattern
Tom Tucker has observed that Ethereum’s RSI is positioned around 16, indicating that it is heavily oversold. He remarked, “RSI at 16.25 indicates extremely oversold conditions” and suggested that recoveries frequently follow such readings. Tucker also mentioned that bearish signals may prompt sellers to enter too soon.
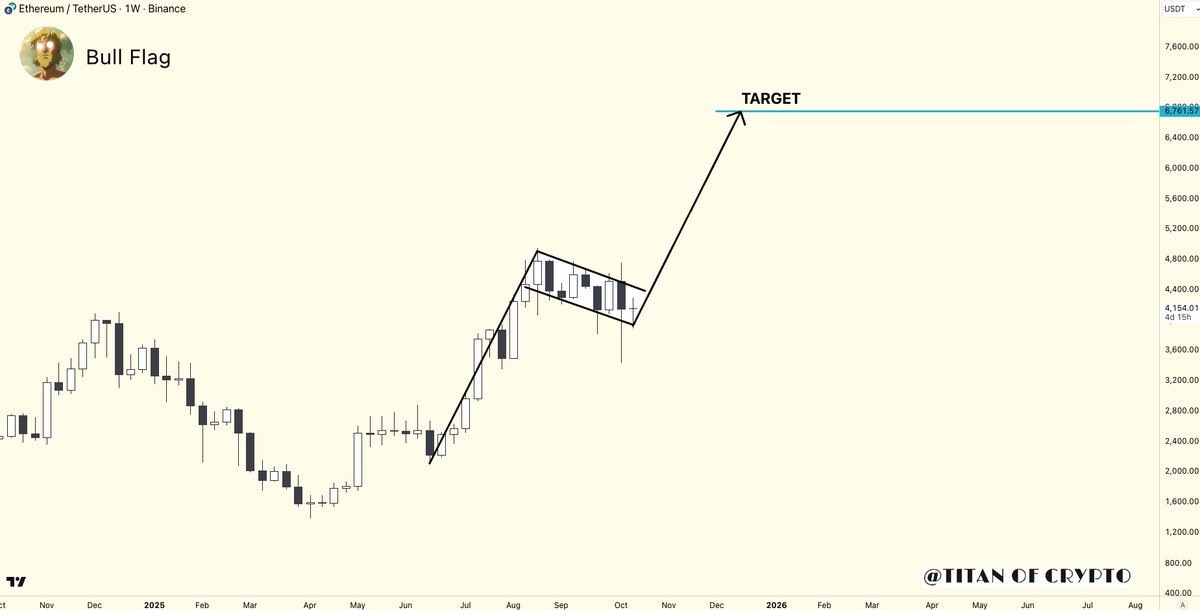
A chart shared by Titan of Crypto displayed a bull flag pattern on Ethereum’s weekly chart. This pattern has emerged after a sharp upward move and remains valid. Should a breakout occur, it forecasts a move towards $6,700 based on the flagpole’s height added to the breakout point.
You might also find interesting:
- Nearly All ETH Held by Companies Was Purchased in Past Quarter Alone
- How US-China Conflict Affected Ethereum Prices
- Crypto Market Dynamics Post-Mass Liquidation Event
 Source: Titan of Crypto/X
Moreover, Martinez emphasized the importance of MVRV Pricing Bands, which measure historical deviations from Ethereum’s realized price. ETH is currently above the mean band at $3,900, indicating it as a crucial support zone.
$3,900 is a vital support level for Ethereum $ETH. If this level is maintained, the Pricing Bands suggest an upward movement towards $5,000 or even $6,000. pic.twitter.com/GV6OFQqO3T
— Ali (@ali_charts) October 15, 2025
If this support holds, indications suggest potential upward trends towards $5,000 and $6,000. Conversely, if it fails, traders might reconsider strategies for lower price ranges around $2,800.
Growing Institutional Demand and Blockchain Usage
Bitwise reported that 95% of ETH currently held by public companies was acquired in the last quarter, with a total of 4.4 million ETH added, reflecting a staggering 1,937% increase compared to the preceding quarter. The cumulative holdings by public companies and ETFs amount to 12.50 million ETH, representing 10.31% of the total supply.
Cipher X noted that Ethereum is evolving into the settlement layer of the digital economy. USDC supply is approaching $45 billion, while BlackRock’s BUIDL fund holds over $2 billion in tokenized US Treasuries. Cipher indicated that these two phenomena are progressing in parallel, driven by the increasing utilization of Ethereum’s infrastructure.
