


Ethereum is currently showing signs that it may be heading for a notable drop, reminiscent of past occurrences where it lost between 46% and 60% of its value. This bearish signal, which emerged in October, raises concerns among traders and analysts alike.
Key Insights:
- The price of Ether previously suffered a 60% fall following a similar bearish indicator.
- To stave off additional declines, ETH needs to remain above the $4,000 mark.
Historical Signals Indicate Potential for Loss
The MACD indicator for Ether has delivered a ‘sell’ signal on its weekly chart, a warning that historically precedes significant price drops. The most recent bearish cross occurred for ETH in early 2025, leading to a dramatic price decrease.
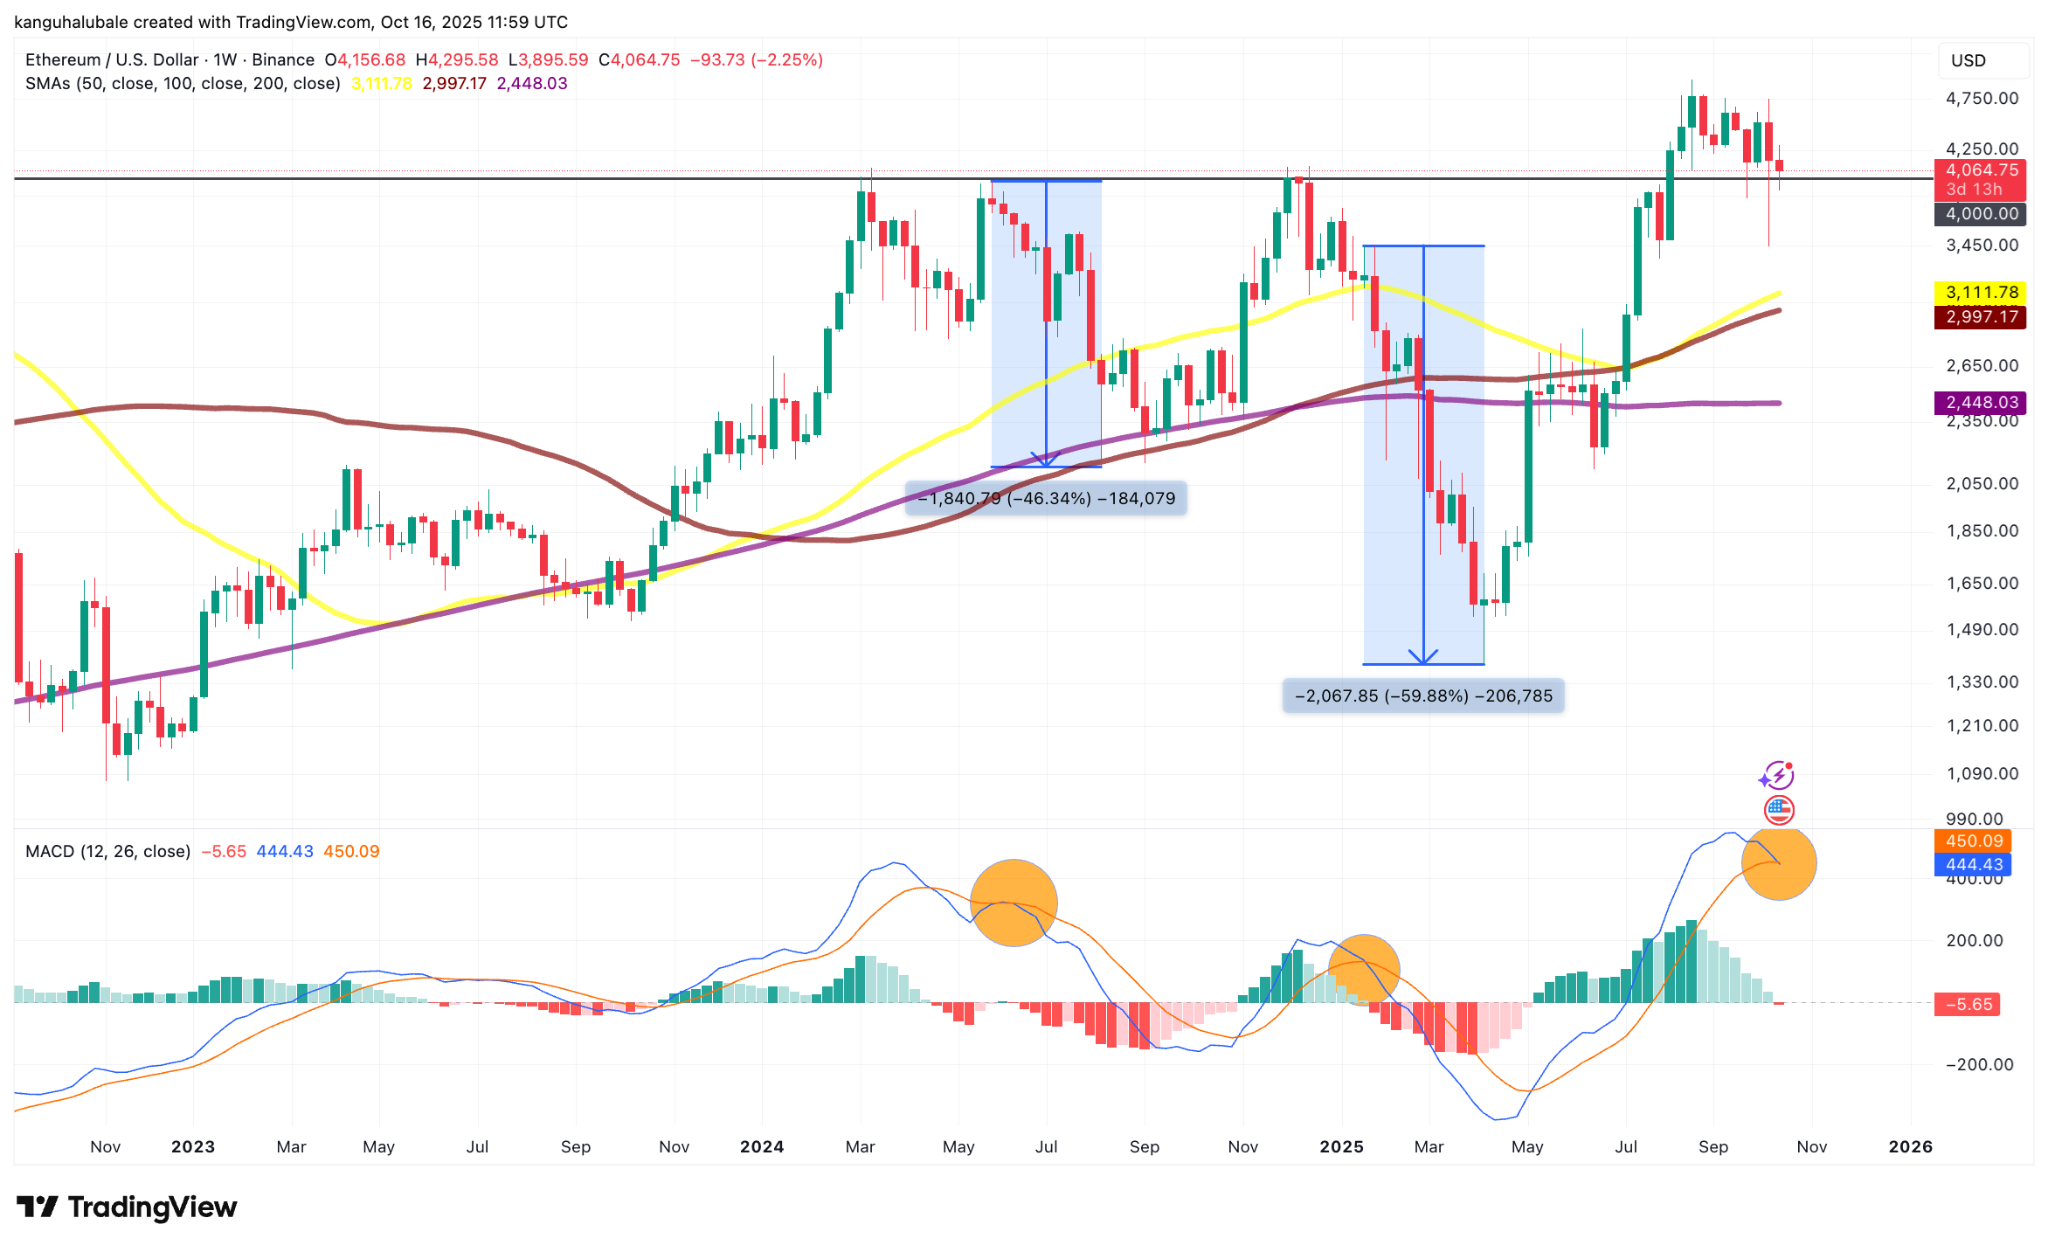 ETH/USD weekly chart. Source: Cointelegraph
“Not liking this Ethereum weekly MACD cross to red after 22 weeks green,” said analyst CRYPTO Damus, highlighting the importance of monitoring this signal closely.
The $4,000 Threshold
Ether’s price is gravitating toward a crucial $4,000 support level, which it has retested since reclaiming it in early August. Maintaining this level is vital for a potential trend reversal. If Ether falls below this threshold, it may signal the start of a significant correction, as it has done in the past, including a notable collapse in December 2021.
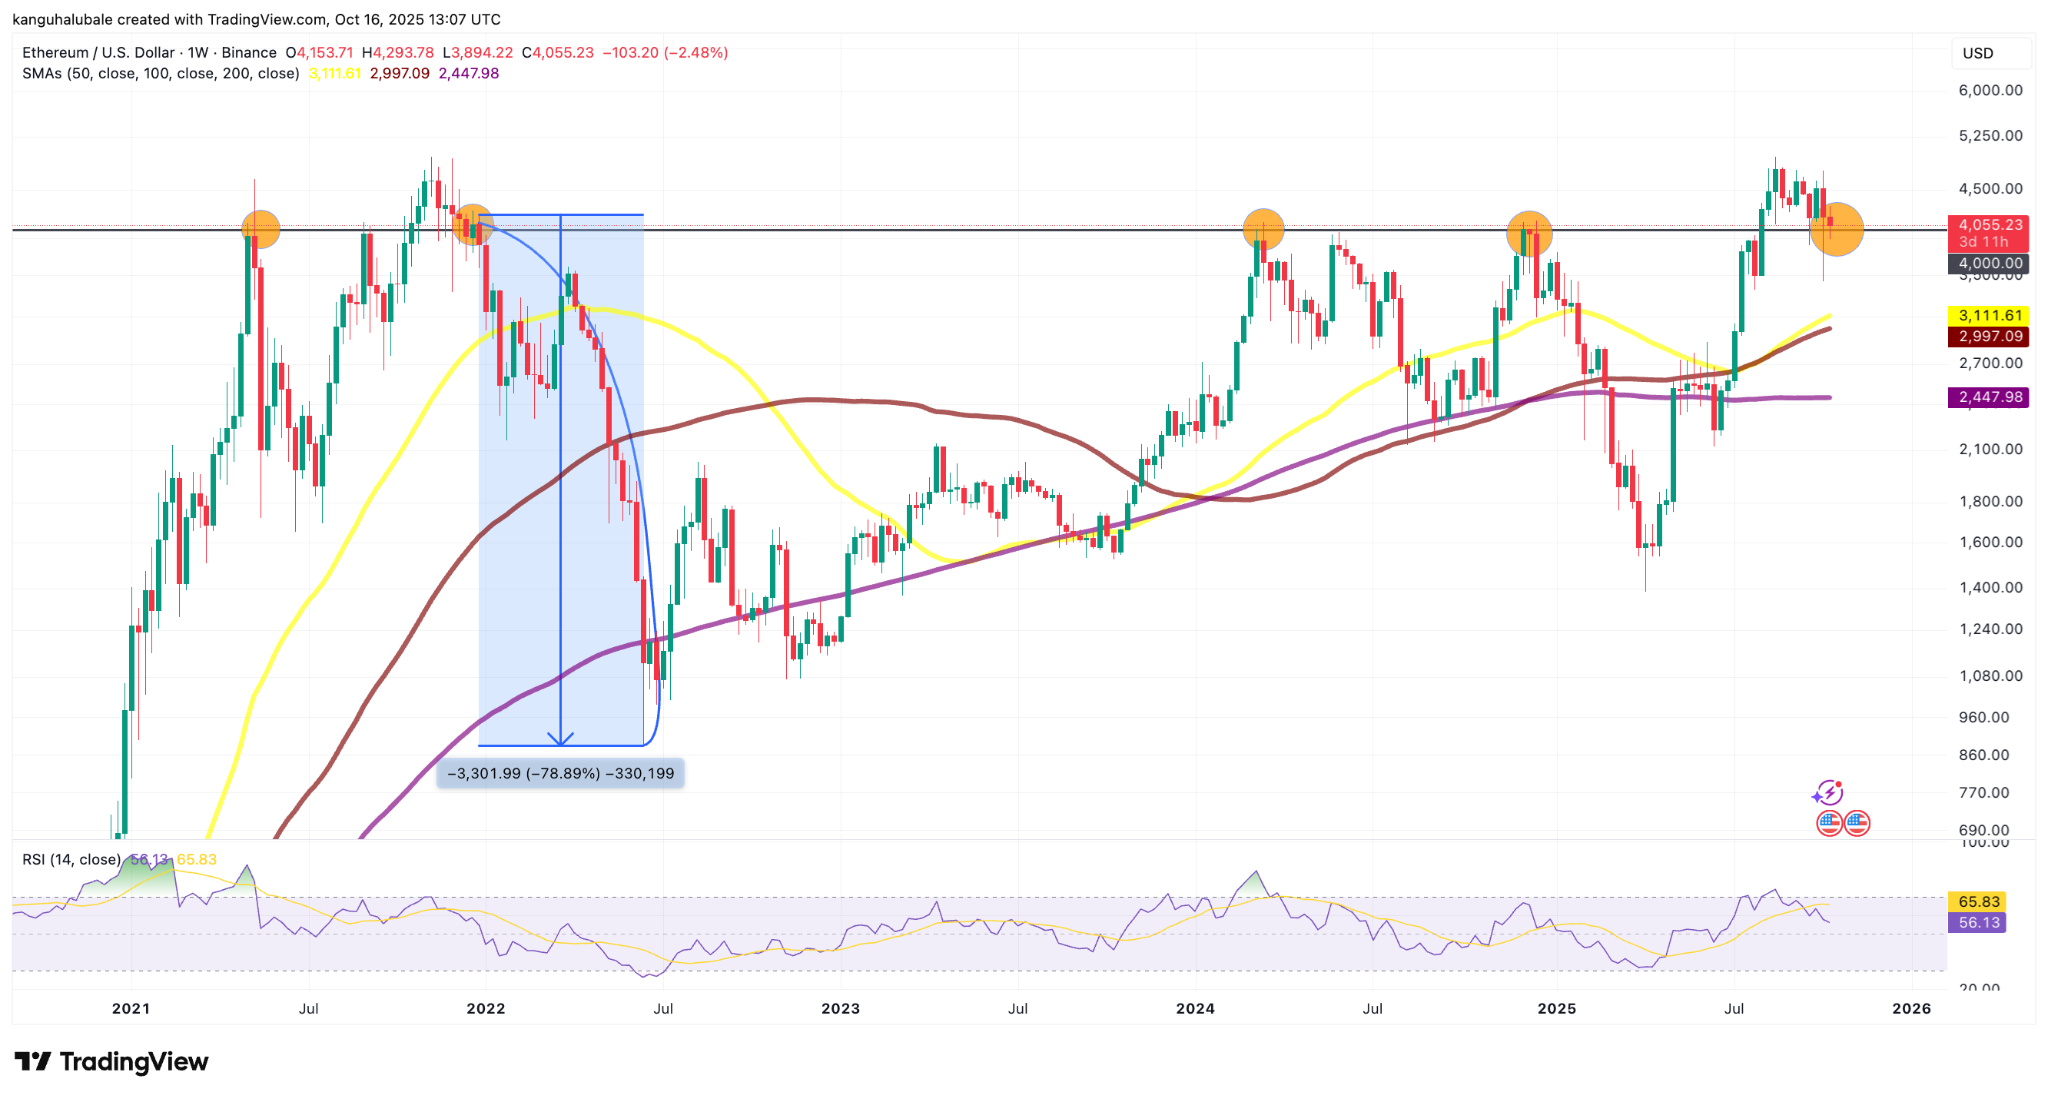 ETH/USD weekly chart. Source: Cointelegraph
“As long as ETH price holds above the $3,899 support level, a direct move to the upside remains possible,” warned Elliott Wave analyst Man of Bitcoin.
In conclusion, Ether bears are presently in control, with a focus on pushing prices down to lower boundaries. Remember that this article does not provide investment advice, and conducting personal research is vital before making any trading decisions.
