Ethereum's Price Drop: Is $3.5K the Next Target After a 13% Decrease?
An analysis of Ethereum's recent price drop and technical indicators suggests potential future movements.


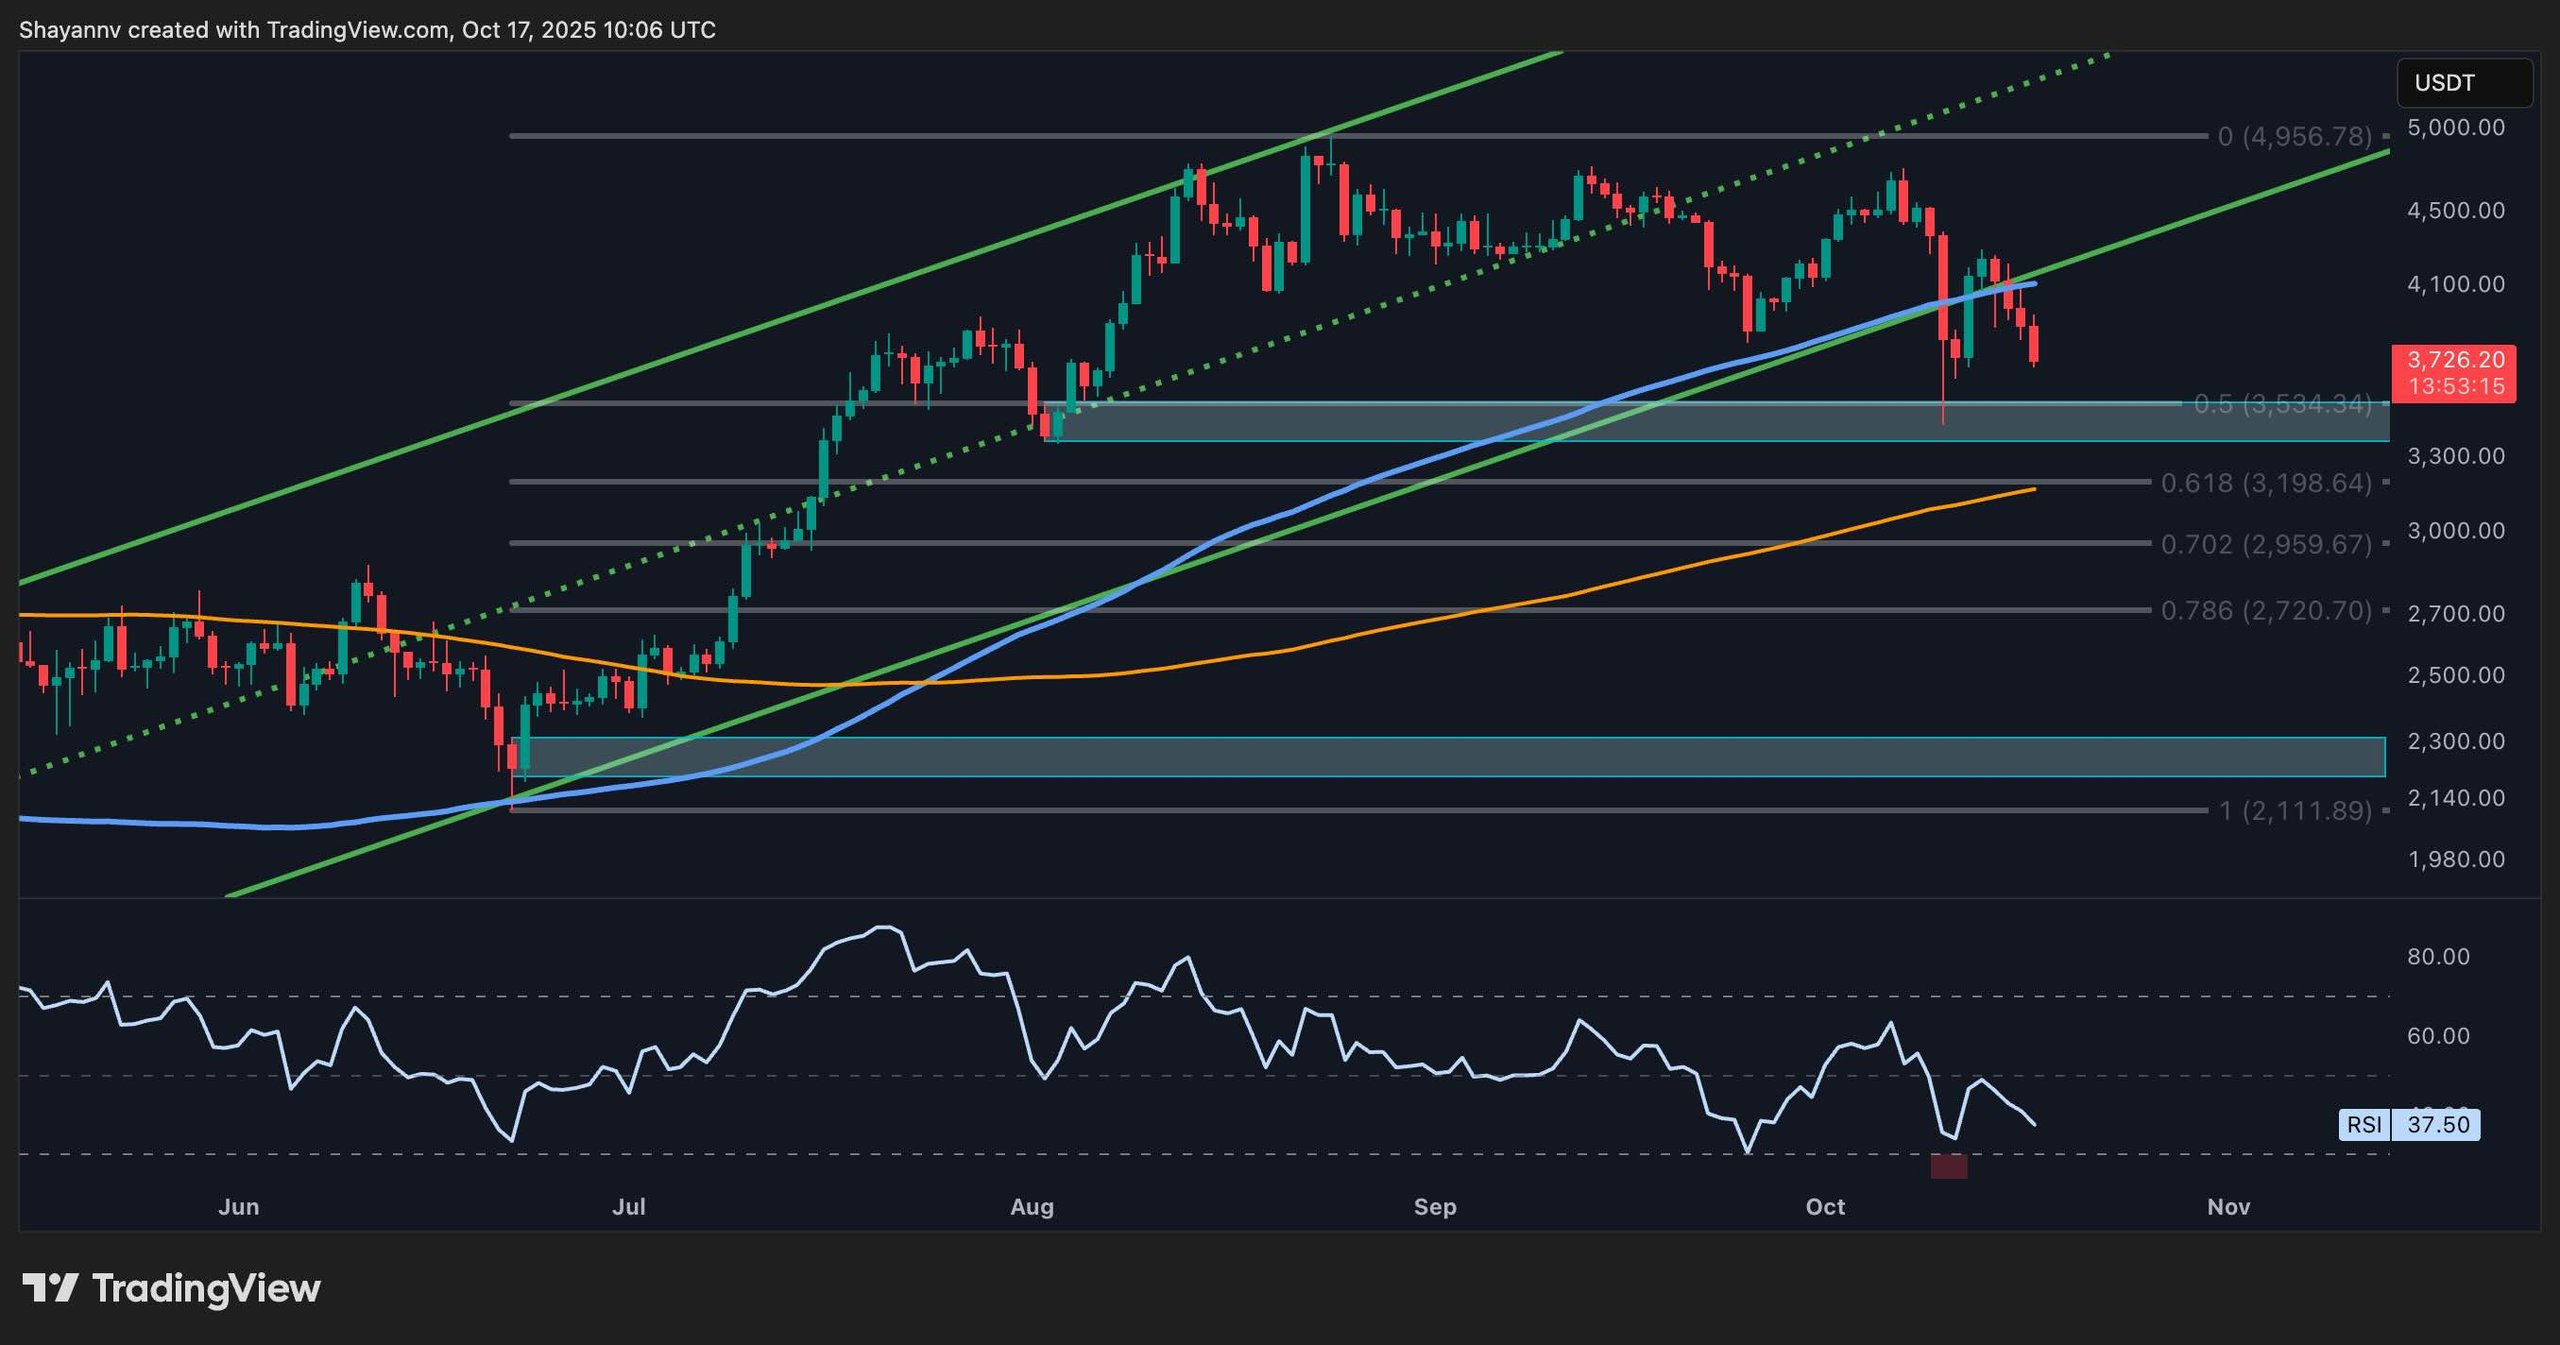
Ethereum continues to face a downward trend after struggling to stay above the $4,200 mark. The current trading price is around $3,700, indicating ongoing concerns in market sentiment regarding the asset’s stability.
Technical Analysis
The Daily Chart
On the daily chart, Ethereum (ETH) has just breached below a significant support trendline and is now challenging the 100-day moving average that previously lingered near the $4,100 mark. Currently, it’s heading for the 0.5 Fibonacci retracement level of $3,530, a critical juncture that once provided strong support during the rally in August. As indicated by the RSI at approximately 37, this underscores the prevailing bearish momentum, with further declines possible if the price falls beneath $3,500, paving the way for a move towards the 0.618 retracement level around $3,200. On a positive note, a recovery past the recent high near $4,200 would signal a market rebound.
ETH Daily Chart
The 4-Hour Chart
Examining the 4-hour timeframe reveals a pronounced bearish trend. This negative sentiment worsened after Ethereum lost the $4,200 price level and failed to retrieve it, suggesting a shift in the short-term market structure to bearish. The RSI is presently around 33, indicating that selling pressure remains strong. The next support zones are projected between $3,500 and $3,400, where recent buyer interest was observed amid a major liquidation event. Failing to maintain above these levels could intensify a move down to $3,200 or further to $3,000.
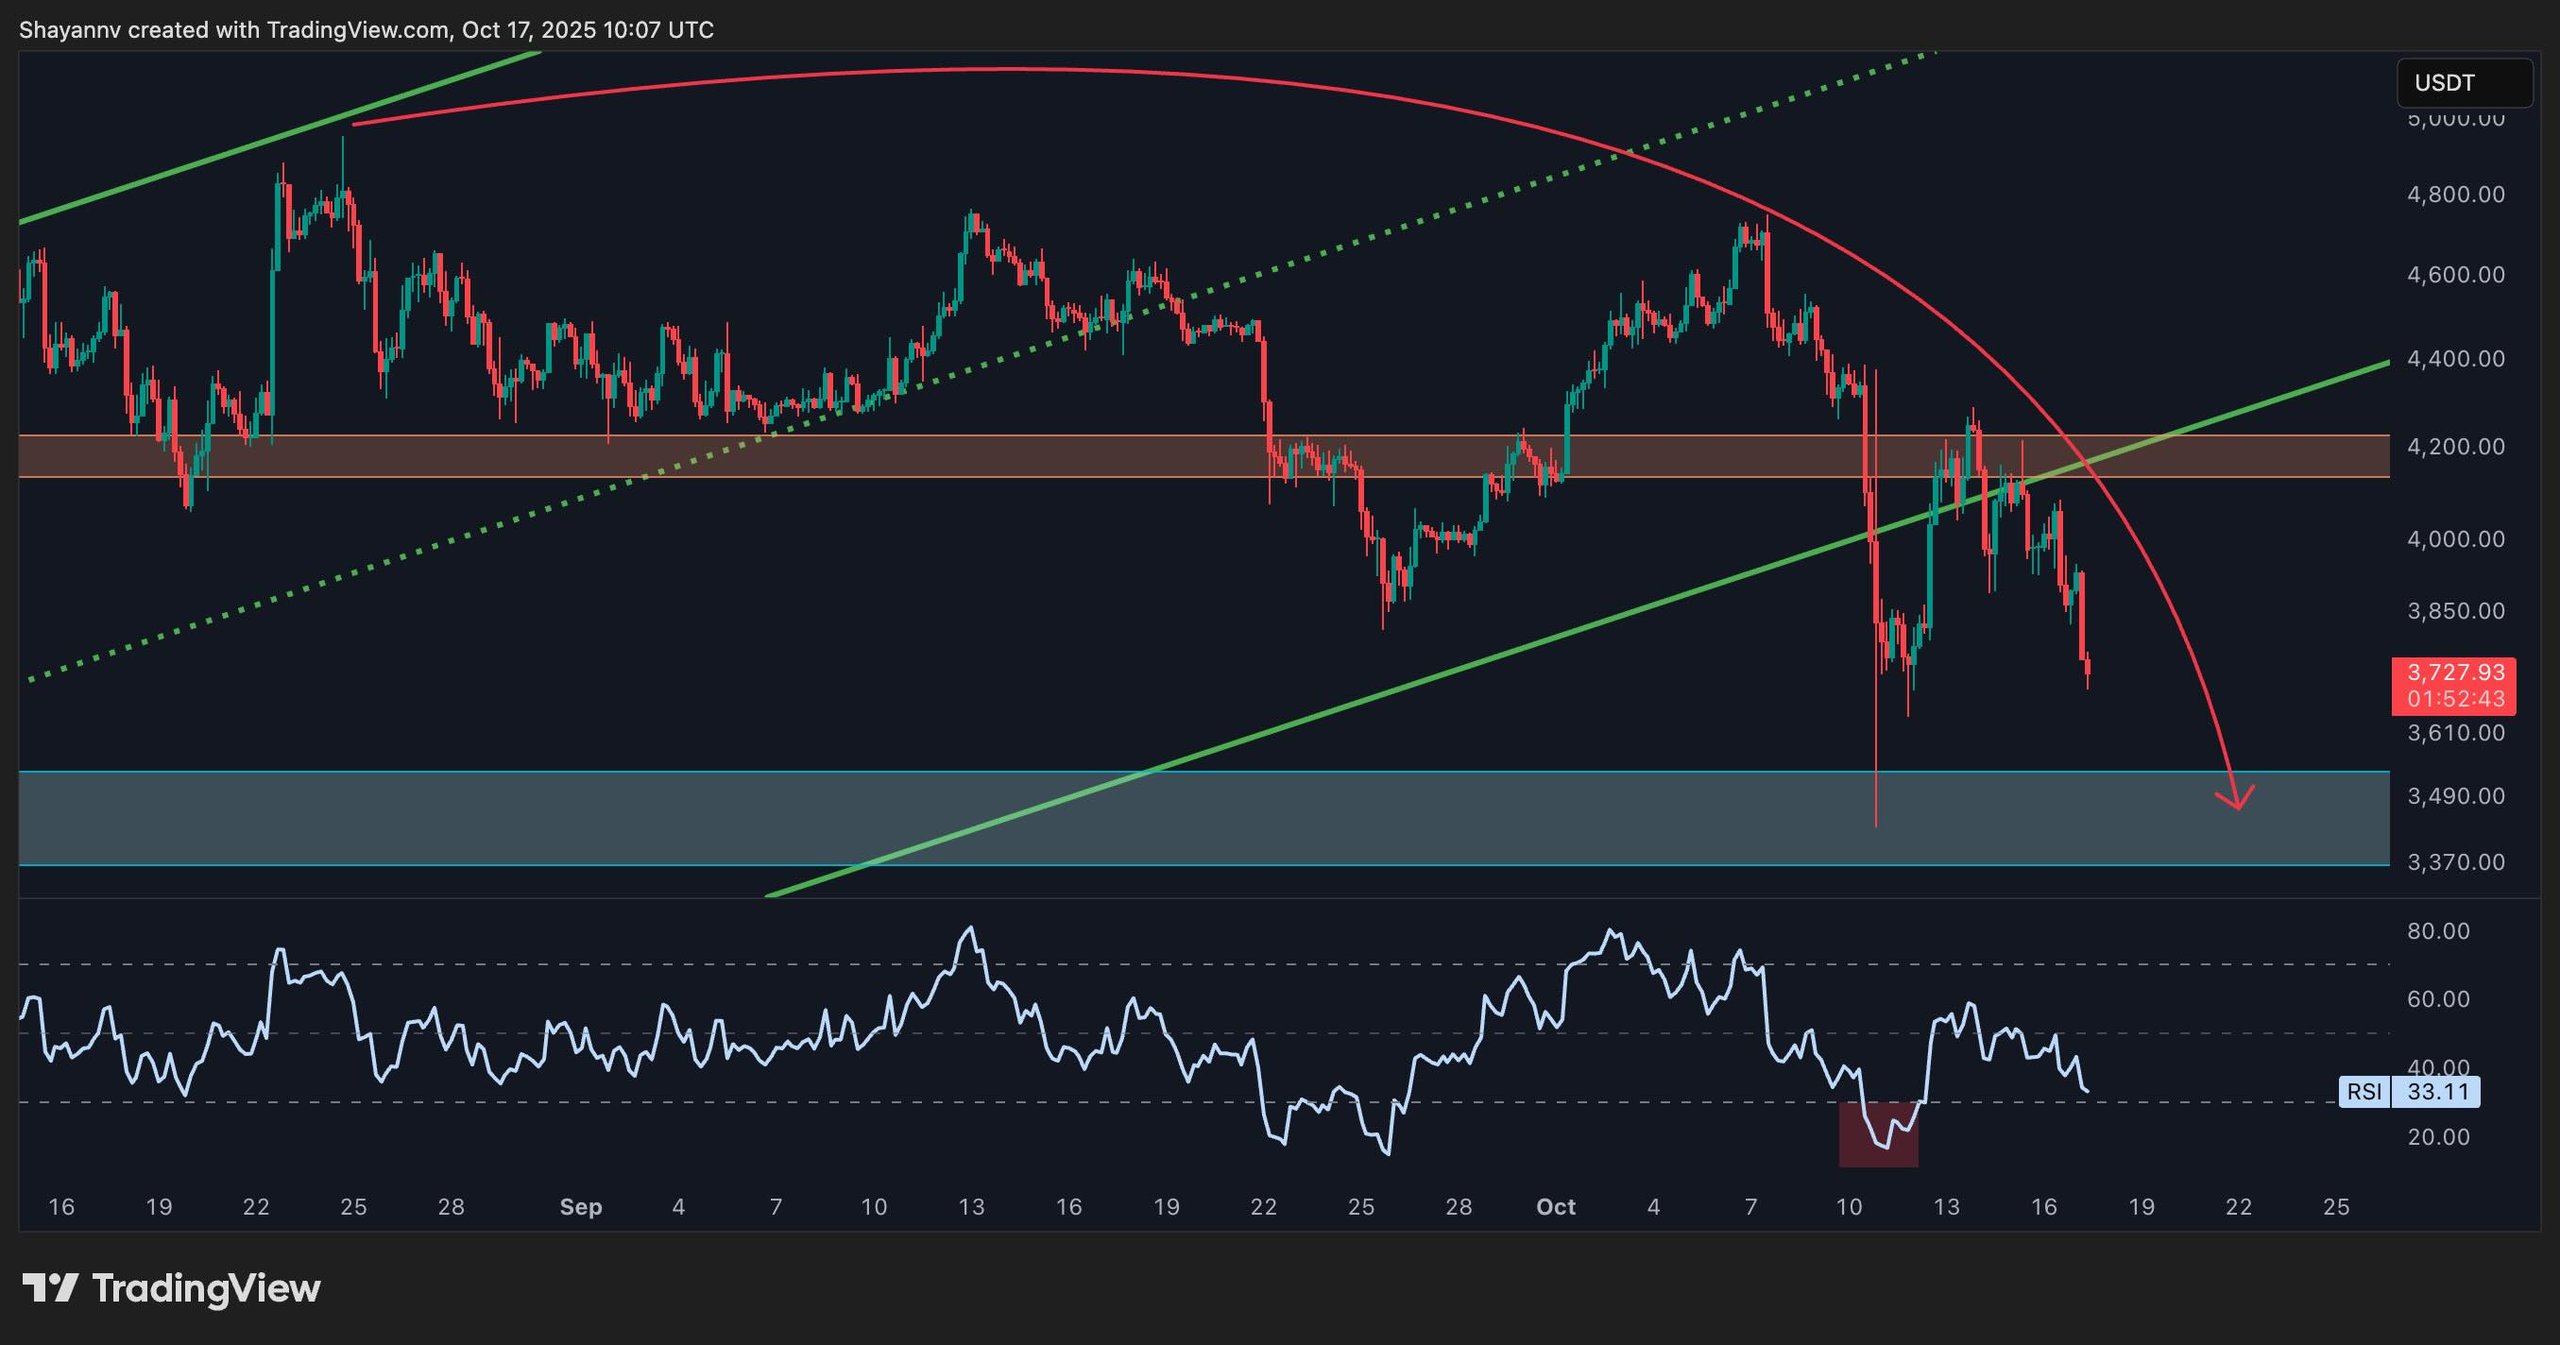 ETH 4-Hour Chart
Sentiment Analysis
Long Liquidations
The recent decline in Ethereum’s price has resulted in a significant surge in long liquidations across exchanges, marking it as one of the notable deleveraging events observed in recent memory. This unprecedented selling reflects how many long traders were unexpectedly caught off guard by the market’s rapid shift. Historically, such liquidation spikes often appear near local lows, yet the scale of this drop implies heightened panic among retail traders, while institutional investors seem to be adopting a wait-and-see approach for more definitive market signals before reinvesting.
In general, market sentiment appears to be cautious and risk-averse, with traders opting for a conservative approach over seeking aggressive long positions in the short term.
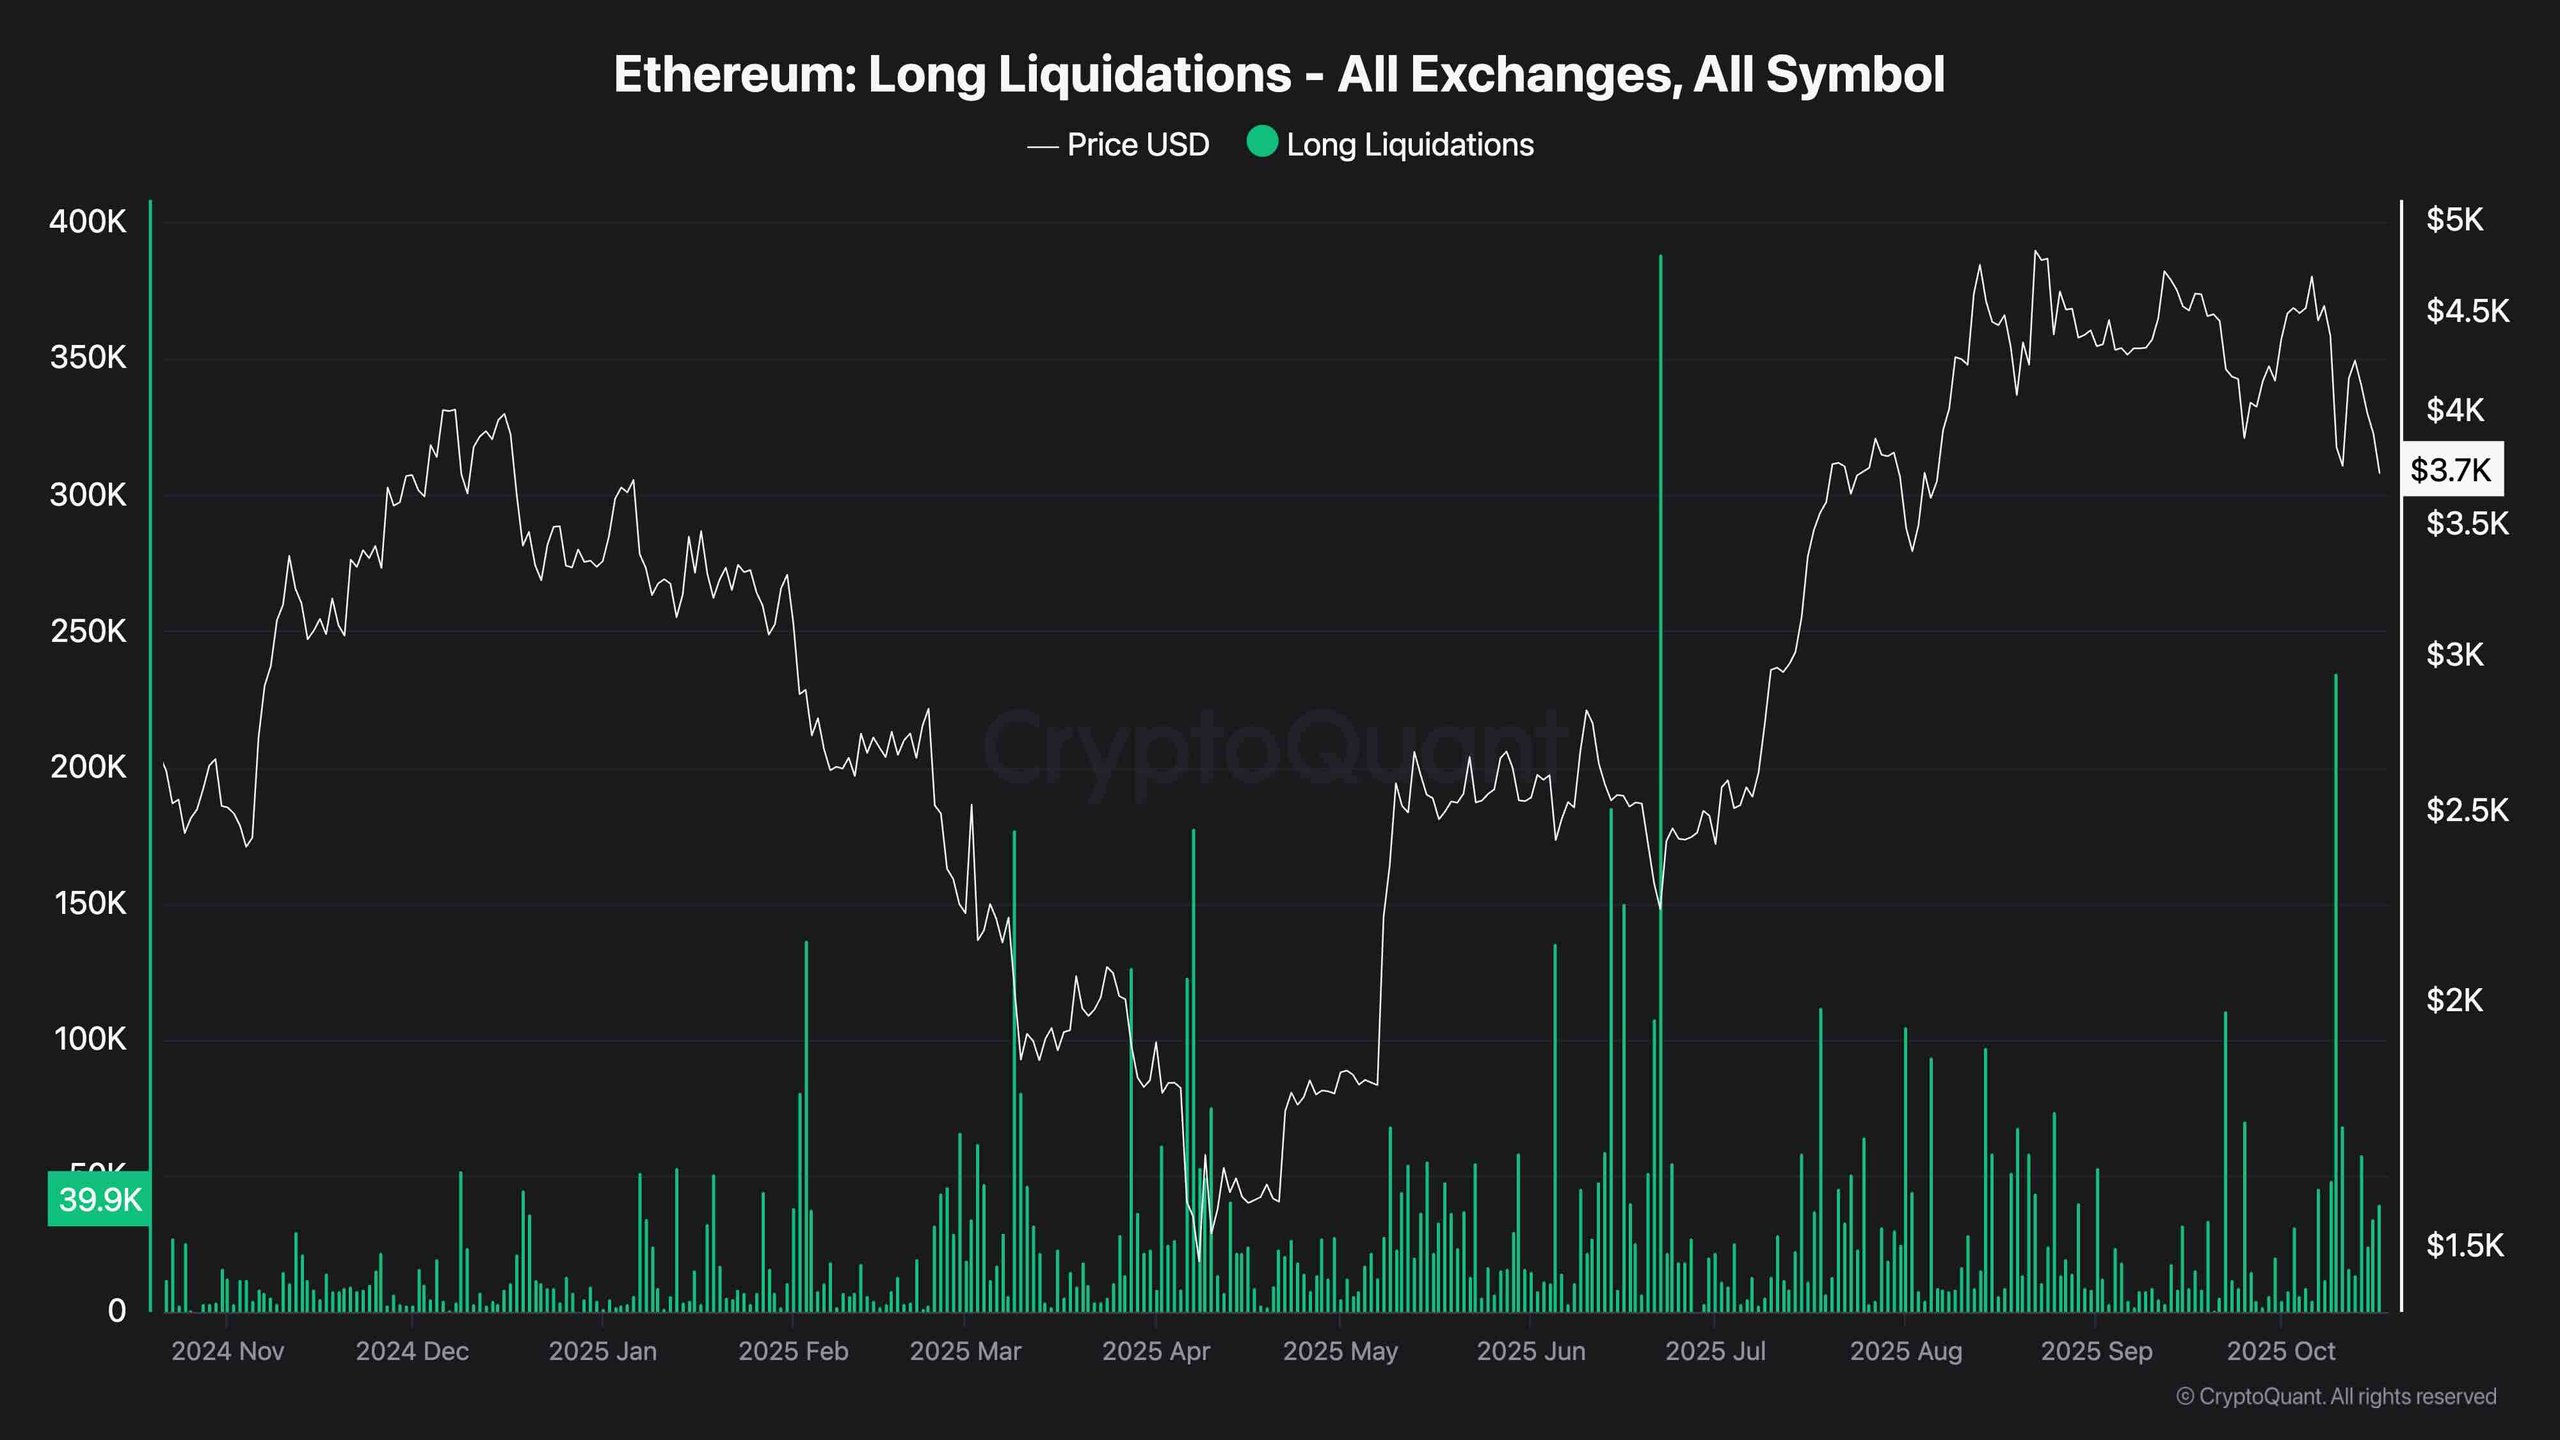 Long Liquidations
Special Offers
Exclusive Binance Offer: Register via this link to create a new account and access a $600 welcome bonus on Binance.
Learn more about CryptoPotato: Visit us for the latest market insights or invest responsibly!
