
Ethereum's Price Aims for $4,500: Will it Make a Comeback this October?
Ethereum shows promising signs of reaching $4,500 again this month, backed by strong chart patterns and onchain data.


Ethereum’s price is eyeing a rebound towards $4,500 as it aligns with a classic chart pattern and favorable on-chain MVRV data signaling potential upside momentum this October.
Key Highlights:
- Ether’s comeback from a vital support area puts the $4,500 mark back on the table.
- MVRV bands indicate ETH price remains above crucial support, targeting a rise to $5,000.
Ethereum’s native token, Ether (ETH), has surged over 15%, rebounding from its two-month low of $3,435. Several indicators suggest that ETH might reach the $4,500 level by the end of October.
Analyzing the Bull Flag Pattern
ETH’s current rebound suggests the formation of a bull flag pattern, a technical indicator often indicating a continuation of a prior upward trend following a brief period of consolidation.
In this scenario, the bull flag is depicted by a descending parallel channel, following a sharp increase from the low of $2,500 in April to a high of approximately $4,950 in August.
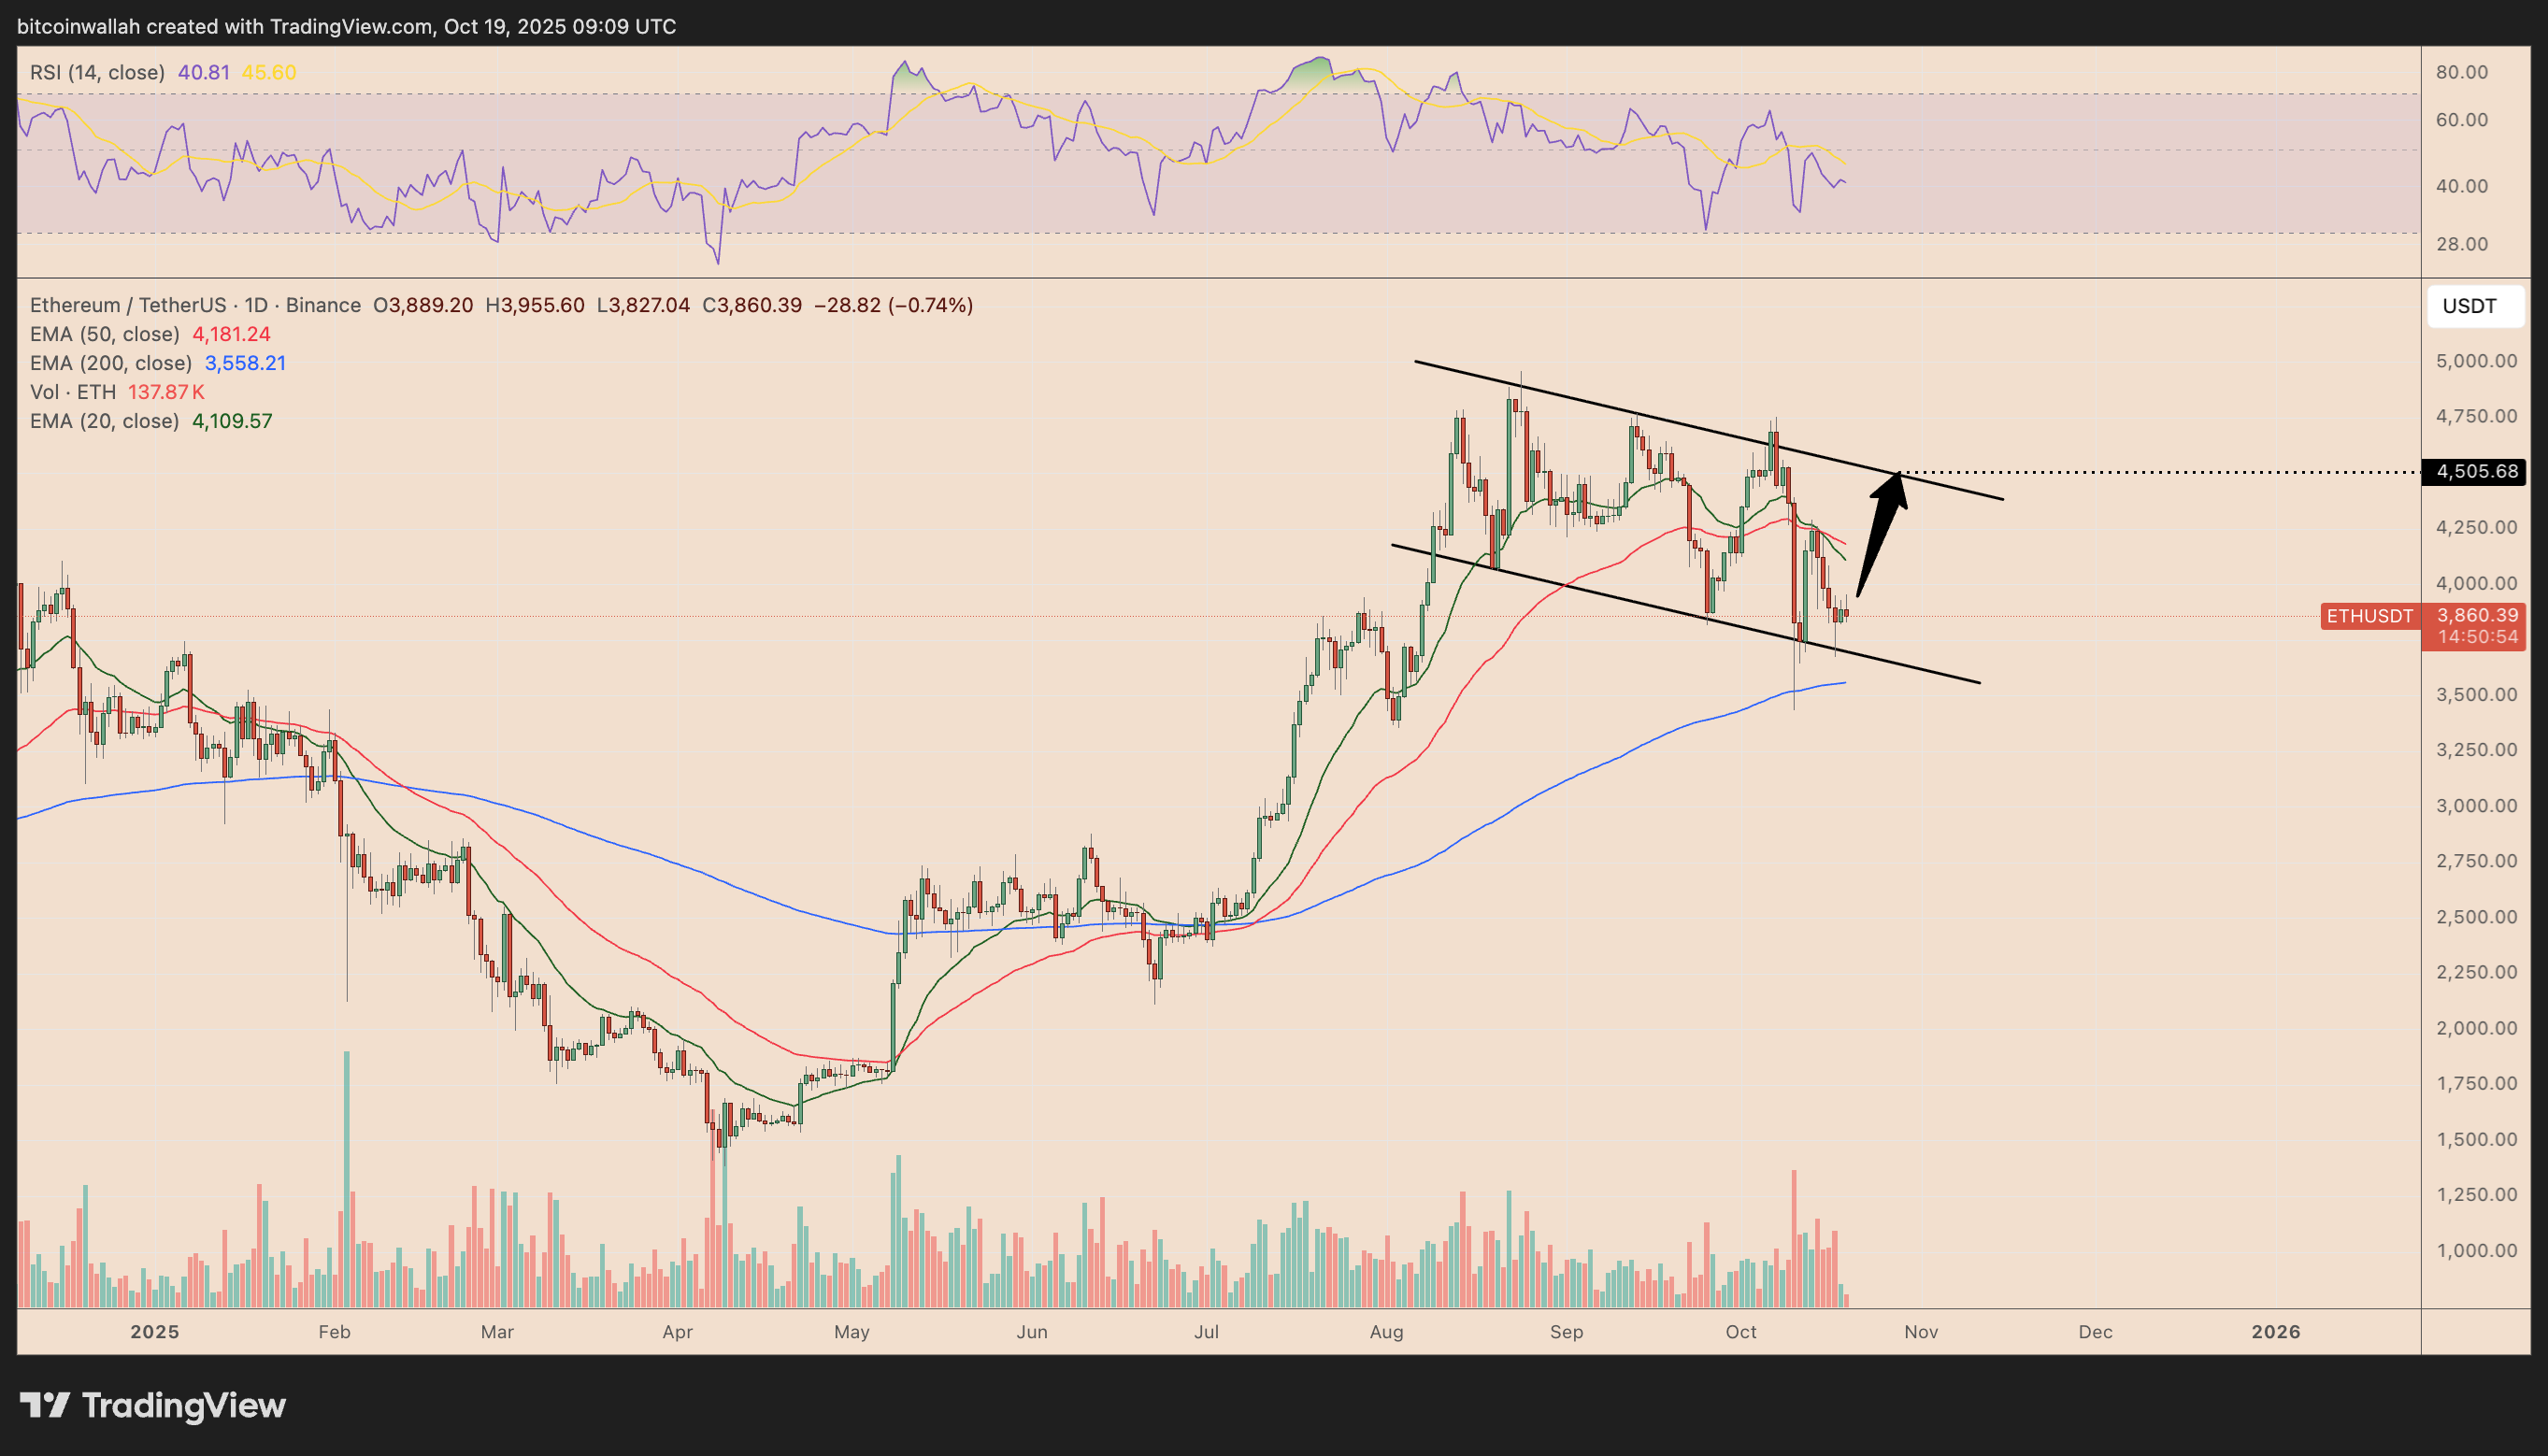 ETH/USDT daily chart. Source: TradingView
The bounce from the channel’s lower boundary around $3,500 coincides with support from the 200-day EMA, a level historically attracting buying interest during bullish market trends.
If this momentum continues, ETH could aim for a breakout towards the channel’s upper boundary, around the $4,450-$4,500 range in October.
The interim target aligns with analyst FOUR’s double bottom technical setup, which suggests ETH’s price could hit the $4,750 resistance neck in the upcoming days.
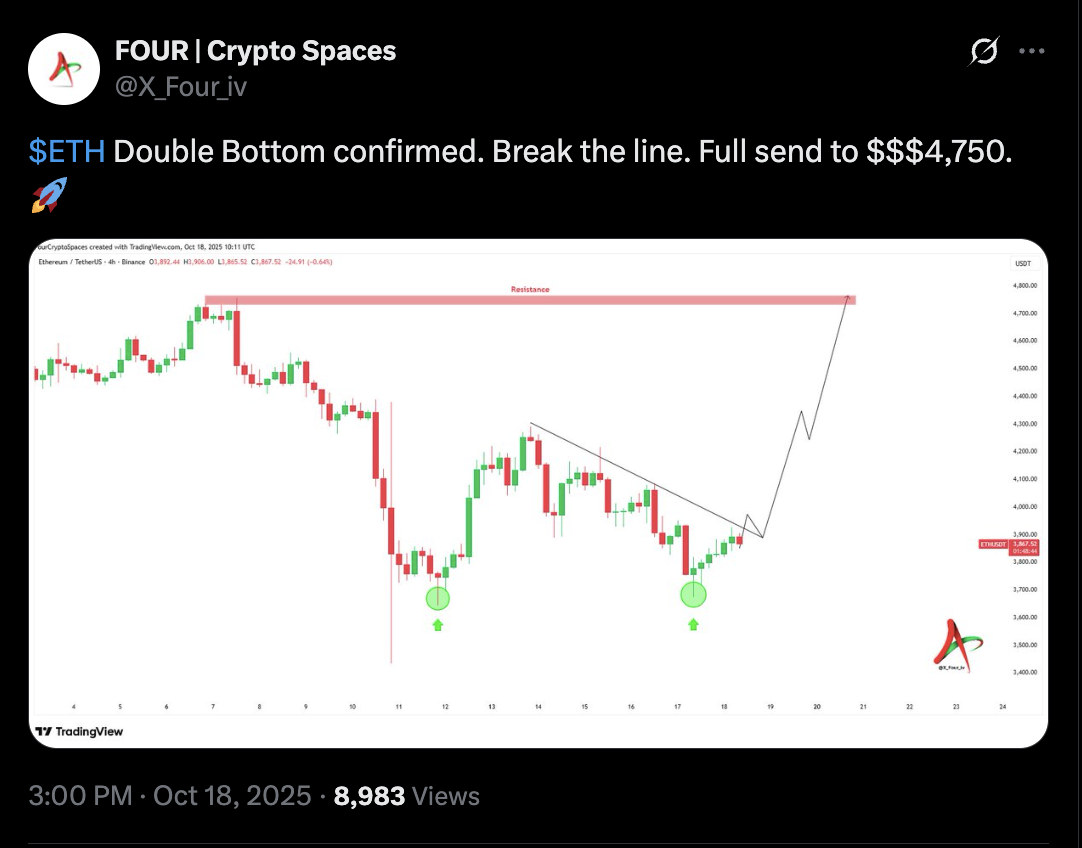 Source: X
Trader Luca anticipates a rally towards $4,500 given that ETH remains above its “weekly bull market support band.”
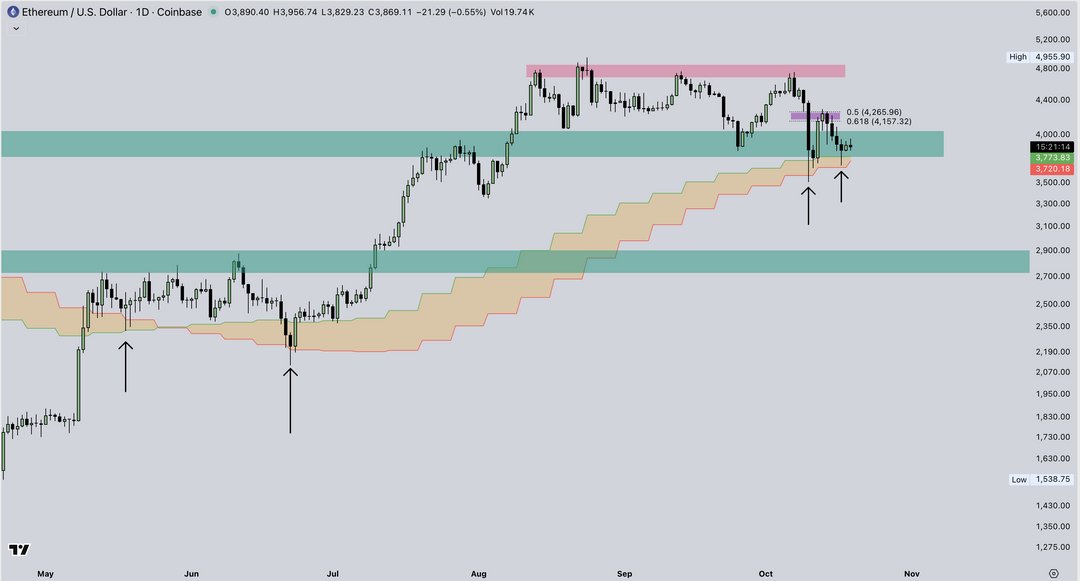 ETH/USD daily chart. Source: X/@CrypticTrades_
Alternatively, a breakout above this range might push the price towards a target over $5,200, which could establish a new record high by November.

However, trading below the lower boundaries of the bull flag and the 200-day EMA support around $3,550 could invalidate this pattern, leading ETH towards larger corrections between $3,000 and $3,200.
MVRV Analysis Supports $4,500 Target
The MVRV Extreme Deviation Pricing Bands for Ethereum indicate stabilization around the $3,900 mean band, historically serving as a foundation for new price rallies.

Each bounce off this midpoint in the past has progressed toward the +1σ band, presently around $5,000.
This pattern indicates that ETH is in a “healthy correction” phase of its bullish cycle rather than showing signs of fatigue. If the mean level persists as support, a move towards the $4,500–$5,000 range by late October appears statistically plausible.
Disclaimer: This article is not investment advice. All investment and trading activities involve risks; readers should conduct their own research before making any decisions.
